


INTRODUCTION
The genetic diversity of a commercial pig breed must be monitored to ensure the sustainable use of genetic resources and continuous genetic improvements in the future [1]. The importance of proper management of inbreeding through systemic breeding programs should be emphasized [2]. Traditionally, inbreeding has been estimated from the pedigree information [3], and the inbreeding rate can be converted to an effective population size (Ne), which is considered a general indicator of the risk of genetic erosion [4]. However, pedigree-based estimates of Ne depend on the completeness of the available pedigree. Genomic data are widely used improve the accuracy of Ne estimation without pedigree data, as these data allow estimations of current and previous Ne. This estimation is based on linkage disequilibrium (LD) patterns [5ŌĆō7]. Genome-wide single nucleotide polymorphism (SNP) genotyping of in pigs has been possible since 2009 [8]. In animal breeding, recent genomic methods such as genome-wide association studies and SNP-based genomic selection depend on the extent of LD and the association between the rate of LD decline with the distance between loci within a population. Researchers or animal breeders can apply mass SNP data, made available by SNP Genotyping Beadchips, to several genomic analyzes of domestic animals, including pigs. Researchers have already applied SNP chips to genome-wide association studies [9ŌĆō11] and genomic selection of pigs [12ŌĆō15]. This new SNP technology provides useful tools for studying the genetic diversity of pig populations and enables more detailed comparisons of populations than did earlier pedigree-based approaches.
In finite populations, several meaningful evolutionary processes involving artificial or natural selection can induce LD, or the nonrandom association of alleles in two different loci [16]. In particular, most traits of interest in animal breeding are complex traits, and genomic selection techniques are more successful than genome-wide association, which is used to investigate some significant genomic regions closely linked to each trait [17]. In animal breeding, these genomic methods strongly depend on the extent of LD and the sample size. Therefore, the characterization of LD is essential when planning future genomic technique-based animal breeding studies of complex traits. LD between loci can provide insights into the evolutionary history of each population through Ne, the number of individuals in an idealized population that would give rise to the degree of inbreeding in the current population [18]. If we accurately estimate Ne, we can use this value to investigate genetic diversity in each domesticated pig population and explain the observed extents and patterns of genetic variation. Using Ne, we can also prospectively predict the loss of genetic variation and infer the accuracy of genomic selection before applying genomic selection at an industrial level for a particular domesticated animal. Additionally, we can infer the ancestral Ne from the strength of LD at different genetic distances between markers. Knowledge of the historical Ne pattern in each pig population could increase our understanding of the effects of recent animal breeding strategies.
Although the Korea pig industry includes several breeds, this study focuses on the Landrace population. Although this is not a domestic breed in Korea but rather has been imported from several countries, Landrace is considered a representative maternal pig breed in Korea, and Korean grand-grandparent (GGP) Farms maintain a considerable number of Landrace animals as breeding stock. For the Korean Landrace population, a good growth rate, efficient feed conversion rate, and increased piglet number are considered the main selection targets. The patterns of LD in Landrace populations from other countries have already been characterized, and estimated Ne values have been predicted using SNP chip data. Badke [19] characterized the extent of LD in four US pig breeds, including Landrace. Lei Wang [20] characterized the extent of LD in three Danish pig breeds, including Landrace. Veroneze [21] characterized the extent of LD of six commercial pig breeds (including Landrace) in the Netherlands. This study identified that the LD declined as a function of distance (using 37,326 SNPs with an average minor allelic frequency of 0.283 in the Illumina PorcineSNP60 chip) and all pig lines had an average r2 above 0.3 for markers 100 to 150 apart. Uimari [22] characterized the extent of LD and estimated the LD-based actual and ancestral Ne values using 86 Finnish Landrace boars. This study reported average LD (r2) between adjacent SNP in the Illumina PorcineSNP60 BeadChip was 0.43 (57% of the adjacent SNP pairs had r2 >0.2) for Finnish Landrace and Ne estimates based on the decay of r2 with distance were similar to those based on the pedigree data: 80 for Finnish Landrace.
The objective of the present study was to characterize LD within the Korean Landrace population, using data from the Illumina PorcineSNP60 BeadChip and to estimate the current and ancestral Ne values and thus dissect the genetic characteristics of Korean Landrace population. The estimated Ne (┬▒standard deviation [SD]) of the Korean Landrace population was 92.27 [79.46; 105.07] individuals. Additionally, ancestral Ne was estimated in previous generations. Compared with other studies, our results are considered in the context of current knowledge regarding the establishment of genomic methods for the Korean Landrace population.
MATERIALS AND METHODS
Samples and genotypic data
This study included genotype data of 1,128 Landrace individuals from three representative Korean major GGP farms (Table 1). This single population sample was considered representative of the Landrace population in Korea. These pigs were candidate replacements for breeding pigs at each major GGP or grandparent (GP) farm during the period of 2015 through 2016. Accordingly, we considered these 1,128 Landrace individuals representative of the current Landrace population in Korea. The Illumina PorcineSNP60 version2 BeadChip, which targets 61,565 SNPs located across all autosomes and mitochondrial and sex chromosomes, was used to produce the dataset used in this study. The informative SNPs on the Illumina BeadChip were extracted from the latest porcine reference genome (Build 9) from the Ensemble genome database (www.ensembl.org). Using Illumina PorcineSNP60 version2, we obtained genotyping data of 1,128 Landrace individuals. BeadChip data were subjected to quality control using PLINK [19]. First, we extracted 52,257 of the total 61,565 SNPs on all autosomes and removed SNPs which failed to pass quality control criteria. 2,905 SNPs were excluded in a HardyŌĆōWeinberg equilibrium test (p value <0.000001) and 457 SNPs failed to pass the missing genotype test (GENO >0.1). Also 11,947 SNPs with minor allele frequencies (MAF) <0.05 were removed after the minor allele frequency test (MAF<0.05). These standard genotype data quality control criteria were identical to those used by Uimari [20]. After quality control, we used the remaining 38,254 SNPs to characterize LD and estimate the Ne. Before estimating LD, missing genotype in SNP after quality control were imputed with BEAGLE [21].
Characterization LD of Korean Landrace population
We estimated LD in the Korean Landrace population using the R package ŌĆ£LDcorSVŌĆØ [22]. This package was used to estimate pairwise haplotype frequencies from genotype data. The estimated pairwise haplotype frequencies were used to calculate the squared correlation coefficient between the two loci (r2). The r2 was equivalent to the covariance and correlation between alleles at two different loci and was computed as follows:
Where, PA, Pa, PB, and Pb are the frequencies of alleles A, a, B, and b, respectively. PAB is the frequency of the genotype AB and D represents PAB - PAPB.
For each SNP, the pairwise LD was calculated for 100 adjacent SNPs in the genomic dataset from 1,128 Landrace pigs. The SNP quality and distance requirements led to the distribution of approximately 3.698 million SNP pairs across the total autosome. The r2 values were calculated between SNPs located on the same chromosome. Details about the physical positions of the SNPs can be found in the product literature from Illumina. To determine LD with respect to the physical distance between SNPs, we divided SNP pairs into distance bins. After establishing two classes, 0 to 0.5 Mb and 0 to 5 Mb, we subsequently classified the applicable SNPs pairs from each class into 50 distance bins with class-dependent ranges (Supplementary Table S1).
Construction model of LD with distance
Assuming an isolated population with random mating, Sved suggested the following approximate expression for the expected r2 [5]:
In this equation, N is the Ne, and c is the recombination frequency. In this study, as in previous studies, c was replaced with the linkage distance in Morgans [7,23ŌĆō25]. This process used the approximation from the more precise equation for E(r2) given by Sved in 1971 [5]. Based on this formula, a non-linear least-squares approach was used to statistically model the observed r2 within R, as follows:
In this equation, yi is the r2 for SNP pair i at a linkage distance di (Morgans). Parameters a and b were estimated iteratively using the least-squares method. In Figure 2, chromosome-specific megabase-to-centimorgan conversion rates were calculated from the total physical chromosome lengths stated on the UCSC Web site (genome.ucsc.edu) and from each chromosome genetic length on the porcine linkage map [26]. The study by Tortereau [26] included porcine linkage maps for four pedigrees (ILL, UIUC, USDA, ROS). Because the USDA breed of USA pedigree contained Landrace at the time of pedigree establishment, we selected USDA pedigrees for this study. We then applied this model to the data of each chromosome and estimated the described parameters. As described by Corbin [27] and Shin [28], the estimated parameters were combined by meta-analysis in R using an inverse variance method for pooling and random effects method based on the DerSimonian-Laird method (the R package ŌĆ£metaŌĆØ) [25,27].
Ancestral Ne estimation
We could predict the Ne using Equation (2) at a given point in time, expressed as a previous generation [7].
Where NT(t) is the Ne t generations ago, c is the distance between markers in Morgans, r2c is the mean value of r2 for SNP pairs located c Morgans apart, and c = 1/2t when assuming linear growth [7]. To estimate NT(t), the number of previous generations was selected and the appropriate range of c was calculated. The binning process was designed to ensure sufficient SNP pairs within each bin and to obtain a representative r2 mean when estimating the ancestral Ne. This process was performed for SNPs pooled across autosomes. The bin information used to estimate ancestral Ne is presented in Supplementary Table S3.
RESULTS
Genotype data
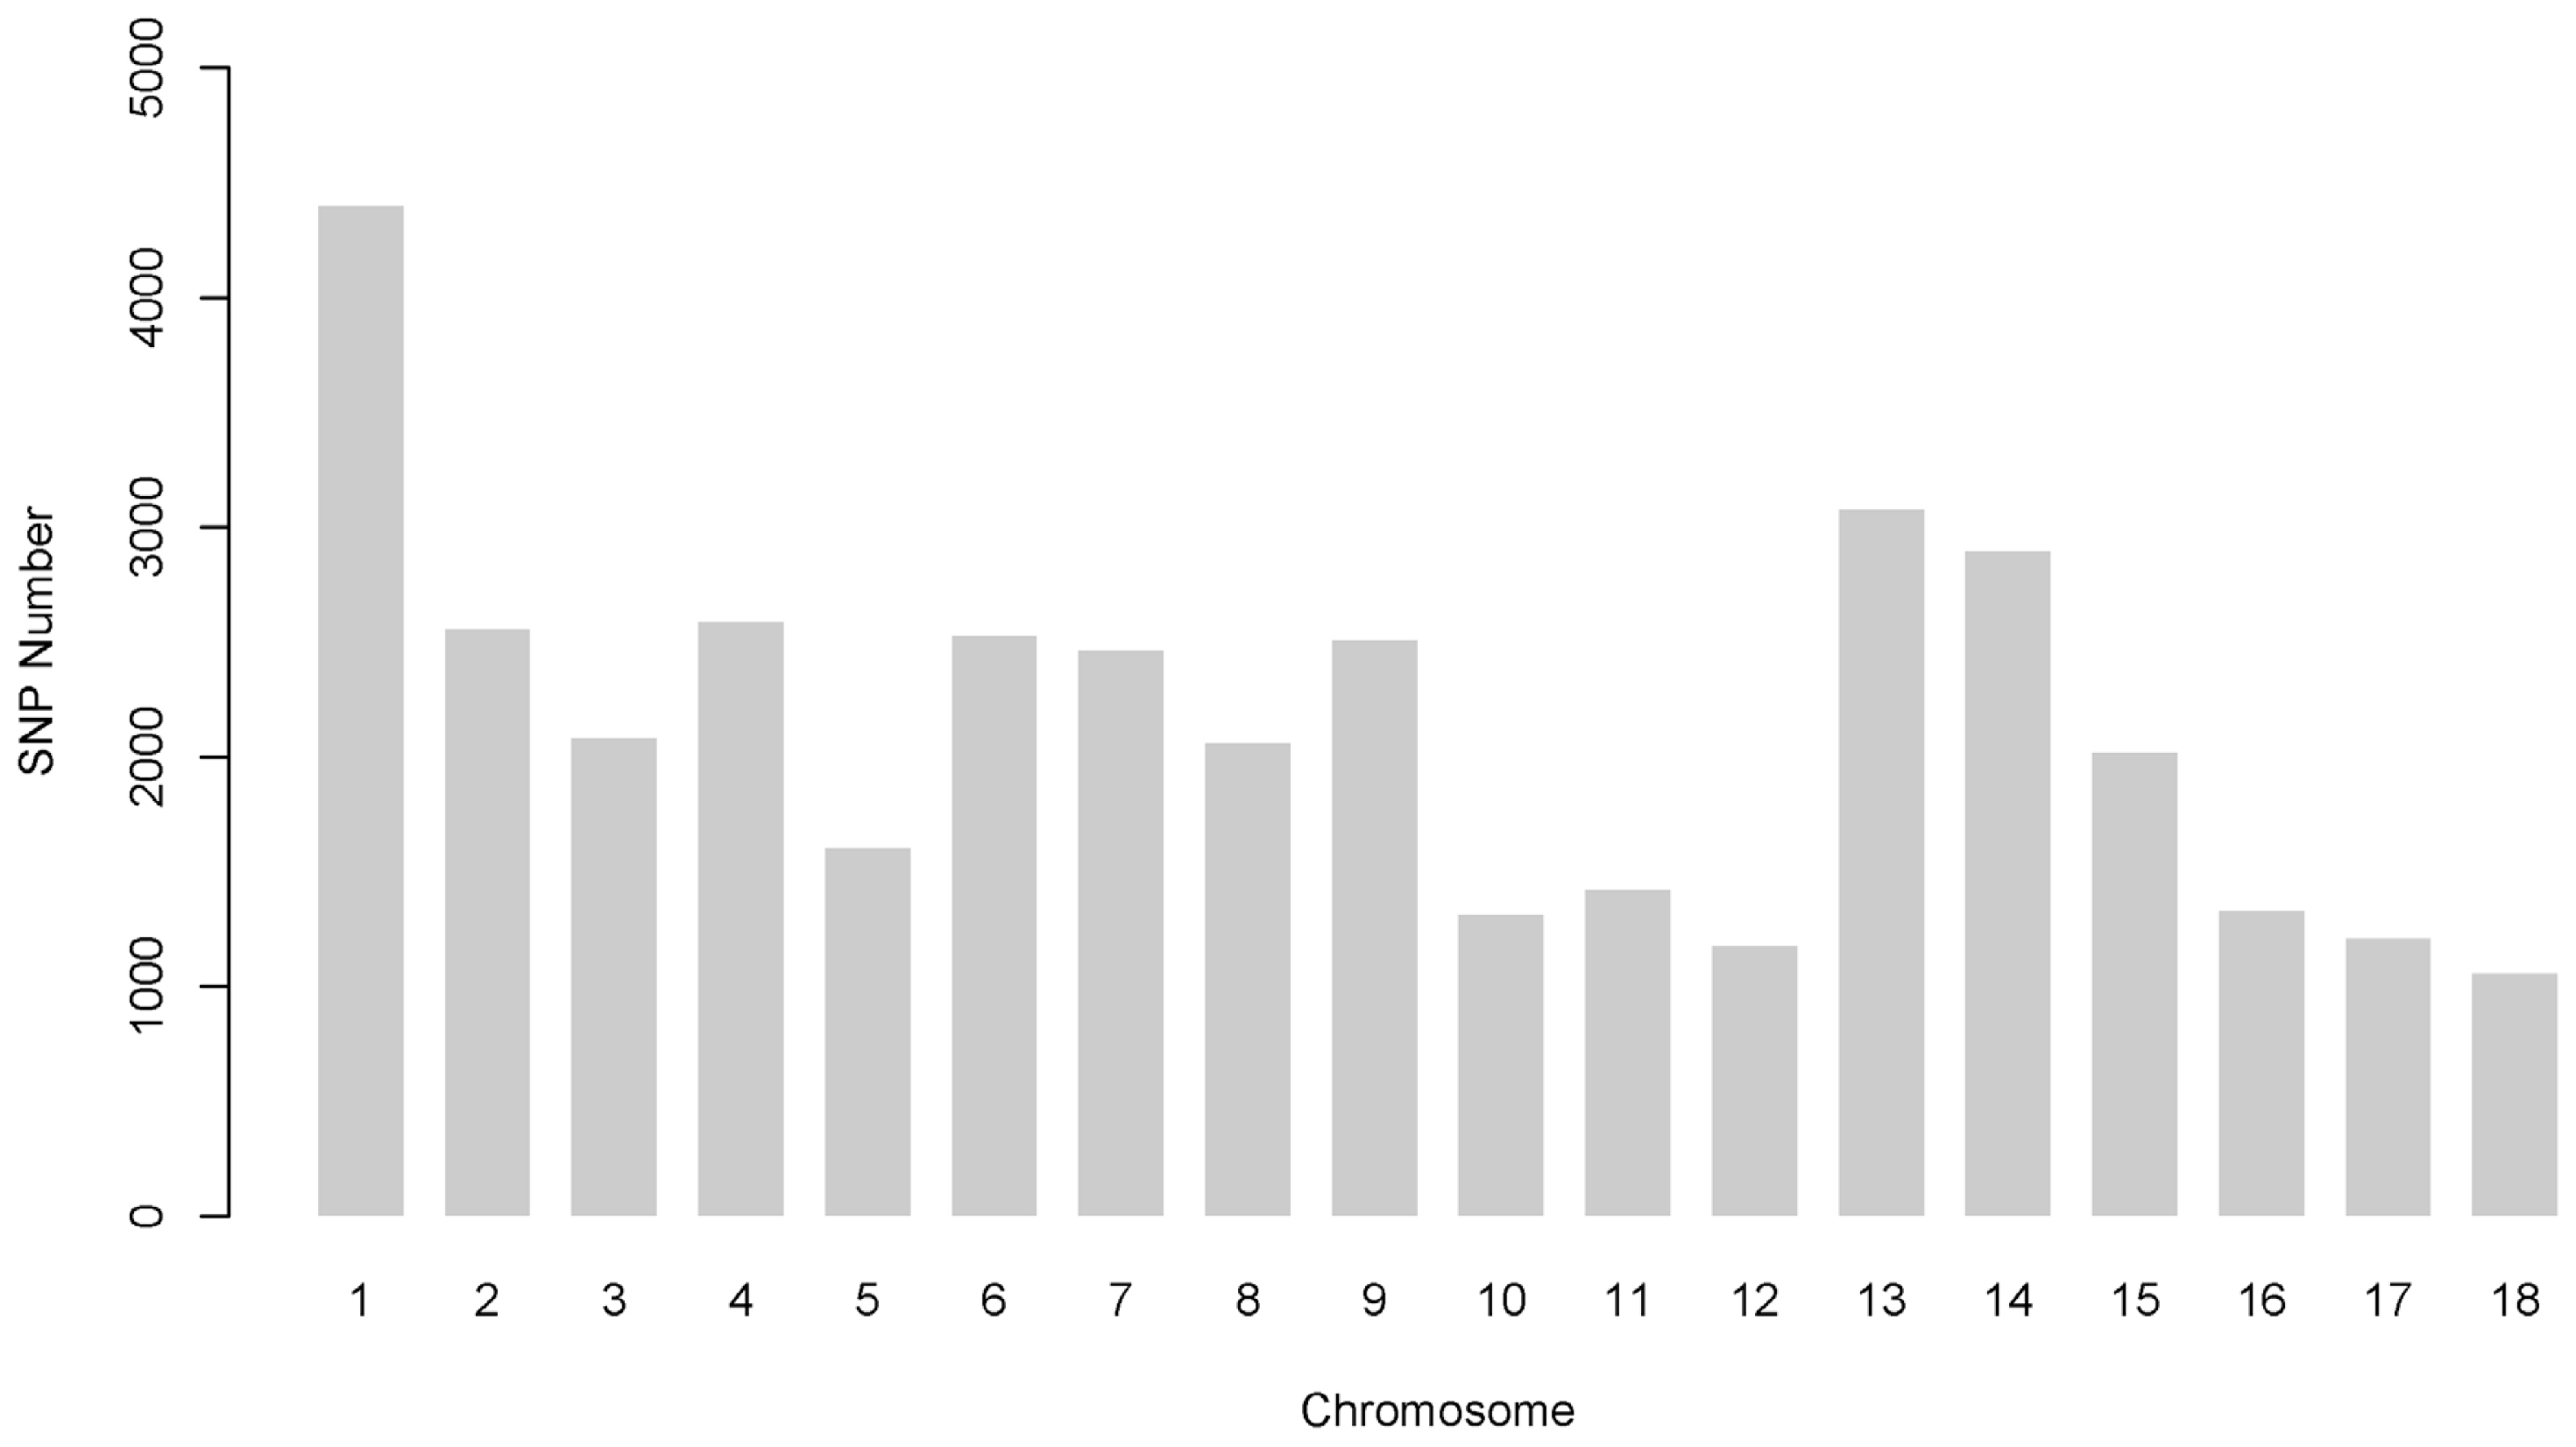
Among the 52,257 autosomal SNPs genotyped in this analysis, 38,254 (73.20%) remained after quality control. After filtering and imputation, the number of SNPs per autosome ranged from 1,054 to 4,398, and this value was closely related to the chromosome length and the total number of SNPs, as shown in Figure 1. The remaining minor allele frequency of SNP exhibited a uniform distribution, with an average of 0.285┬▒0.127 (SD). The mean distance between SNP pairs from this analysis was 3,159┬▒2,433 kb (range: 0.000009 to 26,139 kb) (Supplementary Figure S4).
LD estimation
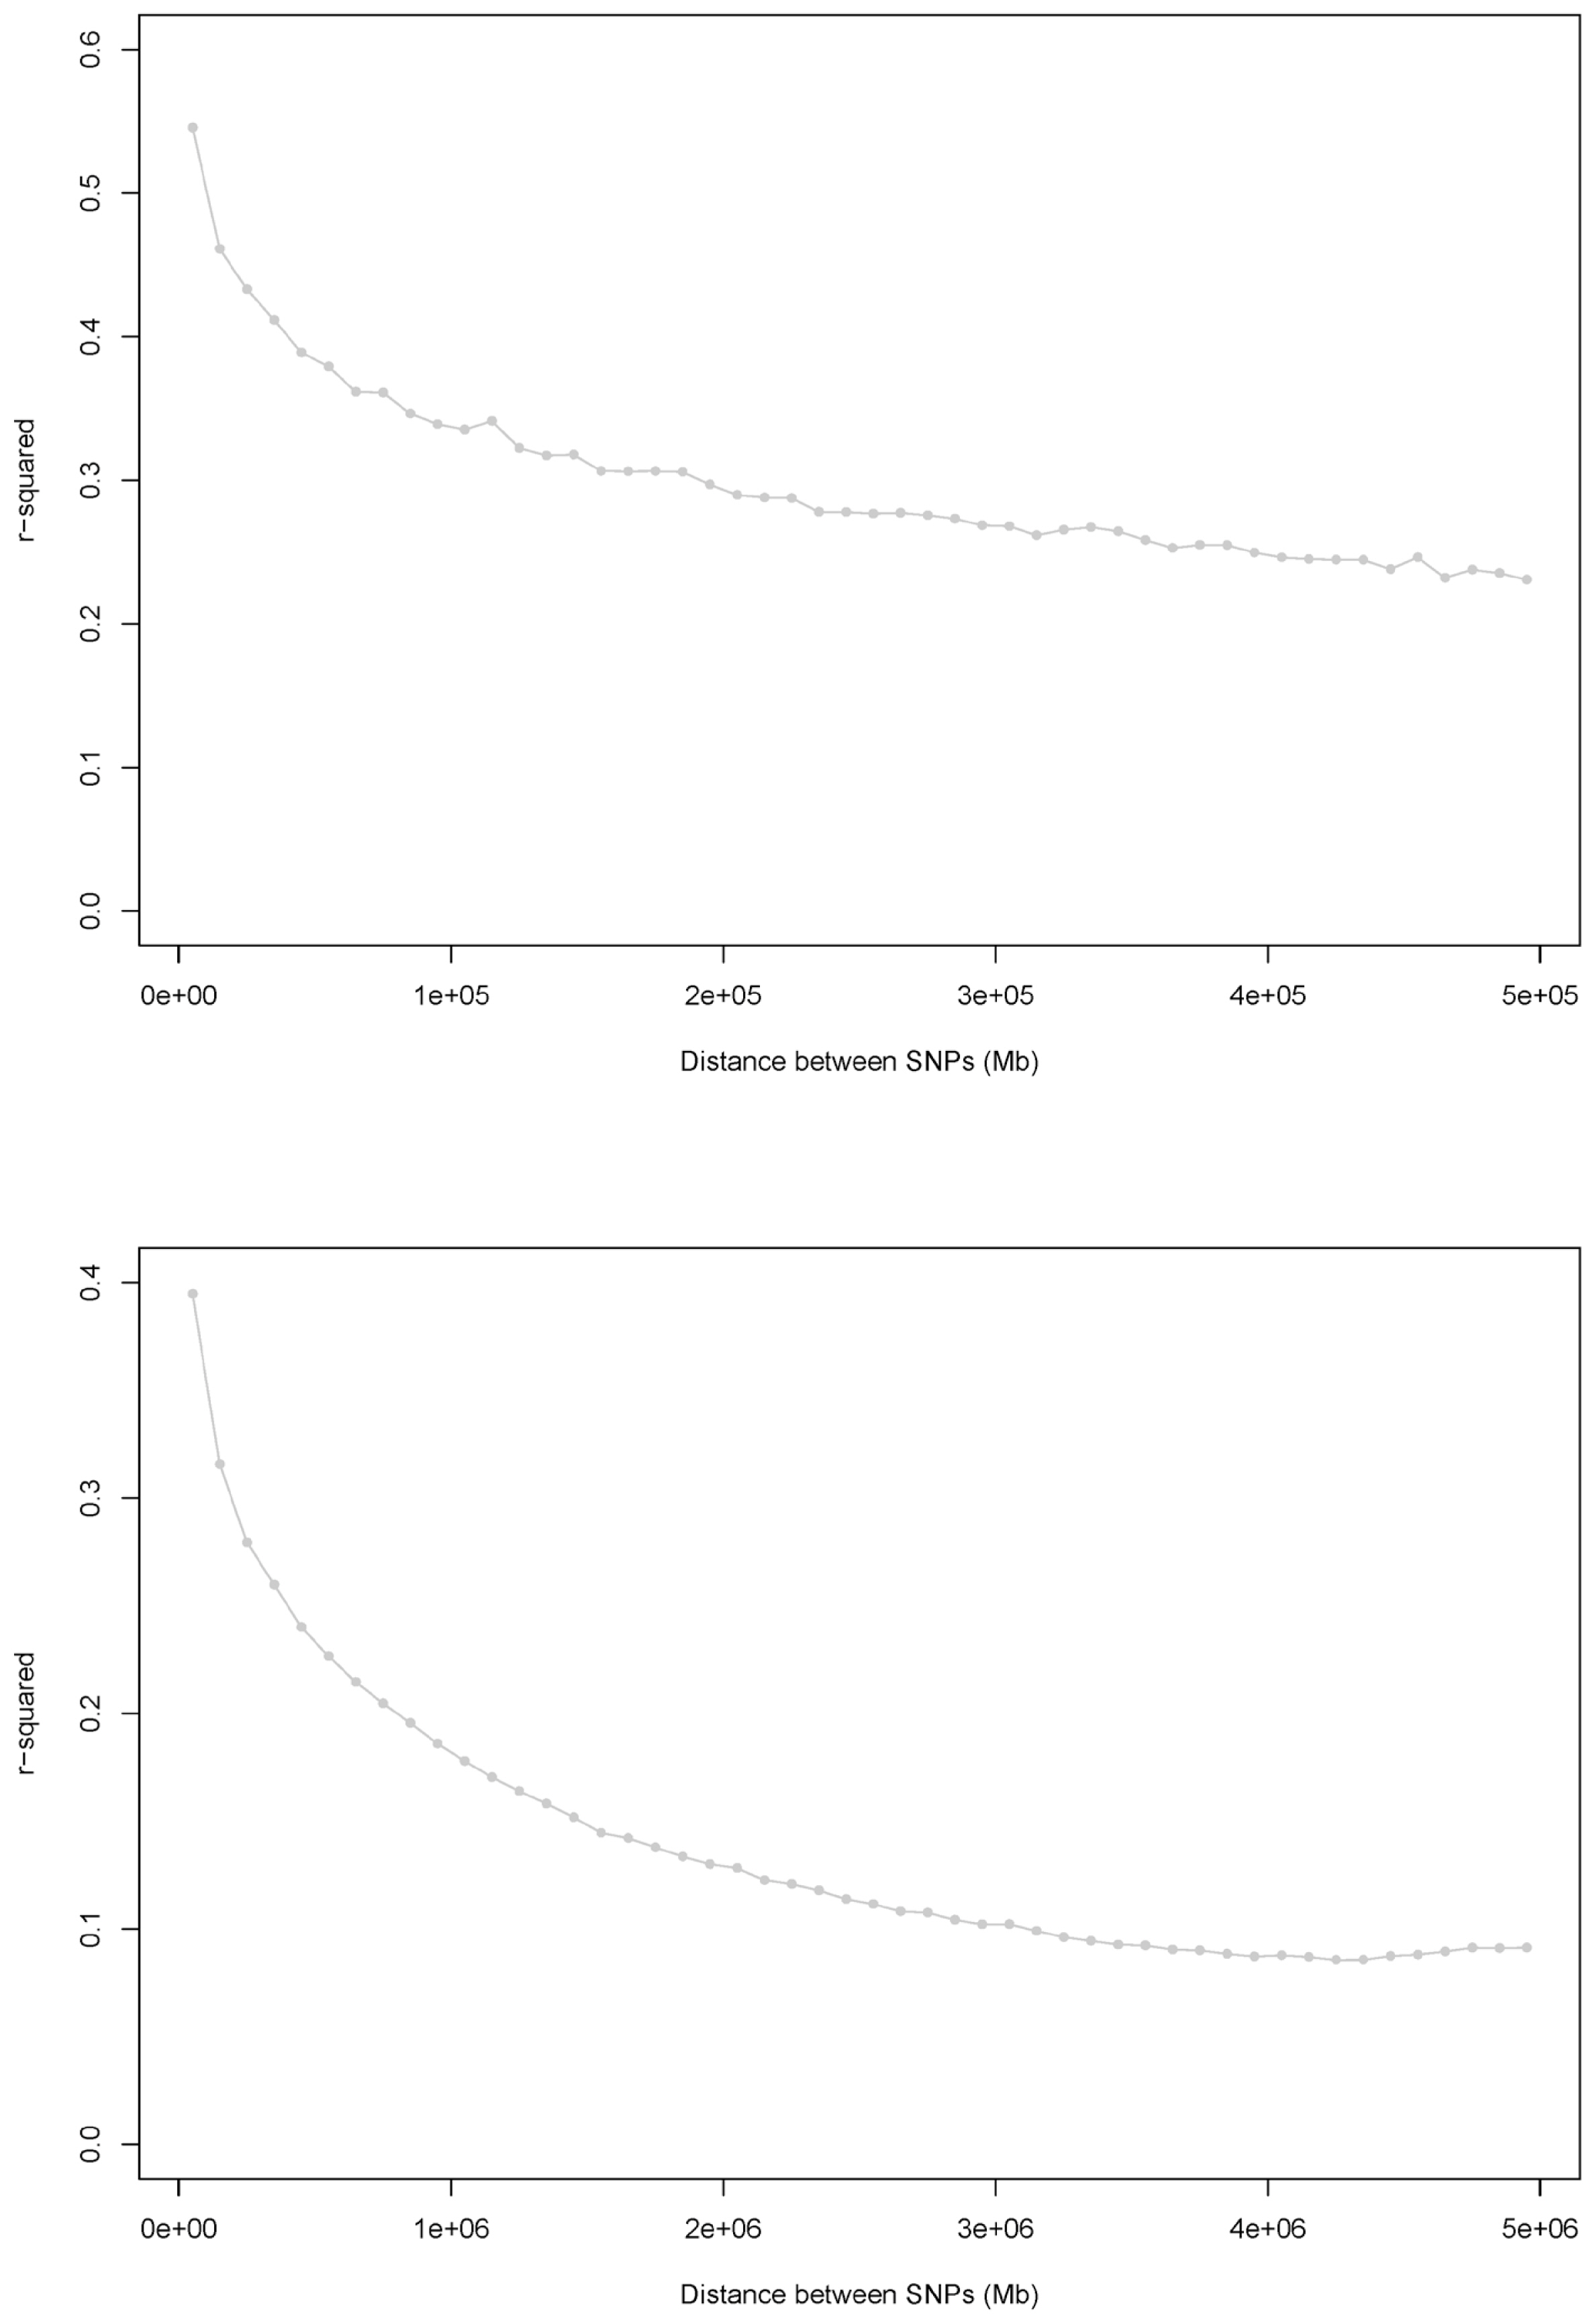
We show the relationship between physical distance and r2 for two loci on the same chromosome in Supplementary Figure 2. The two mean r2 types for each of the distance bins were plotted against the medians of the distance bin range (Mb), as shown in Figure 2. In this study, the mean LD (r2) among the total 3.698 million SNP pairs in the Korean Landrace population was 0.135┬▒0.204. For 36,025 SNP pairs, the distance was less than 50 kb; of these, 52.61% had an r2>0.3 and 61.87% had an r2>0.2. The average LD values for SNPs at distances of 50 kb on different autosomal chromosomes ranged from 0.379 to 0.500, and the average LD (r2) for those at distances of 5 Mb ranged from 0.099 to 0.219 (Supplementary Table S4). To identify degree of LD of each chromosomes, we observed some inter-chromosomal variations in the extent of LD. For two SNPs separated by <5 Mb, we observed the greatest and least mean LD (r2) on chromosomes 1, 13, and 14 and on chromosomes 10 and 12, respectively. These results agree with those of UimariŌĆÖs study [14], as well as results from the Korean Yorkshire population (data not shown).
Figure 2 shows the average LD across all autosomal chromosomes. The most rapid decline was observed in the first 10 bins (distances between SNPs of 0 to 0.1 Mb), and the mean r2 decreased by approximately 40% (Figure 2a). The most rapid decrease was observed over the first 10 bins, with a decrease in the mean r2 of approximately 53% (Figure 2b), either. The mean r2 decreased much more slowly as the distance increased and remained constant at distances of Ōēź3 Mb. According to the r2 calculations, 8,085 of the 3.698 million SNP pairs were in complete LD.
Construction model of LD with distance
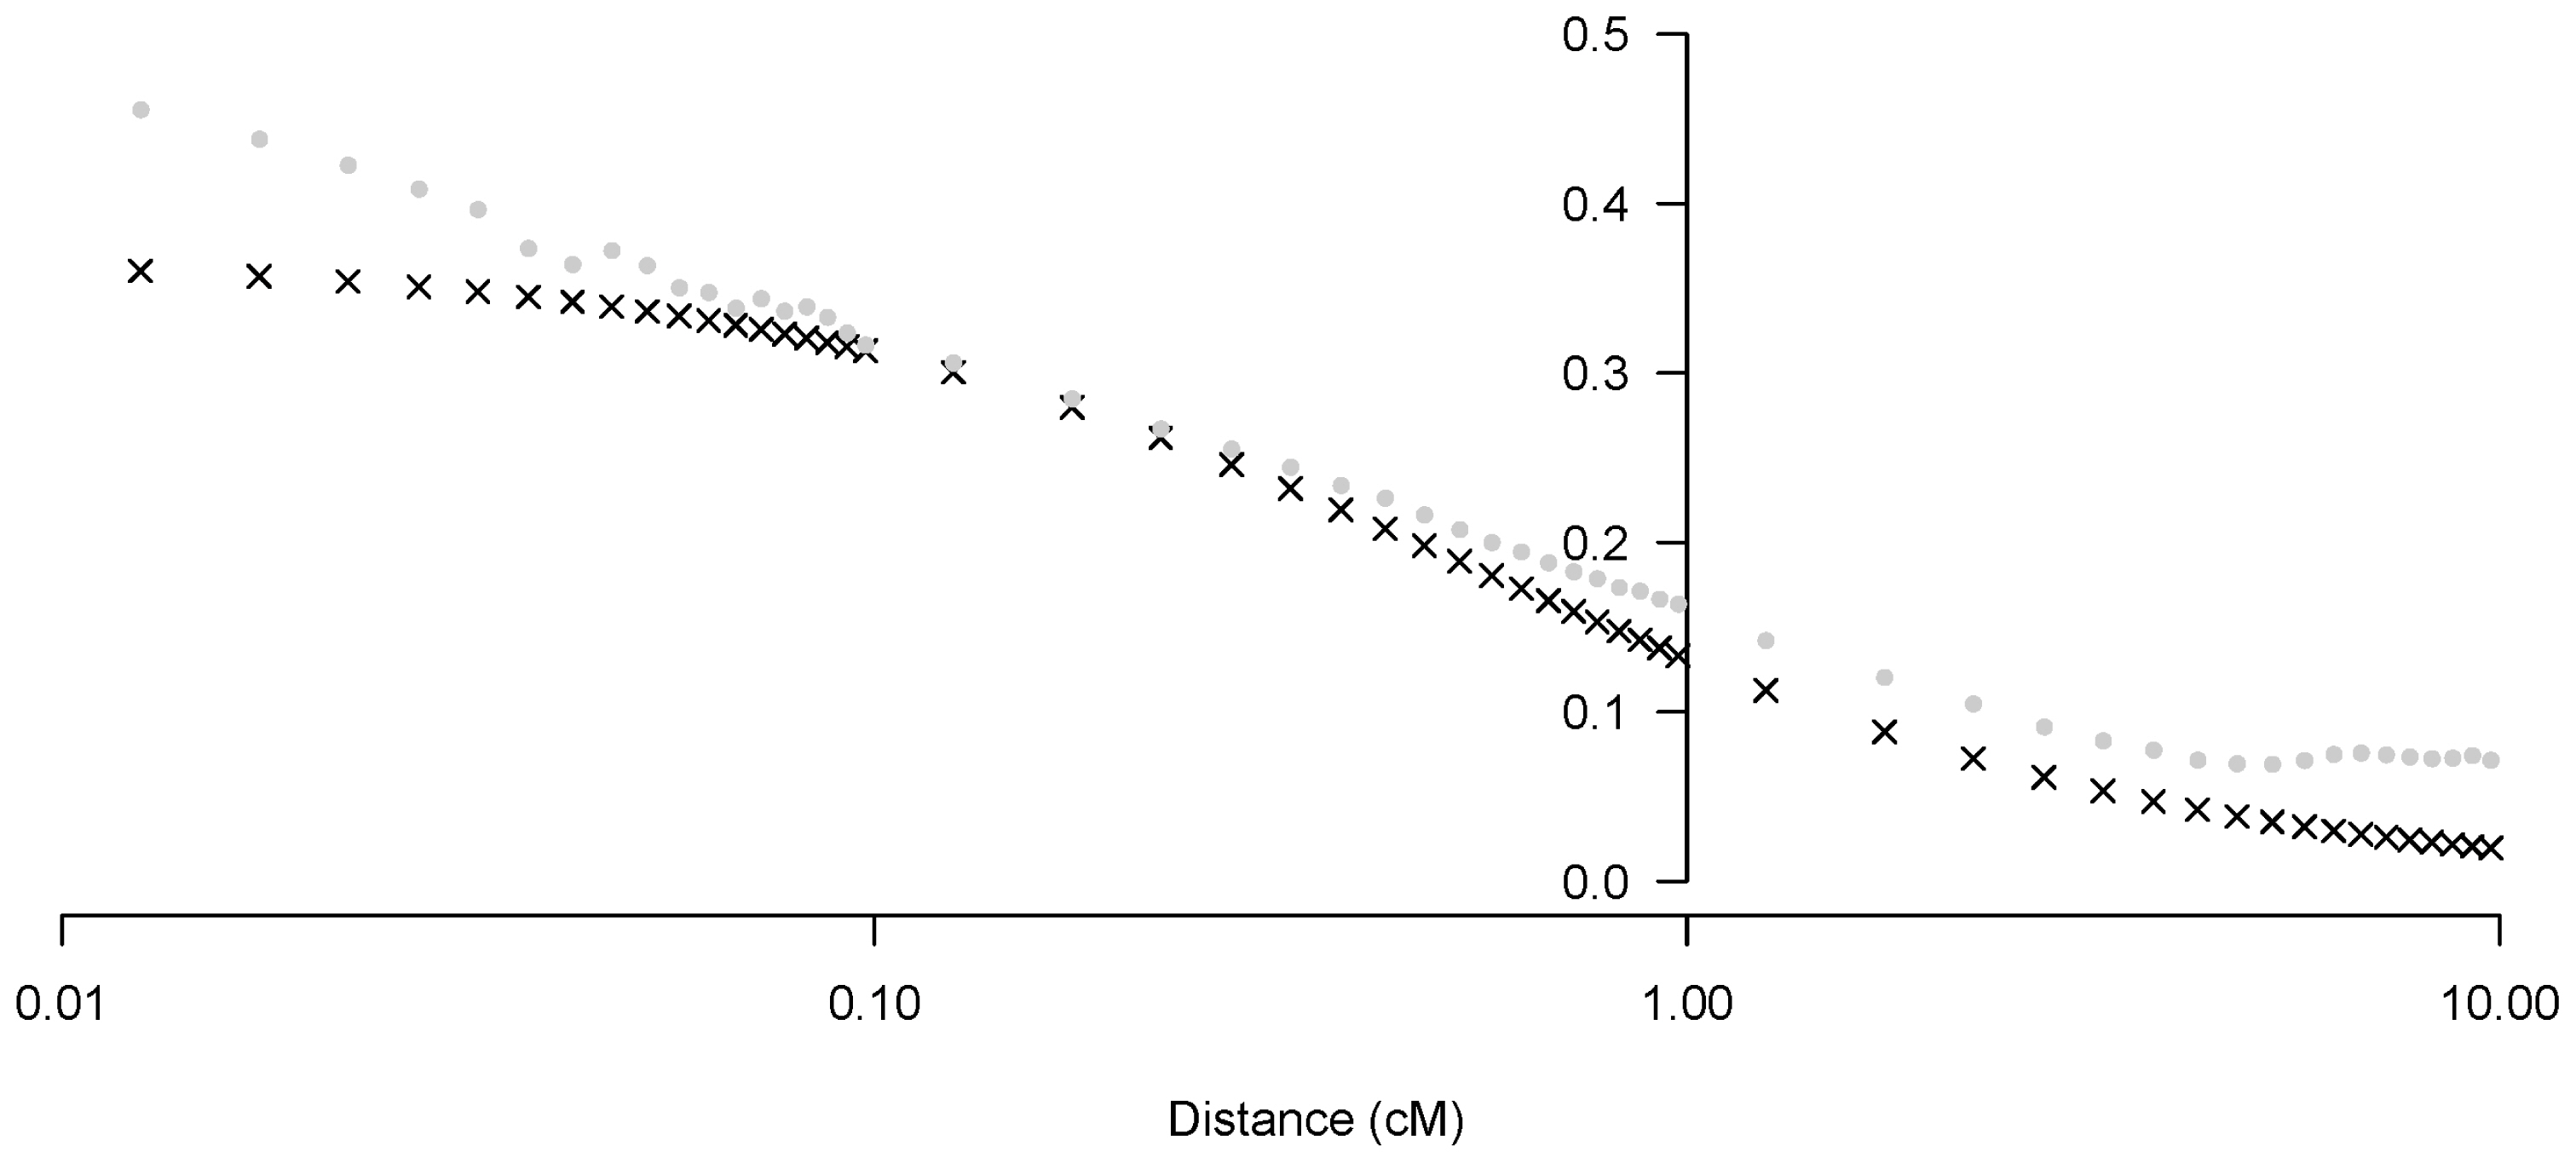
In the non-linear regression model of declining LD with increasing distance, both parameters a and b in Equation (3) were significantly different from zero. The mean estimate and 95% confidence interval by meta-analysis across autosome (parameters combining) for a was 2.83 [2.71; 2.96] and for b was 92.27 [79.46; 105.07], respectively. Next, we applied the estimated parameters a and b per chromosome using Equation (2) (Figure 3). Parameter b exhibited wider inter-chromosomal variability, compared with parameter a. Specific relationships were not observed between each estimated parameter (a, b) and chromosome length (cM). We have addressed this relationship and our interpretation of parameter b in this non-linear regression model as an estimated Ne in the discussion. After estimating parameters a and b, we provided evidence to demonstrate the appropriateness of our Ne estimation method. We estimated the predicted r2 per SNP pair distance using our estimated parameters a and b in Equation (2), and compared the predicted r2 values with those observed in other studies [24,25]. We observed that the r2 values predicted using the non-linear regression equation were similar to the mean observed r2 (Figure 4), suggesting that our parameters estimated using Equation (2) could explain the current situation and history of the Korean Landrace population.
Estimation of the ancestral Ne
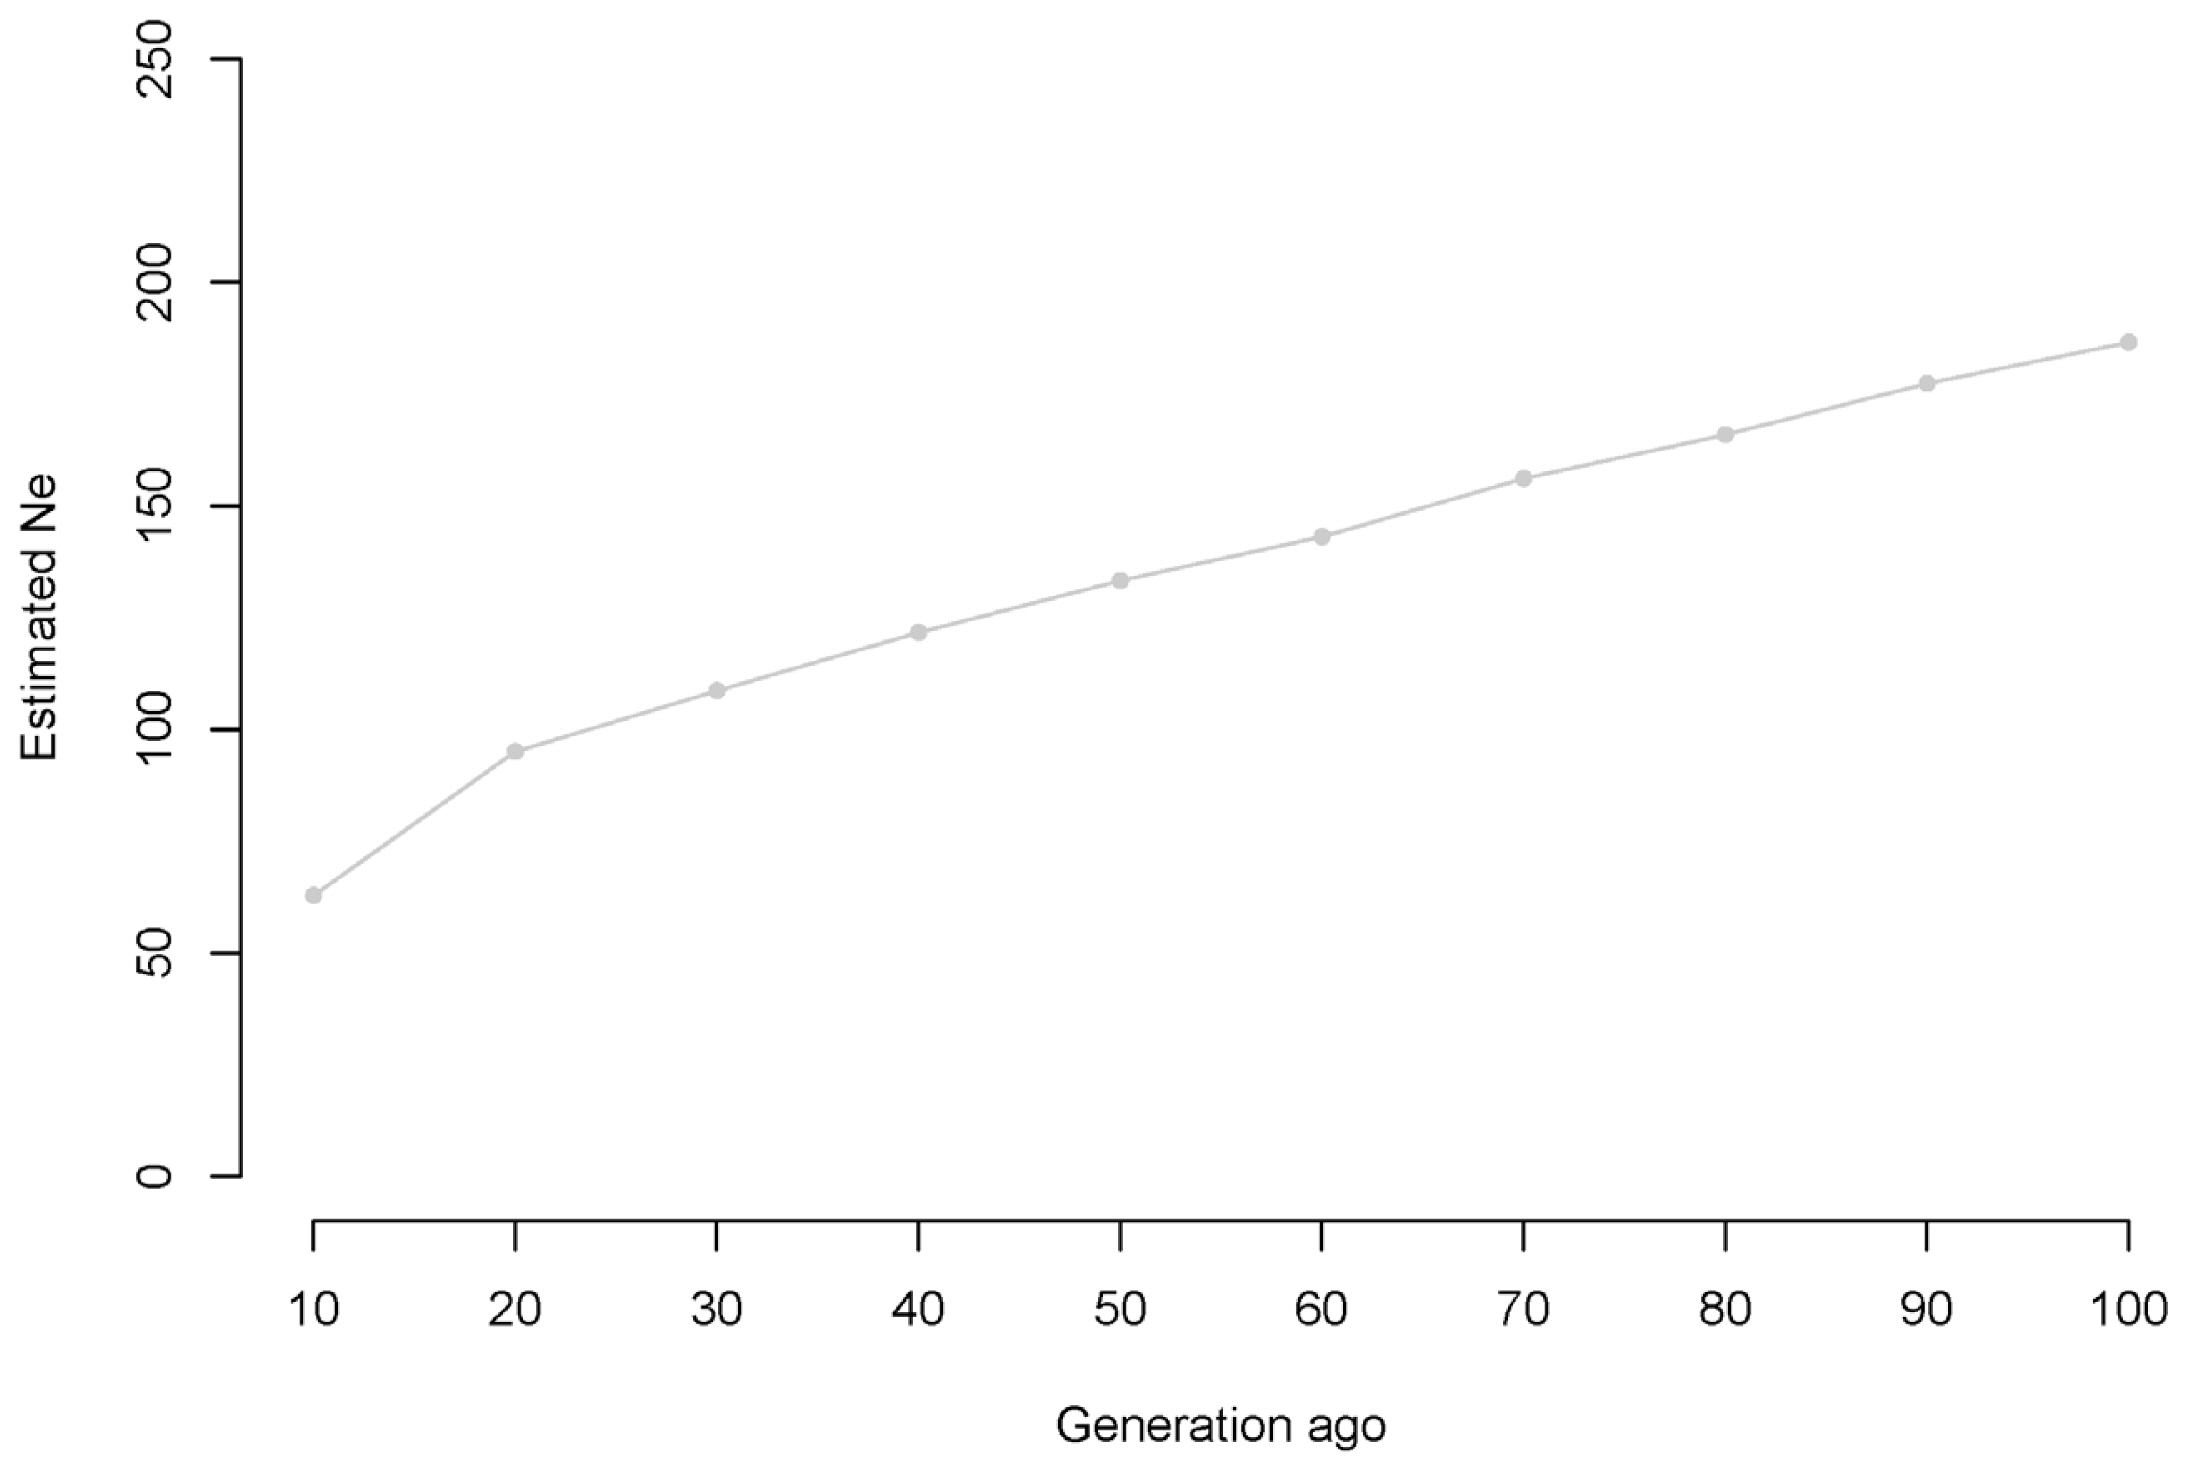
Supplementary Figure 1 and 5 present the estimated Ne at t generations ago. Based on the genomic data, the current effective Korean Landrace population size is approximately 92.27 [79.46; 105.07] individuals. Supplementary Figure S1 shows a continuous but slow reduction in the Ne of Korean Landrace populations from 186.61 to 92.27 over the previous 100 generations. Additionally, we observed a more rapid effective decrease in population size from the previous 20 to 10 generations ago than during other time intervals. We also observed that the Ne of the Korean Yorkshire population decreased over time by 99.6% during the past 10,000 generations (22,974.59 individuals) (Figure 5).
DISCUSSION
In this study, we used whole genome SNP data to investigate the extent of LD, as well as the current and previous Ne of the Korean Landrace population. Here, the observed LD (r2) extended for long distances when the adjacent 100 SNPs of each SNP in the genome were used. Although a previous study used both mass pedigree and small genomic data [20], we used large-scale genomic data from GGP farms to characterize LD and estimate Ne with the aim of obtaining an unbiased picture of LD in the Korean Landrace population. Because domesticated pig breeds such as Landrace were strongly and artificially selected for a long period of time, the observed LD is higher at short distances and more extensive than that observed in human populations. The pattern of LD decline in the Korean Landrace population was consistent with those reported by previous studies of domesticated pig breeds [20,28] and other domesticated animals [24,25].
We estimated the Ne of Korean Landrace population using a formula published by Sved [5], in which a non-linear regression model was used to describe the relationship between genetic distance and LD. However, this method of estimating Ne is associated with difficulties when addressing values within the limits of the parameter space (i.e., if r2 = 0.0, estimated Ne is infinite and if r2 = 1.0, estimated Ne is zero). Uimari [22] noted this limitation of the method devised by Sved [5]. In this study, we calculated r2 between one SNP with its adjacent 100 SNPs to reduce bias of r2 estimation. If we used r2 between one SNP with its adjacent few SNPs in this estimation, we could not take enough information about relationship between r2 and distance because two SNPs interval could be short or long. So we used adjacent 100 SNPs per SNPs in r2 eatimation and this was why the results could yielded accurate Ne. Another concern associated with the relationship between the estimated LD and the distance between SNPs involves the accuracy of the porcine reference genome (Build 9) used in this study. In future studies, updates to the porcine reference genome will refine the order and distances between SNPs on the commercial Illumina PorcineSNP60 version2 BeadChip. However, we considered that bias resulting from incorrect ordering of or distances between SNPs would be diluted by the large number of SNP pairs used in this study; therefore, slight overestimation and/or underestimation of LD would not be an issue. Moreover, the relationships between genetic and physical distances are known to vary across chromosomes and chromosomal regions. Therefore, we inferred the cM/Mb ratio per chromosome using position data from a physical map of the porcine reference genome and a genetic map generated using the USDA pedigree (derived from a population composed of ┬╝ Duroc, ┬╝ Large White, ┬╝ maternal Landrace, and ┬╝ high growth Landrace) in a previous study [26]. We further used genetic distances based on physical distances to estimate Ne. Accordingly, we were able to estimate Ne more reliably from these detailed estimates of genetic distances between SNPs, compared with other studies [24, 25]. Finally, another study reported that a limited sample size could bias the estimates of r2 and recommended correcting these estimates for a sample size n (r2 ŌĆō 1/2n) before using the Sved [5] equation. However, given our large sample size, we did not need to correct the r2 estimates or use corrected r2 values. When estimating the Korean Landrace population Ne, we used an alternative version of the Sved [5] equation derived by Tenesa [26], which incorporated a new parameter a (equal to 2) to account for mutations. Using this formula [26], the initial value of parameter a was 2 when parameters were estimated using the non-linear regression model of R. As a result, the estimated parameter a per chromosome ranged from 2.45 to 3.35 (Figure 3), and the estimated parameter b per chromosome ranged from 39.12 to 139.77. Regarding heterogeneity in the variance of the observed r2 per chromosome that declined as the distances between SNPs increased (Supplementary Figure S2), this might have affected our estimation of parameter b in Equation (2). In one study, a significant negative relationship was observed between the chromosome length and parameter b estimates from the non-linear model [24], whereas other studies of domestic livestock species reported a positive relationship [29] and still others did not investigate either type of relationship [25]. We therefore considered that the relationship between the chromosomal length and the estimated parameter b differed for each population, as did the evolution histories of each species and breed. In this study, all marker pairs were calculated only in each bin so that r2 would not be affected by the chromosome length. These results were consistent with the Yorkshire LD characterization results reported by Uimari [22] and the Korean Yorkshire Ne study (in review) [14]. Furthermore, we did not observe a relationship between the chromosome length and the estimated b values.
Our estimated b value represents an estimated Ne with an assumed constant present population size because we used genetic data of a Korean Landrace population that comprised candidate replacement breeder pigs from each major GGP or GP farms during the period of 2015 through 2016. When calculating Ne, parameter b in Equation (2) represents a conceptual average Ne over the period inferred from the range of SNP pair distances per chromosome [30]; we regarded the combined parameter b from a meta-analysis as the current Ne of the Korean Landrace population. Therefore, we inferred that the current Ne (┬▒SD) of the Korean Landrace population is approximately 92.27 [79.46; 105.07]. This Ne was less than the effective Korean Yorkshire population size (122.87, [106.90; 138.84]) (in review). Because Landrace and Yorkshire are both major maternal breeds in the Korean pig industry, this difference in Ne values was interesting. In Korea, genetic diversity within each breed population is affected by two main factors: the breeding pig selection system used at GGP farms and the addition of breeding pigs imported from other countries. First, we thought that the genetic diversity in the Landrace population might have been less than that in the Yorkshire population because a higher number of Yorkshire individuals had been included in pig trait tests at GGP or GP farms (Supplementary Figure S5). Second, relative to the Yorkshire population, fewer Landrace individuals were imported during the past 20 years (Supplementary Figure S6). The Ne of the Korean Landrace population might have been less than that of the Yorkshire population because of the importance of imported individuals with regard to increased genetic diversity.
As shown in Supplementary Table S3, LD over short distances reflects the Ne of many generations ago, whereas LD over long distances reflects the recent population history [6,7]. Supplementary Figures S1 and S6 show that the historical Ne assumed a linear population in accordance with Hayes [7]. The most interesting aspect of Supplementary Figure S1 was the rapid decrease in Ne from 20 to 10 generations ago. This pattern was also observed in estimations of historical Ne in the Korean Yorkshire population (in review). We presume that an important event must have affected multiple pig populations, including Landrace and Yorkshire. The most likely event was an outbreak of contagious disease, such as foot-and-mouth disease (FMD). We note that the Republic of Korea had been free of FMD between 1934 and a recent outbreak in 2000. Since this outbreak, however, Korea has not remained free from FMD, and during outbreaks, huge numbers of living domestic animals, including pigs and cattle, were buried to prevent the spread of disease. We considered that repeating cycles of contagious disease spread and recovery might have affected population sizes of the main pig breeds. As shown in Supplementary Figure S1, the observed pattern exhibited a steady decrease in Ne from 100 generations ago to the current population. Furthermore, the Ne of Korean Landrace population had decreased by 99.6% from 10,000 generations ago to the present in this study as Yorkshire population. Several factors could explain this pattern, including bottlenecks associated with domestication, selection, and breed administration. Therefore, it would useful to consider our results in the context of the demographic history of the Korean Landrace population. The reliability of this method, however, depends on both the technical implementation and data from previous studies [24,25].
This study aimed to characterize LD and estimate the effective size of the Korean Landrace population, using genomic data from thousands of individuals. In agreement with previous studies, the observed LD pattern of our own study of the Korean Landrace population was similar to the average value presented by Du [28] for Landrace, the findings of a 2001 study of Finnish Landrace pig breeds by Uimari [20,28]. However, the overall LD in the Finnish Landrace population appeared to be slightly stronger than that in the Korean Landrace population. We thought that because Korea Landrace populations included breeding pigs imported from several countries, the genetic diversity of Korean population was larger than the single Finnish breed population.
Although the UN Food and Agriculture Organization (FAO [4]) recommends a minimum of 50 breeding animals, Meuwissen [31] considered this recommendation to be the lower limit for a critical population size, and proposed that the actual critical size should be range between 50 and 100. However, the current Ne of the Korean Landrace population is 92.27, which is not sufficient to maintain genetic diversity. Therefore, we suggest that the Korean Landrace population contains insufficient genetic variation and has an acceptable rate of inbreeding, including compromising genetic gains in commercially important traits. The importance of the Landrace breed to the Korean pig industry suggests that this population requires a higher level of genetic diversity. Sufficient genetic diversity is also needed when applying selection methods that maximize selection responses at a fixed inbreeding rate [31] or methods that optimize the use of genetic resources from the parental generation .
Currently, the Ne of the Korean Landrace population would remain very small or continue to decrease if we were to apply an effective new method for estimating breeding values (e.g., genomic selection) [17]. Therefore, we must emphasize breed management and the avoidance of inbreeding, using measurements of genetic diversity. Although this might affect short-term genetic gains, it is essential for maintaining the long-term genetic variability of the Korean Landrace population. Continuous monitoring and long-term efforts to maintain genetic diversity are also needed to control the pig population and avoid an unintended reduction of the Ne. The maintenance of a sufficient Ne within a production population is the best way to maintain a sustainable pig population. Therefore, efficient monitoring and management, as described in this report, are essential.
CONCLUSION
In this study, we used SNP genotype data to characterize LD and infer the current and ancestral Ne values for the Korean Landrace population, using individuals from three major GGP farms. In this studied population, LD extended for long distances and reached baseline levels after thousands of kbs. The decay in LD over increasing genetic distances led us to estimate a current Ne of 92.27 [79.46; 105.07] and to observe a 99.6% decrease in Ne during the past 10,000 generations ago (Ne: 22974.59 individuals).

 PDF Links
 PubReader
 ePub Link
 Full text via DOI
 Full text via PMC
 Download Citation
 Supplement
 Print
Print


