INTRODUCTION
Pigs are an important economic animal and their growth rate is one of the main concerns of farmers, companies and scientists. Growth rate is known to be affected by the interaction of genetic and environmental factors in many animals including pigs (Hazel et al., 1943; Martorell et al., 1977; Bourdon and Brinks, 1982). In order to identify the genetic factors that underlie growth rate in pigs, many genome-wide association studies have been conducted. A number of different genes, variants and genetic regions were reported to have important effects on the growth rate (Lo et al., 1992; Mrode and Kennedy, 1993; Andersson et al., 1994; Estelle et al., 2008; Rubin et al., 2012).
While the genetic information based on the genome sequence can provide some insights, it has not been able to fully explain into the correlation between genome sequences and phenotypic traits. In light of this problem, epigenetic studies such as the ENCODE (encyclopedia of DNA element) project (The ENCODE Project Consortium, 2004; The ENCODE Project Consortium, 2011) have received attention because many phenotypic traits including growth rate could be influenced by epigenetic factors such as DNA methylation. Previous studies have shown that DNA methylation can affect gene regulation, phenotypic trait, genomic imprinting, and disease development (Li et al., 1993; Siegfried et al., 1999; Bird, 2002; Dolinoy, 2008). In spite of the importance of DNA methylation, only a small number of studies have been conducted to identify genome-wide methylation profiles of economic animals (Li et al., 2011; Walker, 2012; Hu et al., 2013; Su et al., 2014). In particular, there has yet to be a study on genome-wide methylation and its relationship to economic traits such as growth rate in pigs.
In this study, we conducted methyl-CpG binding domain protein-enriched genome sequencing (MBD-seq) and bioinformatics analysis to assay the genome-wide DNA methylation pattern in the small intestine and liver samples of 21 day old weaning piglets with different growth rates. These two organs are important for digestion and absorption of nutrients. Besides, these organs undergo morphological changes and functional maturation during the postnatal period (Xu, 1996). For example, profound growth of organ tissue and the epithelial modification including the loss of ability of absorbing macromolecules occur in small intestine. The gene expression in liver is involved in metabolizing nutrients and generating growth factors like (Insulin-like growth factor 1 (IGF-1). By comparing the genome-wide methylation pattern of two groups exhibiting different growth performances, we identified differentially methylated regions (DMRs) and genes related with these regions. Pathway and network analysis of these differentially methylated genes identified a number of candidate genes which may affect growth performance in pigs. This is the first study for the genome-wide DNA methylation distribution of weaning piglets using next generation sequencing and the results of this study may contribute to the improvement of epigenetic understanding of growth rate in pigs.
MATERIAL AND METHODS
Animals
Samples used in this study were a multicross hybrid breed of Yorkshire, Landrace, and Duroc. From three sows, the pigs with the highest and lowest average daily gain were selected 21 days after birth totaling six pigs. The average weight of the fast growing and slow growing pigs were 8.15 kg and 5.53 kg respectively. Liver and small intestine tissues were sampled from each pig for sequencing.
Sequencing
Before a genomic DNA library construction, methylated DNA fragments were captured using the Methycap kit (Diagenode, Denville, NJ, USA). TruSeqTM DNA Sample Preparation Kit (Illumina, San Diego, CA, USA) was used following the manufacturerŌĆÖs protocol. To generate raw data for each sample library, 51 cycle single-end sequencing using Hiseq 2000 was carried out. To obtain enough read for analysis, three samples were multiplexed within one lane of Hiseq 2000 sequencing lanes.
Bioinformatics analysis
FastQC (Andrews, 2010) was used to check the quality of the raw reads. Read bases with unnecessary sequences (adaptor, index, primer sequence of illumina platform) or low quality scores (under Q20 of phred scale) were filtered using Trimmomatic (Bolger et al., 2014). Filtered read were aligned to the pig reference genome (Sus scrofa 10.2, susScr3) using Bowtie2 (Langmead and Salzberg, 2012) with the default option parameters. Removal of duplicated read from polymerase chain reaction and alignment information sorting were conducted using Picard tools (http://picard.sourceforge.net) and Samtools (Li et al., 2009). To identify the DMR, methylated DNA immunoprecipitation sequencing data analysis (MEDIPS) (Chavez et al., 2013) and BSgenome (Pages, 2009) libraries of pig were used. The parameter setting of MEDIPS is as follows: uniq = TRUE, extend = 300, shift = 0, window size = 100. EdgeR method was used to identify DMR regions and false discovery rate (FDR) was used for multiple test correction. Regions shown to be significant (FDR<0.05) were used for downstream analysis. After identifying genomic windows that showed significant differential coverage between conditions, neighboring significant windows were merged into a large continuous region. The DMR regions were annotated using Peak analyzer v1.4 (Salmon-Divon et al., 2010) with three options: overlap, nearest downstream gene, and nearest transcription starting site). To calculate the proportion of uniquely mapped bases, various information (CpGs, repeats, genes) was downloaded from University of California, Santa Cruz (UCSC) table browser (Meyer et al., 2013). Canonical pathway and network analyses were conducted using Ingenuity Pathway Analysis (http://www.ingenuity.com, FisherŌĆÖs exact test p<0.05).
RESULTS
Genome-wide methylation profile and differentially methylated regions
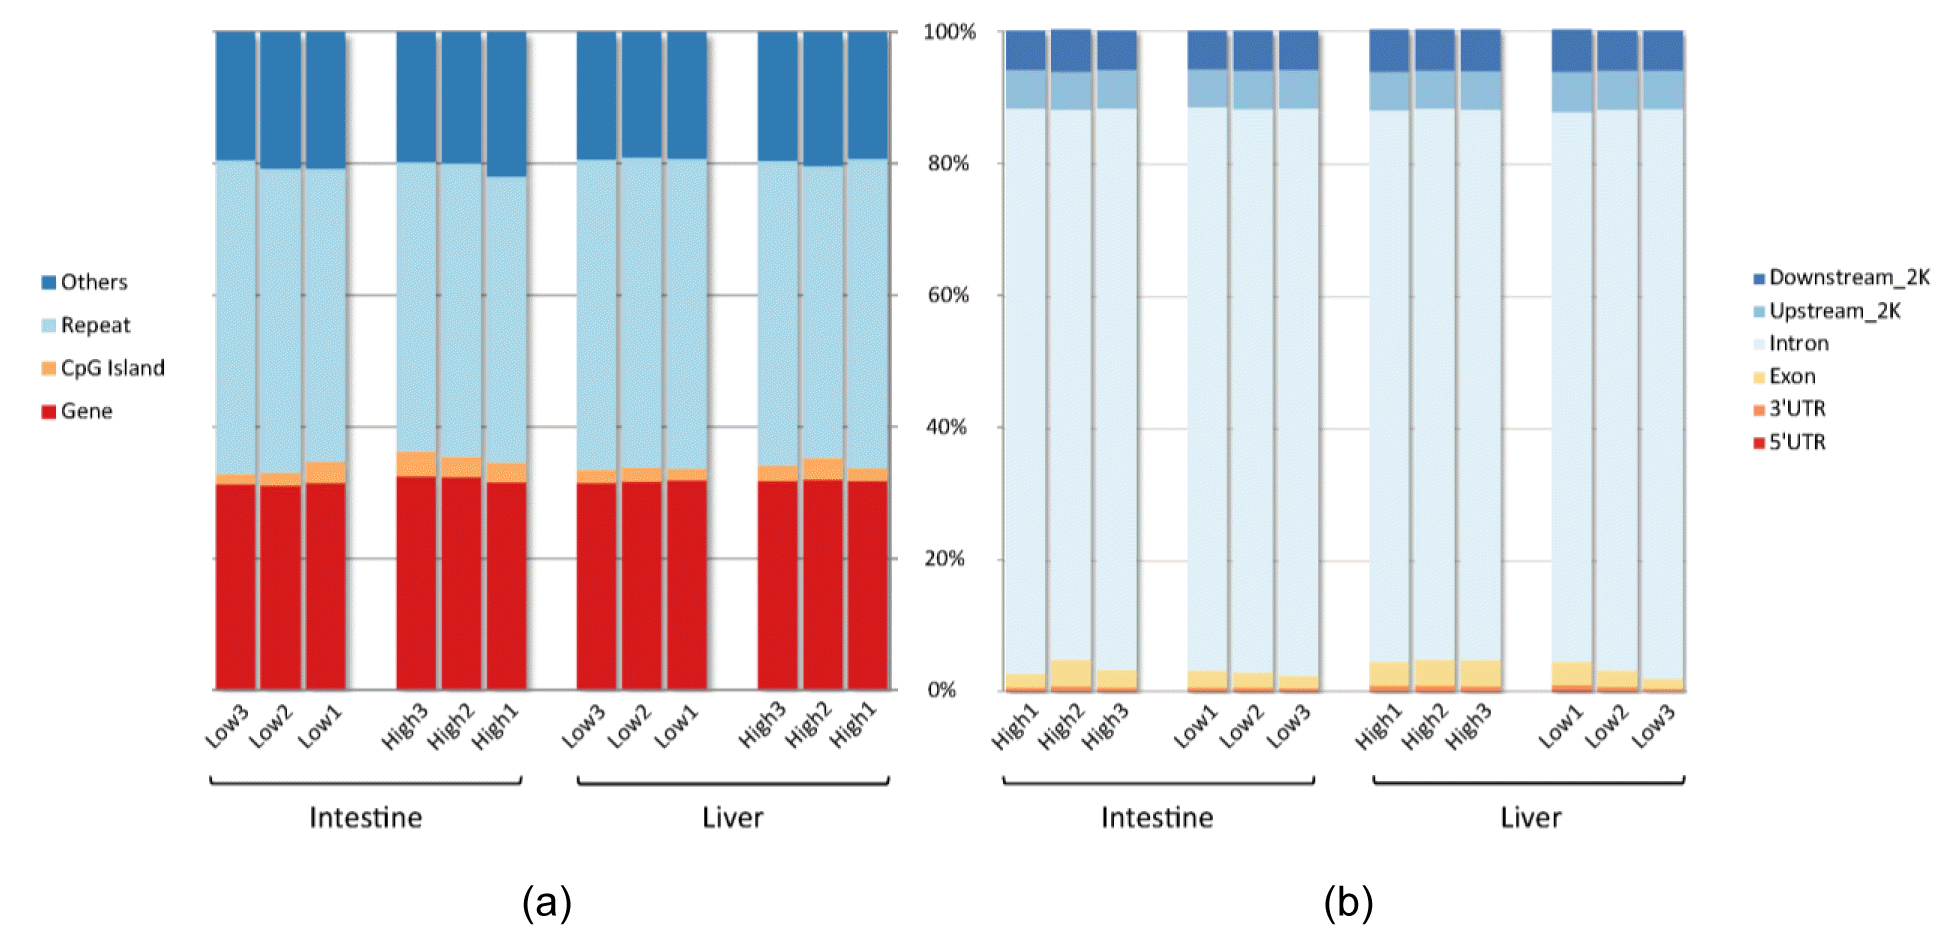
Produced and trimmed raw read data information from liver and small intestine samples of six pigs is described in Supplementary Table 1. The average alignment rate of the 12 samples was 71.28%, and on average 36.08% of reads was uniquely mapped to the reference genome. The details of the mapping rate of 12 samples are described in Table 1. The PearsonŌĆÖs correlation values of all samples were close to one in a saturation analysis using MEDIPs and the read coverage was enough to conduct downstream analysis. The saturation plots of the 12 samples are shown in Supplementary Figure 1. Supplementary Figure 2 shows the proportion of covered CpG region using pie chart. The covered CpG pattern for samples of the same organ showed similar patterns between high and low average daily gain groups. The sequence pattern coverage histogram (Supplementary Figure 3) also showed similar shape between the two groups. On average, 0.27% of mapped reads did not cover any CpG region. Also, average enrichment score was 4.515 in the small intestine samples and 4.296 in the liver samples. This shows that MBD-seq used in this study properly captured the methylated DNA. Supplementary Table 2 shows the details of the enrichment score for each sample. The pairwise correlation plots of the genome wide coverage profiles between all samples used in this study were summarized in Supplementary Figure 4. Same as the CpG coverage pattern, there was no distinct difference between high and low average daily gain groups. Uniquely mapped based were categorized by regions of the genome (gene, CpGs, repeats and others) and regions of the gene (exon, intron, 5ŌĆ▓-untranslated region [UTR], 3ŌĆ▓-UTR, upstream-2k and downstream-2K). Figure 1 shows the proportion of uniquely mapped bases for each sample. Most of the bases were located in repeat regions (45.74%) and gene regions (31.77%). On average CpG island regions (2.54%) made up a smaller proportion in comparison to other regions. Within the gene region, the average proportion of intron region was 84.50%. Upstream_2K region and downstream_2K region of genes were 5.92% and 6.10%, respectively. The sum proportion of Exon and UTR region was 3.76% on average. Same as the coverage of CpGs using pie chart and histogram, there was no distinct difference in the proportion of genome-wide methylation profile based on the genomic regions between two groups. After binomial test using MEDIPs, the number of identified and merged DMR in high average daily gain group was 30 (5 down, 25 up) in the small intestine tissue and 258 (3 down, 255 up) in the liver tissue compared to the low average daily gain group.
Differentially methylated region annotation and pathway, network analysis
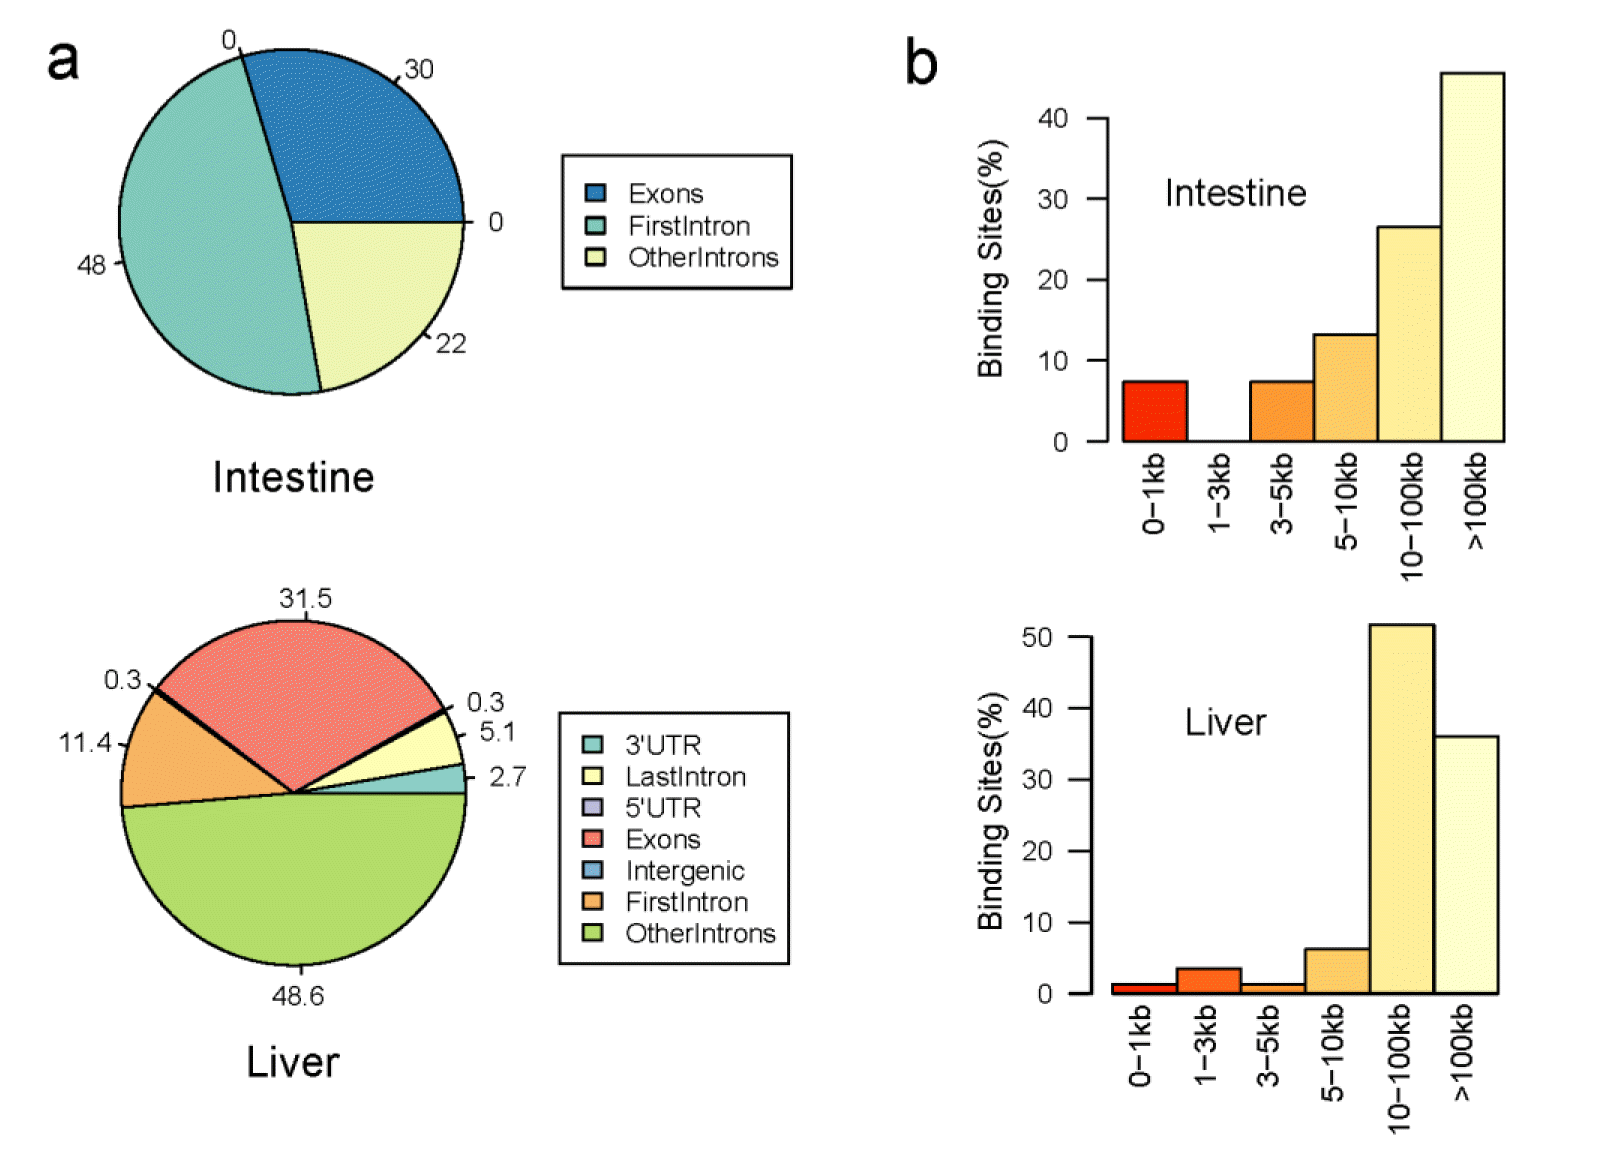
Annotation results of DMR using peak analyzer with the Ensembl genome information is shown in (Figure 2). In the small intestine, 30% of DMR was located in exon region and 70% of DMR was located in intron region. In liver, 3%, 31.5%, and 64.5% of DMR were located in UTR, exon and intron region, respectively. Distribution of the distances to the nearest downstream gene from DMR showed that most of DMRs were more than 5 kb from the downstream genes. The list of genes that overlapped with DMRs, which were used in pathway and network analysis, is summarized in Table 2 and the full differentially methylated genes are listed in supplementary Table 3. Genes of nearest downstream gene and nearest transcription starting site are described in the supplementary Table 4.
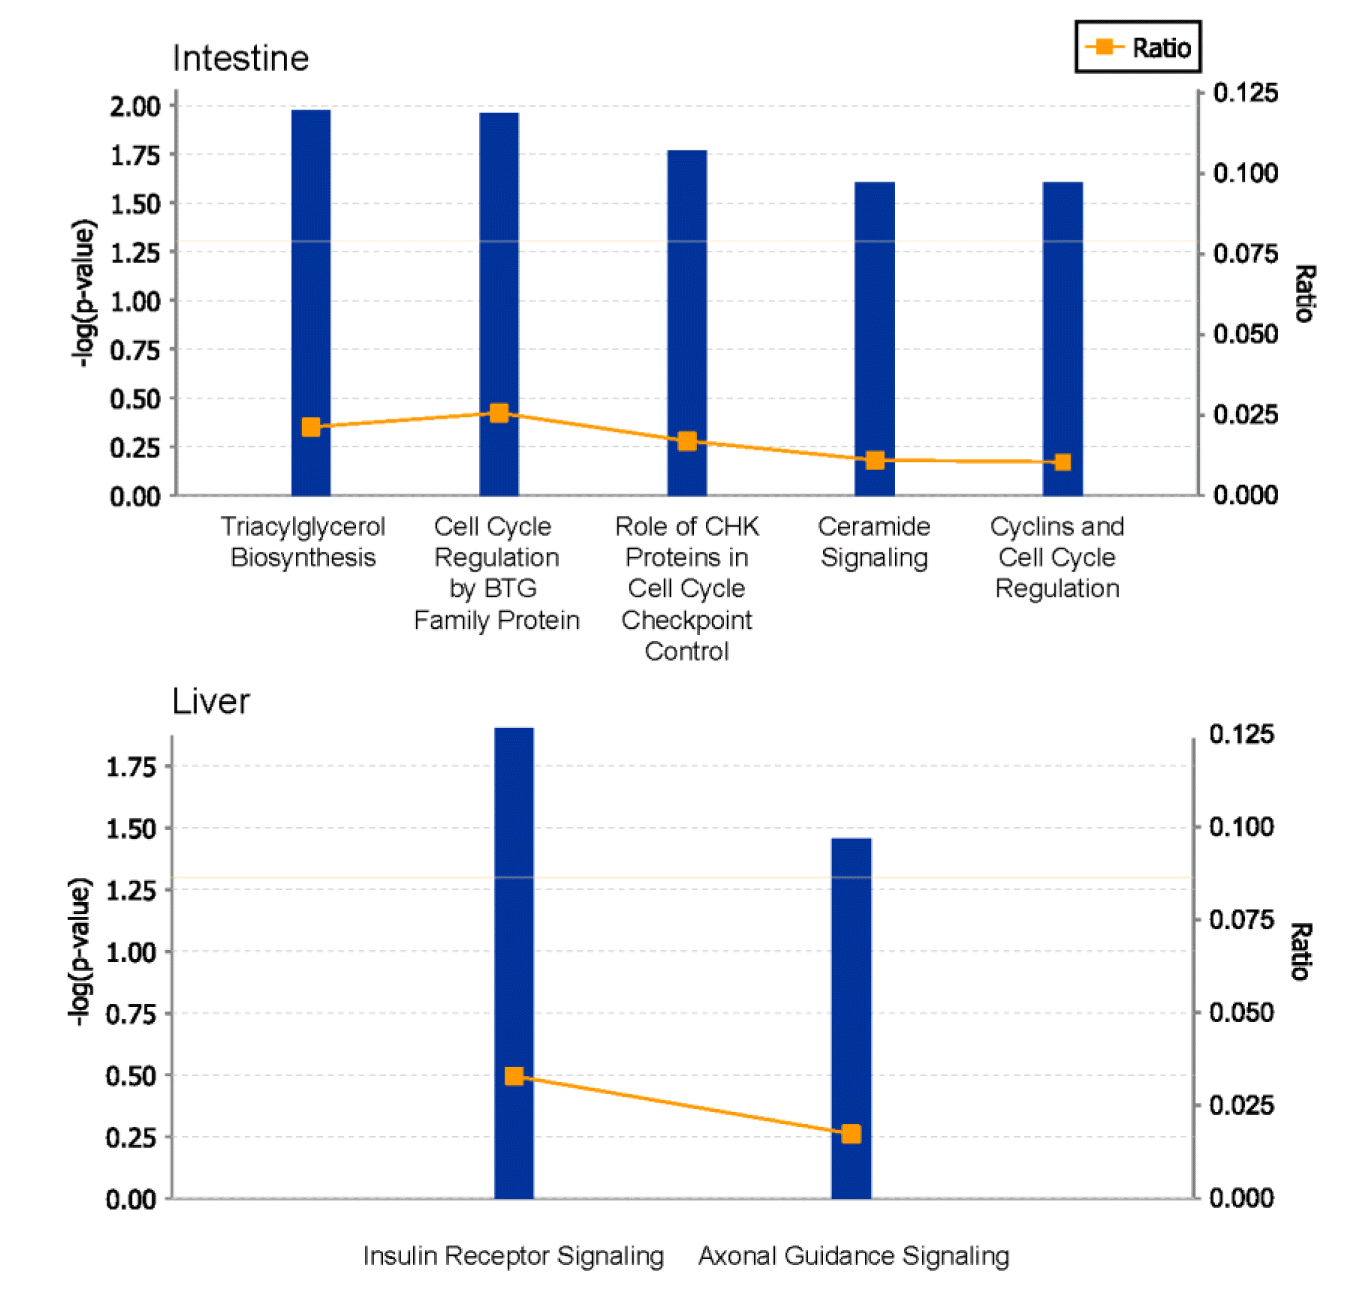
Figure 3 shows the enrichment canonical pathway related to growth and cell cycle using ingenuity pathway analysis in the small intestine and liver tissues. The first enriched canonical pathway of small intestine was the triacylglycerol biosynthesis pathway. And there were four enriched pathways related with cell cycle and cell growth (cell cycle regulation by B-cell translocation gene family protein, role of checkpoint kinase proteins in cell cycle checkpoint control, cyclins and cell cycle regulation, ceramide signaling). Phosphatidic acid phosphatase type 2A (PPAP2A), E2F6, and S1Pr2 genes were related to the enriched pathway. In liver, insulin receptor signaling and axonal guidance signaling pathway were enriched. RAPGEF1, TSC2, INPPL1, BAIAP2, PLXNA2, CHMP1A, and RTN4R were related to the two pathway enriched in liver.
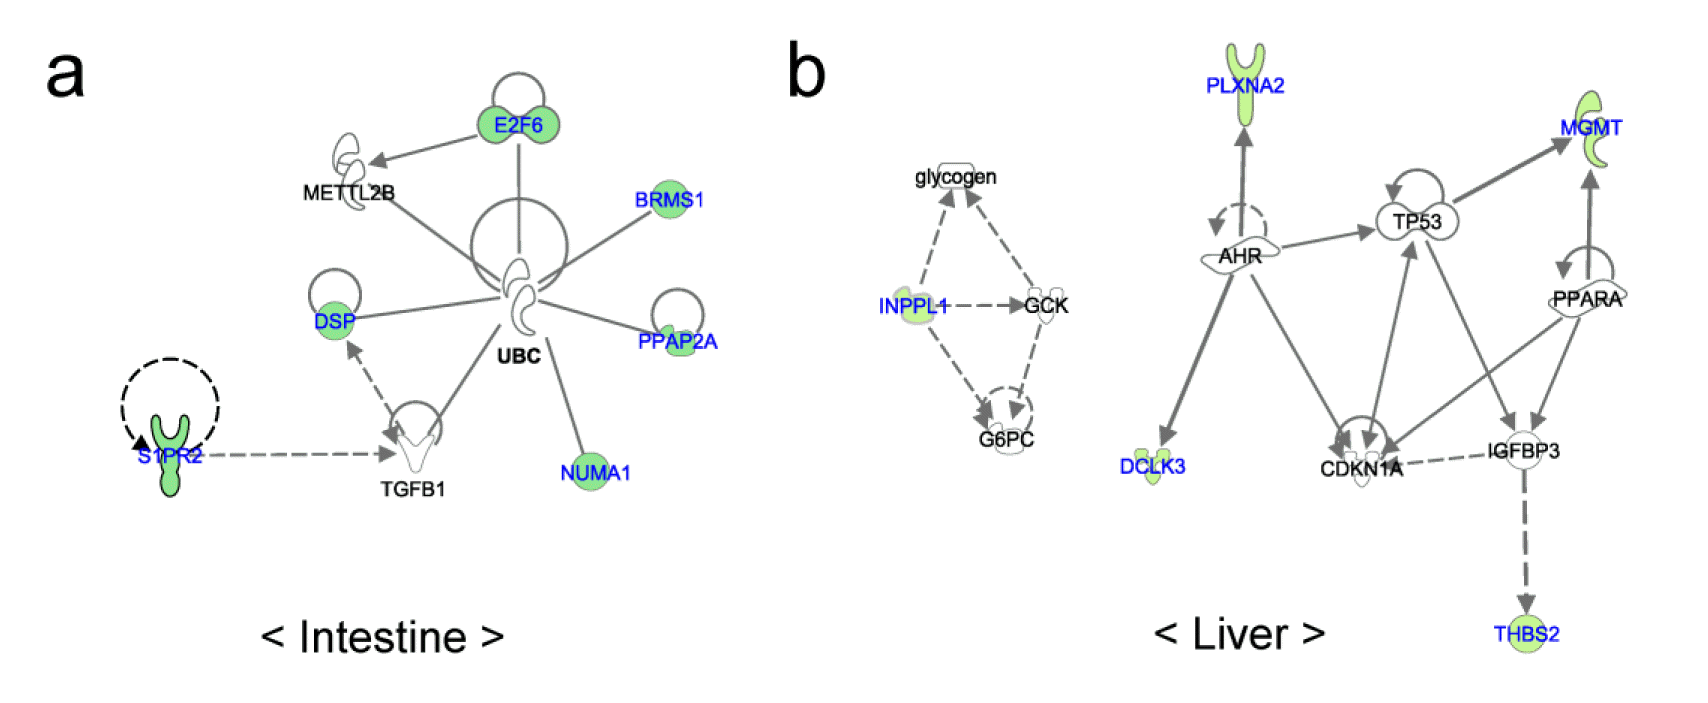
Figure 4 shows the networks of genes overlapped with DMR in the two organs. In the small intestine, all genes (BRMS1, DSP, E2F6, NUMA1, and PPAP2A) except S1PR2 were directly connected with ubiquitin C to form a network concerned with cancer, cell to cell signaling and interaction and cellular growth and proliferation. Seven genes (DCLK3, MGMT, PLXNA2, THBS2, TSPAN4, ILPPL1, and TSC2) overlapping with DMR regions the liver were associated with four networks. Among these networks, two networks were related to cellular growth and carbohydrate metabolism.
DISCUSSION
Methylation profiles in small intestine and liver
This is the first study to compare the genome-wide methylation profile of two organ tissues (small intestine and liver) between two groups of weaning period piglets, which show differential performance in growth. Small intestine and liver are important organs for piglets that absorb and metabolize the nutrition in breast milk. As it is well known that DNA methylation of promoter region and gene body region can affect the gene expression via chromatin structure changes or transcription efficiency (Lorincz et al., 2004; Klose and Bird, 2006; Suzuki and Bird, 2008), the object of this study was to compare the genome-wide methylation pattern and identify methylated genes that could affect the growth rate of piglets. Bases of uniquely mapped reads in our study were enriched in the repeat and gene regions and this was similar to the results of a previous study on chickens (Li et al., 2011; Hu et al., 2013). However, the intron region comprised a large proportion of methylated genes (>80%) compared to the other analysis. There was no big difference in the DNA methylation pattern (CpGs coverage and genomic regions) between two groups using enriched read location. A small number of differentially methylated genes were identified in the small intestine sample and a higher number of genes were methylated in the liver compared to the small intestine. The small intestine sampled showed no DMR located in UTR and only a small proportion of DMR of the liver were located in UTR. The distances of DMRs from the nearest downstream genes and transcription starting site under 1 kb was a small proportion of the overall distribution. This showed that the different epigenetical regulation between two groups may come from chromatin structure change, not from repress regulation in promoter regions.
Potential genes and pathways related to the piglet growth rate
Small intestine is the most important organ for pigletŌĆÖs absorption of nutrients. The breast milk which provide nutrients for the piglets has a high fat content. This fat in the breast milk is broken down by lipase and bile into monoacylgylcerol and free fatty acid. In these forms, it is absorbed into enterocytes, which is then rebuilt into tryacylglcerol and secreted as chylomicron before being used by the body. Enriched pathways and related genes in the small intestine were closely related to cell cycle regulation and lipid metabolism. Sphingosine-1-phosphate receptor 2 (S1PR2) is a member of G protein-coupled receptor, and it is related to the sphingosine-1-phosphate-induced cell proliferation (An et al., 2000; Adada et al., 2013). E2F transcription factor 6 (E2F6) is a member of transcription factors that play a crucial role in the cell cycle control (Trimarchi et al., 2001). The protein of nuclear mitotic apparatus protein 1 (NUMA1) gene interacts with microtubules and organizes the mitotic spindle during cell division (Purohit et al., 1999). These genes are thought to be associated with the formation of villi of newborn, and villi play an important role in absorption of nutrients by expanding the surface of small intestine. PPAP2A is an integral membrane glycoprotein that conducts hydrolysis and uptake of lipids from extracellular space (Roberts et al., 1998). Therefore, these differentially methylated genes and related pathways are associated with digestion and absorption of breast milk of which a major nutrient is fat. This different nutrient absorption is thus thought to be related with the different growth rate of piglet before weaning.
Pathway analysis of the liver, which plays a key role in lipid and energy metabolism, showed that insulin receptor signaling and axonal guidance signaling pathway were enriched. Differentially methylated genes (INPPL1, PLXNA2, MGMT, DCLK3, and THBS2) formed networks such as carbohydrate metabolism, cellular growth and proliferation. Inositol polyphosphate phosphatase-like 1 (INPPL1) encodes an SH2-containing 5ŌĆ▓-inositol phosphatase that is associated with the regulation of insulin function, and the functions of the liver are primarily controlled by the hormone insulin (Saltiel and Kahn, 2001; Fritsche et al., 2008). Previous study using INPPL1 knockout mouse showed that the absence of INPPL1 confers the high resistance to the weight gain from high-fat diet (Sleeman et al., 2005). Hence, INPPL1 and enriched pathways related with the differentially methylated genes are thought to be closely related to the weight gain and growth rate of piglets.
Even though further study is required to identify the epigenetic effect of these genes, results of analysis of pathways and networks on growth rate of piglets may provide some clues to the epigenetic mechanism of piglet growth rate.


 PDF Links
 PubReader
 ePub Link
 Full text via DOI
 Full text via PMC
 Download Citation
 Print
Print


