


INTRODUCTION
It is known that cereals, including maize, vary considerably in composition with environment, growth region, agronomic inputs and variety. For example, a study in the USA in 1999 showed crude protein (CP) in maize across 16 states varied between 73.1 and 90.6 g/kg and total lysine between 2.5 and 3.0 g/kg (Cromwell et al., 1999). Similarly, D’Alphonso (2002) found that across 15 countries, total starch varied between 645.4 and 696.2 g/kg and the amylopectin content of that starch varied between 732.5 and 828.6 g/kg. Genetic lines can vary dramatically, and selection for response to nitrogen supply has produced maize with starch varying from 353 g/kg to 754 g/kg (Uribelarrea et al., 2004). Maize quality and composition has been shown to result in differences in nutritional value and performance when fed to broilers, however literature in this area often compares a genetically modified variant (and it’s relations) with a commercial strain. For example, Brake et al. (2003) compared four maize samples, three of similar genetic background and one entirely different commercial variant. The crude protein content of the commercial sample was 86.9 g/kg versus the mean of the others at 77.4 g/kg (as is). In terms of FCR, the commercial variant was significantly worse at all stages of growth, for male and female broilers. There was no clear reason why this should be. In a similar study with layers, Jacobs et al. (2008) found that there was no difference in feed efficiency between a commercial control and a genetically modified variant.
Processing can also influence apparent nutritive value of maize. Kaczmarek et al. (2007) showed with heat treatment, FCR was increased, driven by a decrease in BWG between d 1 and 35. A similar effect was reported by Iji et al. (2003).
Non-starch polysaccharide degrading enzymes (NSPases) are commonly used globally in non-ruminant diets to improve feed efficiency. They are particularly common in diets based on viscous cereals, but also in maize based diets where they have been shown to improve nutrient digestibility (Zanella et al., 1999; Cowieson and Ravindran, 2008, broilers) and FCR (Wyatt et al., 1997, broilers; Mathlouthi et al., 2003, layers) when used as part of a multi-enzyme cocktail. There is very little information on the use of xylanase alone in maize-based diets for any species. Cowieson et al. (2010) report that a 16,000 birchwood xylanase units (BXU)/kg dose of xylanase added to a maize-based negative control diet resulted in equivalent FCR to the positive control (PC, basal) and significantly better FCR than the negative control (basal less 110 kcal/kg) in broilers 0‚Äď21 d post hatch. Even a dose of 8,000 BXU/kg was significantly better than the negative control. Furthermore, between 0‚Äď42 d post hatch, both doses were significantly better than the negative control and equivalent to the positive control. However, Shakouri et al. (2008) found no differences in broiler performance measures following addition of a majority-xylanase product (6,000 fungal xylanase units/kg as fed), with some glucanase side-activity (2,500 birchwood glucanase units/kg), to maize-soy based diets between 0 and 42 d.
The aim of this study was to investigate the variation in performance and nutrient digestibility of broilers fed diets based on maize samples of one variant, harvested in five geographically diverse regions of China, with and without exogenous xylanase. Published literature on the area of corn quality and nutritional value often fails to give detailed in vitro analysis. This paper will also describe in vitro analysis and starch digestibility assay for these samples.
MATERIALS AND METHODS
Birds
The experiment was carried out at the experimental farm of the School of Animal Science, Henan University of Science and Technology, Luoyang, China. Seven hundred and twenty Arbor Acres broilers were sourced specifically for the experiment and housed in four tier caging system with 12 birds per cage and six cages per treatment. The birds were caged from hatch to 18 d with 50:50 males to females in each treatment. The cage floor space was 80√ó100 cm. Light was provided for 20 h/d with controlled ventilation and humidity at 75%. Temperature was controlled between 32‚Äď27¬įC, as per the breeder guidelines. Birds were vaccinated against Newcastle Disease and Infectious Bronchitis at 7 d of age. Between days 15 and 18, FI was measured on a per-pen basis and excreta was collected for AME determination. At d 18 of the study birds were killed by electrical stunning. A section of ileum was removed between the Meckel‚Äôs diverticulum and the ileo-caecal junction. A 50 ml syringe full of room-temperature deionised water was inserted into one end of the ileum to carefully flush out the digesta in the gut into a 10 cm diameter Petri-dish (Liu et al., 2007). The digesta from each replicate were pooled and for determination of IDE. Titanium dioxide as an indigestible marker was added at 0.5% to the diets at the beginning of feeding trial and was assayed for using the method of Short et al. (1996). Energy was determined using an Oxygen Bomb Calorimeter (Model 6300, PARR, Moline, IL). The values of AME and IDE will be displayed in kcal/kg and also adjusted for intake as apparent metabolisable energy intake (AMEI) and ileal digestible energy intake (IDEI) (calculated as AME√óIntake, kcal). Over the entire period (0‚Äď18 d) total FI and BWG (mean per bird per pen) were measured and FCR calculated as FI (kg)/BWG (kg).
Maize samples
Five maize samples of variety Zhengdan 958 were collected from five diverse regions in China in December 2010. The maize samples are described in Table 1. The environment varies considerably between the regions for each sample (World Meteorological Organisation, 2011), with mean total rainfall between May and September varying between 124 mm (Xiangiang) and 789 mm (Zhejiang). Average minimum/maximum temperatures in the same period also varies between 12.84/24.32¬įC (Heilongjiang) and 21.5/29.32¬įC (Zhejiang). These differences result in variation in the length of growing season and in those regions where temperatures persisted below zero into the spring, planting may have been delayed.
Diet
The diet was formulated as shown in Table 2, and was fed as one phase only from d 0‚Äď18. Test maize was used at one rate in all diets (608.3 g/kg). Food and water was provided ad libitum at all times. The diet was manufactured as a mash and titanium dioxide was added as an inert digestibility marker, at 5 g/kg, at the expense of whole diet.
The dietary treatment structure is shown in Table 3. Each of the five test maize was fed in two diets, one with xylanase inclusion and one without. This gave a total of 10 treatments. Where the xylanase was included, it was at a rate of 16,000 BXU/kg (100 g/tonne equivalent), at the expense of total diet. The xylanase is thermostable and expressed in Trichoderma reesei and provided by AB Vista Feed Ingredients (Marlborough, UK) as a powder.
Proximate and physio-chemical analysis
Proximate and physiochemical analyses (including PSI and vitreousness) were conducted using Near Infrared Reflectance spectroscopy which was carried out using a Foss 6500 NIR spectrophotometer (FOSS NIRSystems, Inc, Maryland, USA). The analyses were conducted at Aunir (Towcester, UK) and the calibrations were based on wet chemistry analyses of 1,000 corn samples as described by Piotrowski et al. (2011).
In vitro starch digestibility
All chemicals and reagents were purchased from Sigma Aldrich (Sigma Aldrich Inc., St. Louis, MO, USA) unless otherwise stated. All maize samples were milled to a standard size using a Perten 3,600 laboratory mill (Perten Instruments, Segeltorp, Sweden). A 200 mg sample was suspended in 10 ml sodium tetraborate buffer (50 mM, pH 9) and incubated in a water bath at 60¬įC. After equilibration (10 min at 60¬įC), 50 őľl protease (Bacillus sp. 16 U/g) was added and incubated for a further 30 min. The pH of the reaction mixture was then adjusted to 5.0¬Ī0.1 and 300 őľl őĪ-amylase (Aspergillus oryzae 800FAU) was then added and the product of hydrolysis (glucose) measured at each time point over 24 h using a GM9 glucose analyser (Analox Instruments Ltd, London, UK). The time points were 0, 5, 10, 20, 30, 40, 60, 90, 150, 210, 240 min and 24 h. The initial starch concentration is converted to a glucose equivalent. Using the Megazyme starch assay procedure (with DMSO pre-treatment-AOAC Official method 996.11), starch was defined as the amount of glucose after gelatinization and incubation of the cereal with őĪ-amylase and amyloglucosidase. The final digestibility is expressed as a total amount of glucose released relative to the initial glucose content of starch from the sample. All samples were analysed in duplicate.
Statistical analysis
All statistical analyses were carried out using JMP version 8 (SAS Institute Inc, North Carolina, USA).
Enzyme dose at 0 or 16,000 BXU/kg and 5 different maize sources were used in a 2√ó5 factorial ANOVA in 6 randomised complete blocks of initial bodyweight. A t-test was then used to separate the means and elucidate the direction of the differences. Significance was accepted at a probability equal to or less than 0.05. Where the probability value is greater than 0.1, ‚ÄėNS‚Äô will be displayed in place of the value. All measured parameters were entered into a multivariate analysis and the correlation coefficients and level of significance will be displayed. For in vitro starch digestibility, the coefficient, as measured at 30 and 150 min was regressed against performance parameters in this analysis.
RESULTS
Proximate and physio-chemical analysis
The results of the proximate and physio-chemical analysis are shown in Table 4. The samples varied in composition. The average contents of protein and starch, the PSI and vitreousness values were as follows, respectively, 81.8 g/kg; 748.1 g/kg; 41% and 61.6%. Maize grown in Xinjiang had less protein and more starch than the other samples and also had a PSI value of approximately 20% less overall than the others.
In vitro starch digestibility assay
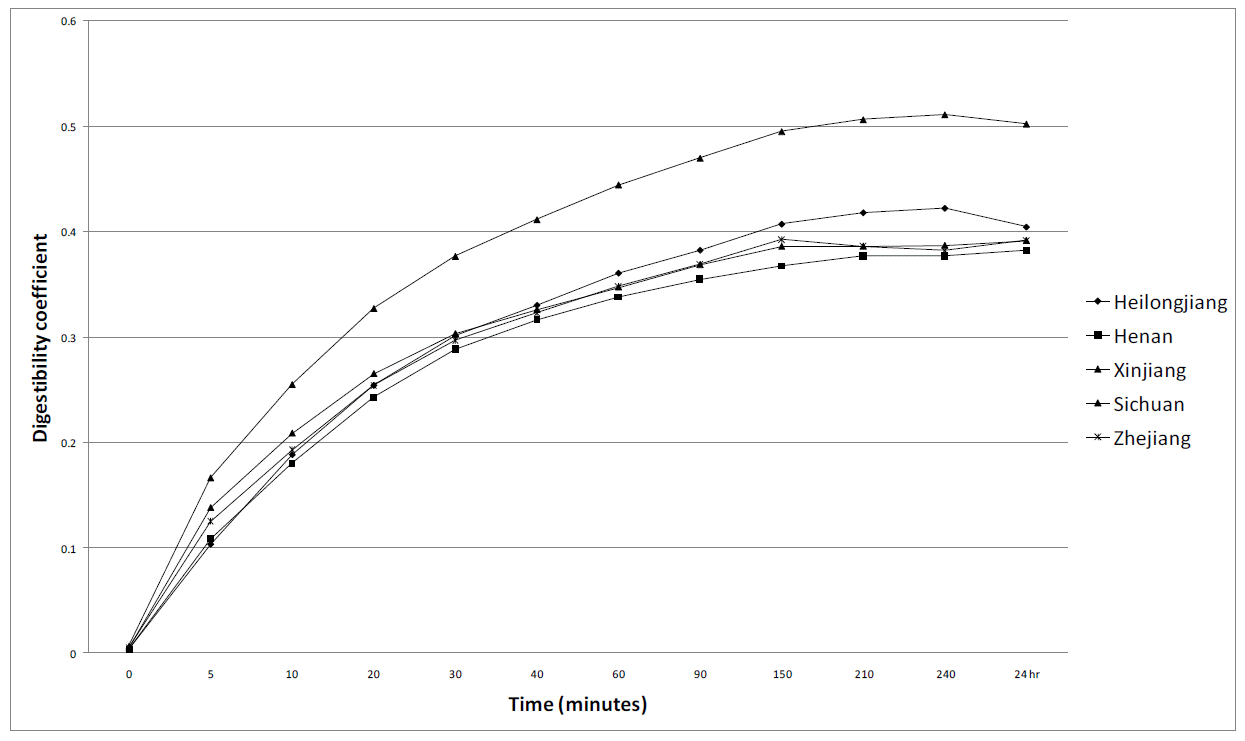
The results of the in vitro starch digestibility assay are shown in Figure 1. There appears to be little difference in in vitro digestibility of starch between the maize samples. The final digestibility coefficients after 24 h for Heilongjiang, Henan, Sichuan, Xinjiang and Zhejiang were 0.405, 0.382, 0.392, 0.503 and 0.392 respectively. The maize sample from Xinjiang had the lowest PSI value (Table 4) but also had the highest final starch digestibility coefficient (0.503).
Performance
The analysis of variance of the effect of maize source and xylanase dose on performance is shown in Table 5. There was no effect of maize source and no interaction between maize source and xylanase addition. There was a significant effect of xylanase dose on FCR, BWG and FI (p = 0.001; p<0.001 and p = 0.011 respectively). Adding xylanase to the control diet at a rate of 16,000 BXU/kg, significantly improved FCR by increasing FI to a lesser extent than BWG.
Ileal digestible energy and apparent metabolisable energy
The analysis of variance of the effect of maize source and xylanase dose on energy availability in the ileum and over the total tract is shown in Table 6. There was no interaction between maize source and xylanase addition suggesting effects due to xylanase use was independent of the corn source. There was a significant effect of xylanase dose on IDE, AME, IDEI and AMEI (p<0.0001 in all cases). Adding xylanase significantly increased all parameters. Although there was no significant effect of maize source, there was a strong trend in IDE (p = 0.066) and AME (p = 0.058), Heilongjiang tending to have higher values than Zhejiang.
Correlations
Table 7 shows the correlation matrix and significance for the relationship between all parameters. There were no significant correlations (p<0.05) between any proximate or physiochemical values and any performance or digestibility values. The two sets of analyses appeared to be unrelated. There were significant correlations (p<0.01) between all proximate and physio-chemical values. For example protein is negatively correlated to starch (r = ‚ąí0.949), fat (r = ‚ąí0.903), in vitro starch digestibility at 30 and 150 min (r = ‚ąí0.768; ‚ąí0.200) and positively correlated to fibre (r = 0.817), PSI (r = 0.956) and vitreousness (r = 0.752). There were significant relationships between performance and digestibility measurements. Body Weight Gain was the most highly correlated variable with all relationships with other performance and digestibility variables being highly significant (p<0.01). For example, BWG was negatively correlated to FCR (r = ‚ąí0.802) and positively correlated to IDE (r = 0.446), AME (r = 0.378), IDEI (r = 0.607) and AMEI (r = 0.575).
DISCUSSION
The proximate analysis of the samples is comparable to that seen in the literature. Crude protein content is in the middle of the range reported by Cromwell et al. (1999) for a selection of US grown maize. Zhao et al. (2008) report the composition of a selection of Chinese varieties and the range of CP contents is 81.0‚Äď102.0 g/kg. The mean value reported in the current paper (81.8 g/kg) is towards the lower end of this range but is more comparable to the value reported by Zhao et al. (2008) for the same maize variant (86.0 g/kg). The mean fat content in the current study was also comparable to Zhao et al. (2008) but crude fibre content was considerable lower. This may have been due to analytical method differences. Unfortunately, Zhao et al. (2008) do not report starch content. Cowieson (2010) reported mean starch content of a global selection of 650 maize samples to be 755 g/kg, which is comparable to the current study. Similarly, the PSI and vitreousness values reported by Cowieson (2010) are comparable to the current study (42.4% and 63.5% respectively).
The correlations between various components were also as expected. Crude protein content was negatively correlated to starch content (r = ‚ąí0.949, p<0.01). This is also clearly shown by Uribelarrea et al. (2004). Interestingly, CP content is also correlated with in vitro starch digestibility after 30 and 150 min (r = ‚ąí0.768 and ‚ąí0.200, p<0.01). Presumably this is because increased protein entraps starch and reduces its susceptibility to enzyme hydrolysis. Perez-Carrillo and Serna-Saldivar (2006) showed that protease increases starch digestibility in an in vitro system. However, in the current study, CP content was not correlated with in vivo energy availability either over the total tract (AME) or at the ileal level (IDE). This suggests that perhaps the gastric acid/protease digestion in vivo is much more effective at removing starch-associated protein than the alkaline protease step used in the in vitro system. The in vitro system reached a maximum starch digestibility coefficient of 0.433 (for maize source Xinjiang). This is lower than expected as in vitro starch digestibility coefficients can reach over 0.9 (Perez-Carillo and Serna-Salvidar, 2006). This suggests that there was an inherent factor of the maize, or the method, that was not allowing complete starch degradation.
There is limited information in the literature as to whether in vivo digestibility and energy availability values correlate with performance values. Most of this information pertains to wheat. Rose et al. (1996) suggest that there is no relationship between AME and FCR in wheat based diets. However, Scott et al. (1999) found a significant negative relationship with 8 d AME or 16 d AME and FCR in wheat based diets without an NSPase addition (r2 = ‚ąí0.63 and ‚ąí0.44 respectively) and in 8 d AME with NSPase addition (r2 = ‚ąí0.46). A very similar response was seen in barley based diets. The variability in AME values decreased dramatically with the use of the enzyme, which possibly explains the decrease or lack in correlation when there was enzyme in the diet. Younger broilers are more susceptible to anti-nutritional factors and it is possible these correlations would disappear in older birds and this would also explain the enzyme affect. The current study shows significant correlations between FCR and IDE, AME, IDEI and AMEI (r = ‚ąí0.405, ‚ąí0.302, ‚ąí0.322 and ‚ąí0.216 respectively) suggesting that the more energy that is available to the bird, the more efficiently it can perform. The strongest correlation was with IDE. However, IDE does not correlate with any proximate analysis or physiochemical parameters. So, presumably there is a factor of the maize that contributes to increased digestibility that is not accounted for by proximate composition given or indicated by the in vitro digestibility method. In wheat based diets, a decrease in digestibility could easily be attributed to non-starch polysaccharides exerting an anti-nutritional effect. However, it is known that maize contains substantially less non-starch polysaccharide than viscous cereals (Knudsen, 1997).
The diets were formulated to be high in maize and even though diets were formulated to local standards and therefore not rich in lysine, the performance of these animals was good. Their performance was comparable to the breeder performance goals. There was apparently no variation in the maize sources in terms of performance or digestibility parameters, although there was a trend towards the sources being different on the basis of IDE and AME (p = 0.066 and 0.058). It is possible that although the samples varied in source, the bird could not differentiate; the samples were not diverse enough for a marked difference. For example, the vitreousness scores varied only between 59.5 and 63.7%. There is little information relating maize vitreousness to bird performance. However, it seems that when a large range of wheat hardness scores are investigated, a positive correlation is found between starch digestibility and hardness (Carr√© et al., 2002; Peron et al., 2006). On the other hand, Rogel et al. (1987) investigated a very small range of Particle Size Index scores, in the middle of the scale (34.5 to 63.6) and failed to find any relationship between hardness and starch digestibility. If this theory is correct then protein solubility index was not a good indicator of nutritional value as this parameter did vary in the current study. Alternatively, a low protein solubility index value may indicate a poorer potential starch digestibility value, but that that is mitigated by a higher starch content, as was also the case in this study. For example, the corn from Xinjiang had the lowest PSI score which would be expected to reduce starch quality and presumably digestibility (Janas et al., 2010). However, corn from Xinjiang also had the highest starch content, lowest CP content and vitreousness which is likely to mitigate the low PSI value in predicting the starch digestibility. Moore et al. (2008) compared six maize variants that appeared to be quite similar in hardness characteristics and did report significant differences between the samples. However, numerically, the differences were small and only seen between weeks 0‚Äď2 and 4‚Äď6. Collins et al. (2001, 2003) have also investigated the effect of maize type on nutritional value. When two maize samples similar in composition but differing in hardness and kernel size were compared, they were found not to be different in performance response (FCR) between day 0 and 42 in two separate studies. Starch type may influence performance also, however, FCR was significantly better between days 19‚Äď42 when birds were fed a normal variant compared to a waxy (high amylopectin) variant although birds fed the waxy maize were significantly heavier (Collins et al., 2003). Furthermore Hsu and Sell (1995) found no difference in the energy value of two maize samples with different bushel weights, and protein contents that varied between 66.3 and 85.3 g/kg, in turkeys suggesting that these quality parameters are not robust in predicting performance either.
So it may be that for maize, composition is only important when extremes are included as these are necessary to differentiate in terms of energy digestibility or performance values. Even then, differences may only be evident in older birds. In support of this, Kasim and Edward (2000) found that between d 0‚Äď16 there were no difference in performance between birds fed on diets with four different maize samples. The authors describe the samples only as being from different consignments however crude protein levels varied between 72 and 80 g/kg. Starch was not described.
It is clear that one factor cannot be taken in isolation to predict nutritional value. When considering the prediction for a single corn, it will mostly likely be a variety of factors that interact together to influence starch (and indeed protein) digestibility. This is evidenced by the fact that none of the correlations shown in Table 7 are equal to one. Thus, no one factor explains all of the variation in starch digestibility.
The efficacy and mode of action NSPases in viscous cereal diets is well understood and well represented in the literature. As already described, xylanase containing enzyme cocktails have shown to be effective in maize-based poultry diets (Wyatt et al., 1997; Zanella et al., 1999; Mathlouthi et al., 2003; Cowieson and Ravindran, 2008). The only references that the authors are aware of pertaining to the use of a majority xylanase product in a maize based diet is also described above (Cowieson et al., 2010). They were in agreement with the current study, that the use of 16,000 BXU/kg xylanase improved the FCR beyond the negative control, between days 0‚Äď21 and 0‚Äď42 so that it was equal to the positive control. In the current study, although the effects of xylanase were highly significant on all performance and digestibility parameters, numerically the numbers were small. The mechanism could still be via viscosity reduction, the small benefit reflecting the low amount of arabinoxylan in maize. Alternatively the prebiotic mechanism may predominate in older birds where a mature caeca can take advantage of the xylo-oligomers generated by enzyme activity.
IMPLICATIONS
When assessing a batch of maize for poultry feed, consideration of quality is important. Full characterisation of the maize is necessary and it is likely that differences in performance will only occur if extremes in quality are evident. A multitude of factors including physiochemical characteristics and proximate composition are likely to influence the way the bird utilises the material; one factor cannot be considered in isolation. Although the mechanism of action is unclear, the use of xylanase in a maize-based diet for poultry aged 0‚Äď18 d may result in a modest but significant performance benefit.
 PDF Links
 PubReader
 ePub Link
 Full text via DOI
 Full text via PMC
 Download Citation
 Print
Print


