 |
 |
| Anim Biosci > Volume 35(11); 2022 > Article |
|
Abstract
Objective
Methods
Results
Conclusion
Notes
ACKNOWLEDGMENTS
Figure 1
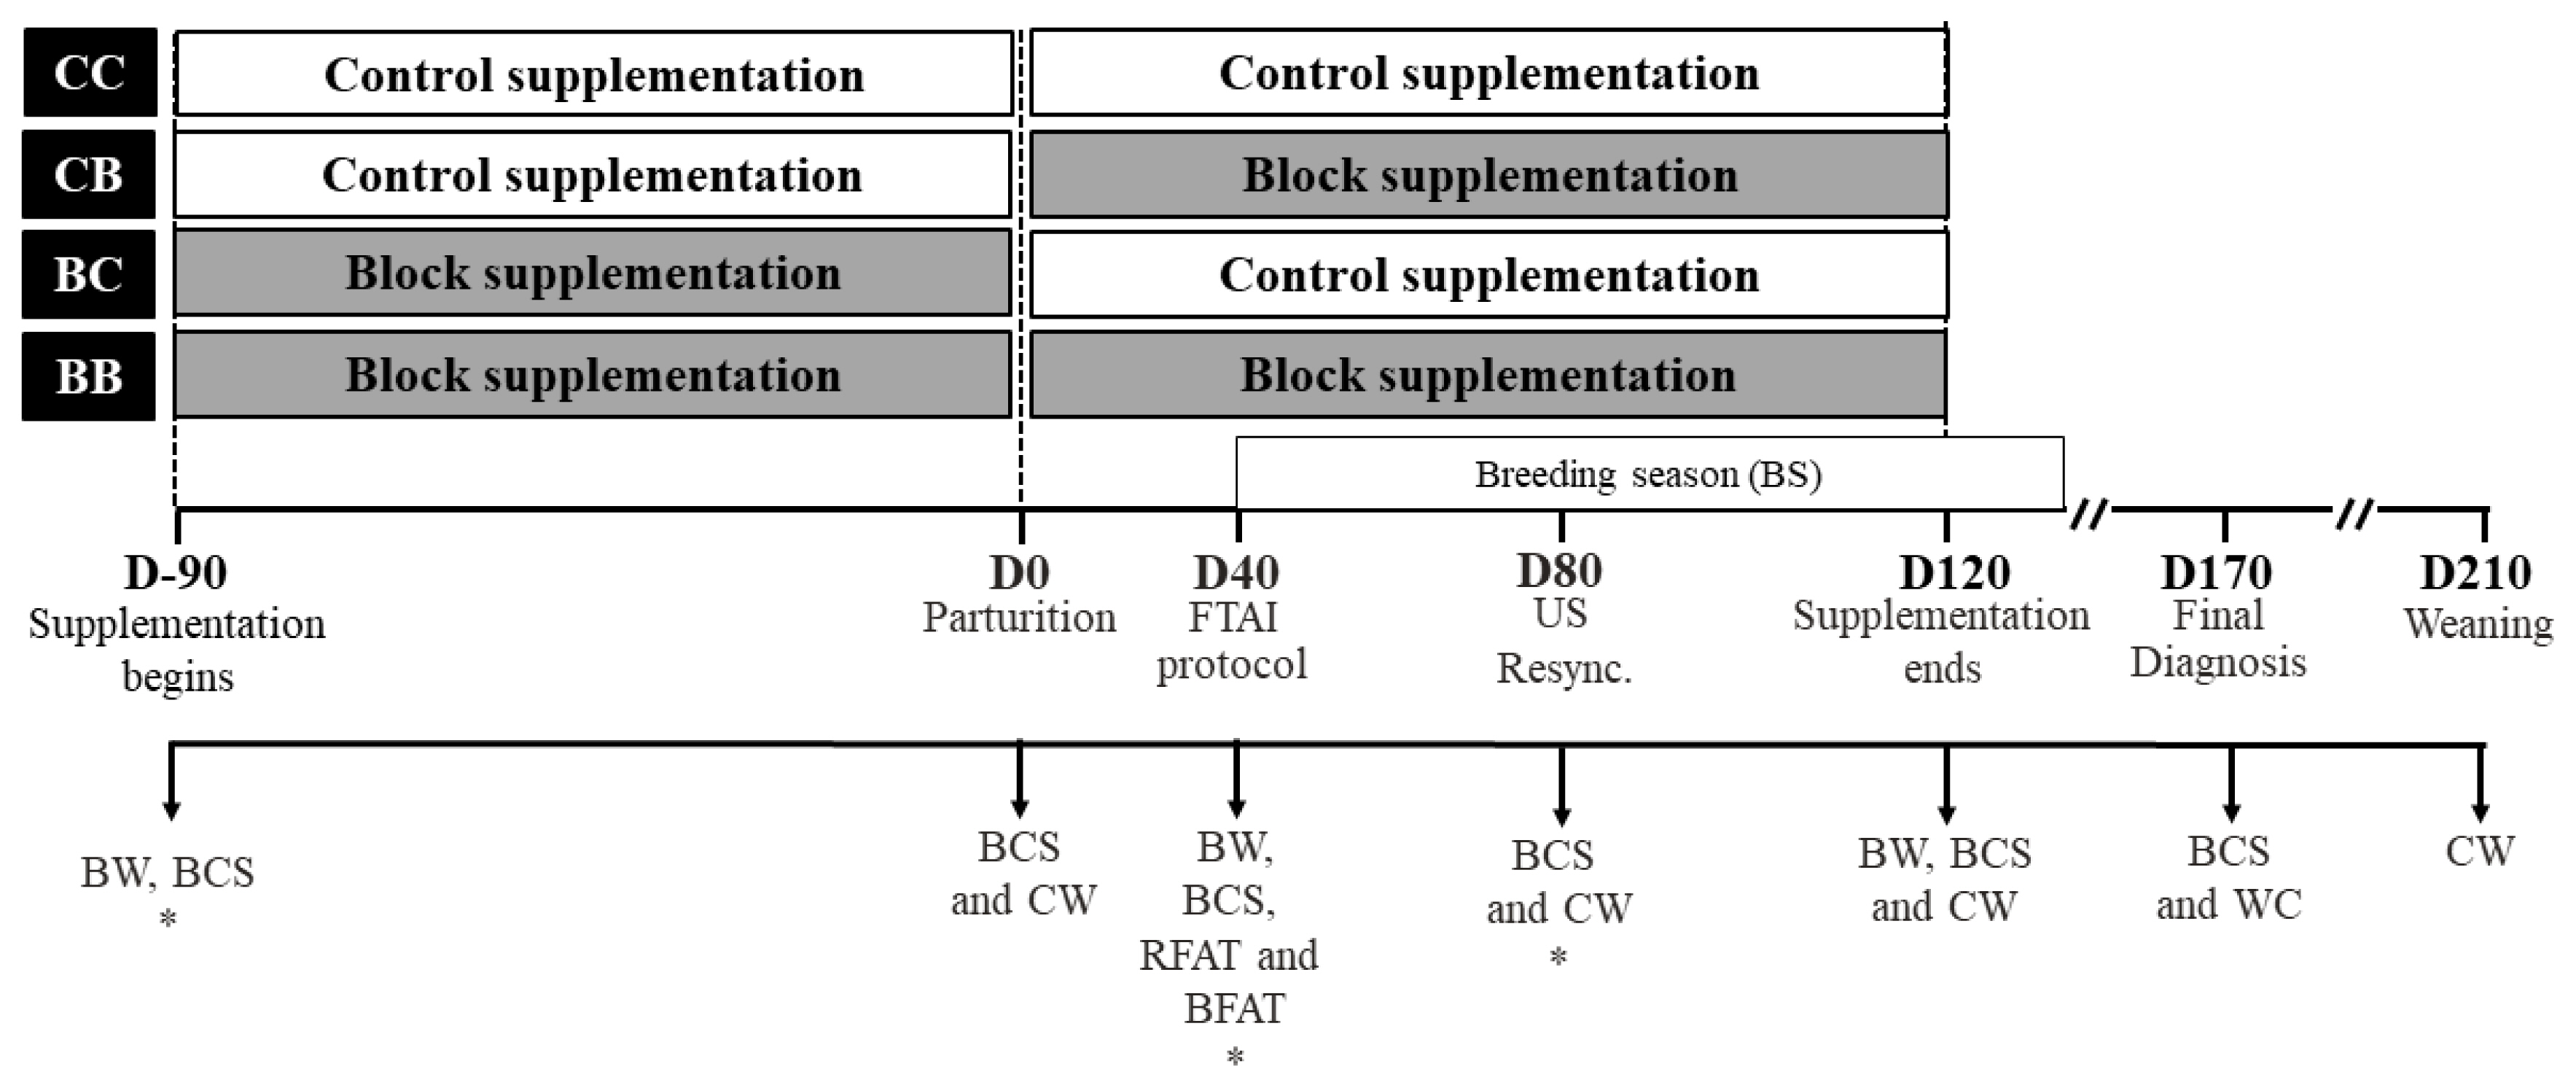
Figure 3
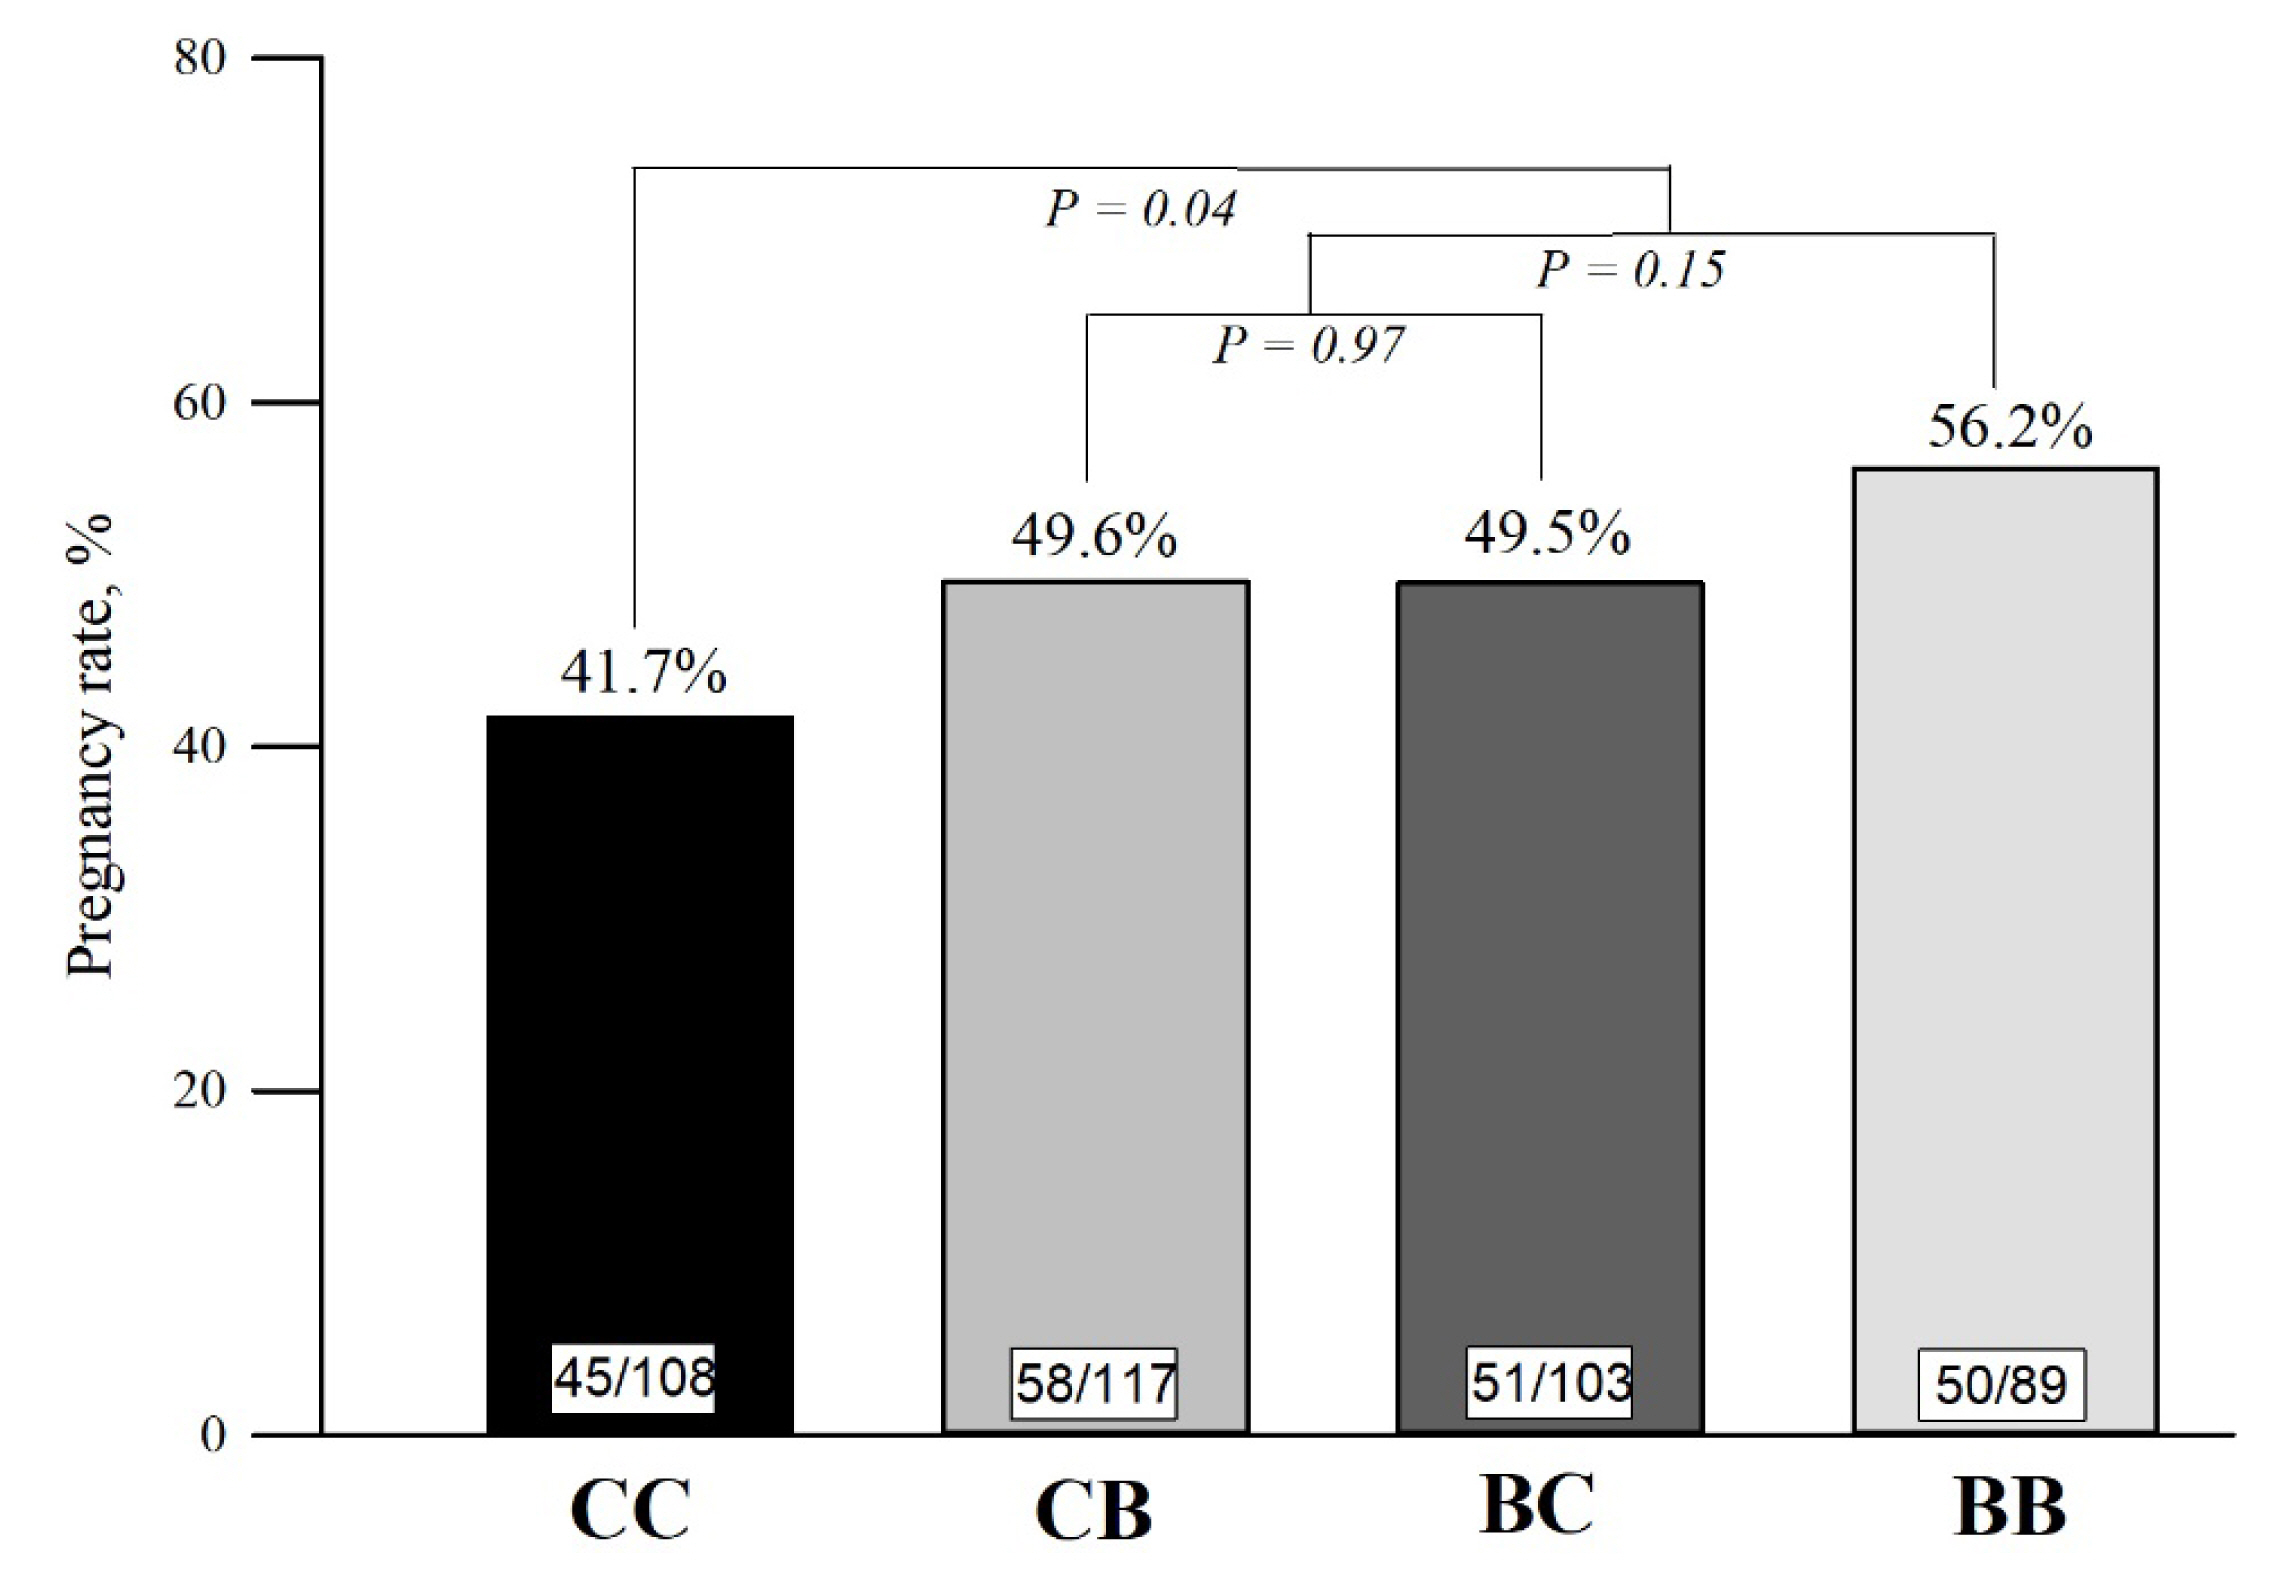
Figure 4
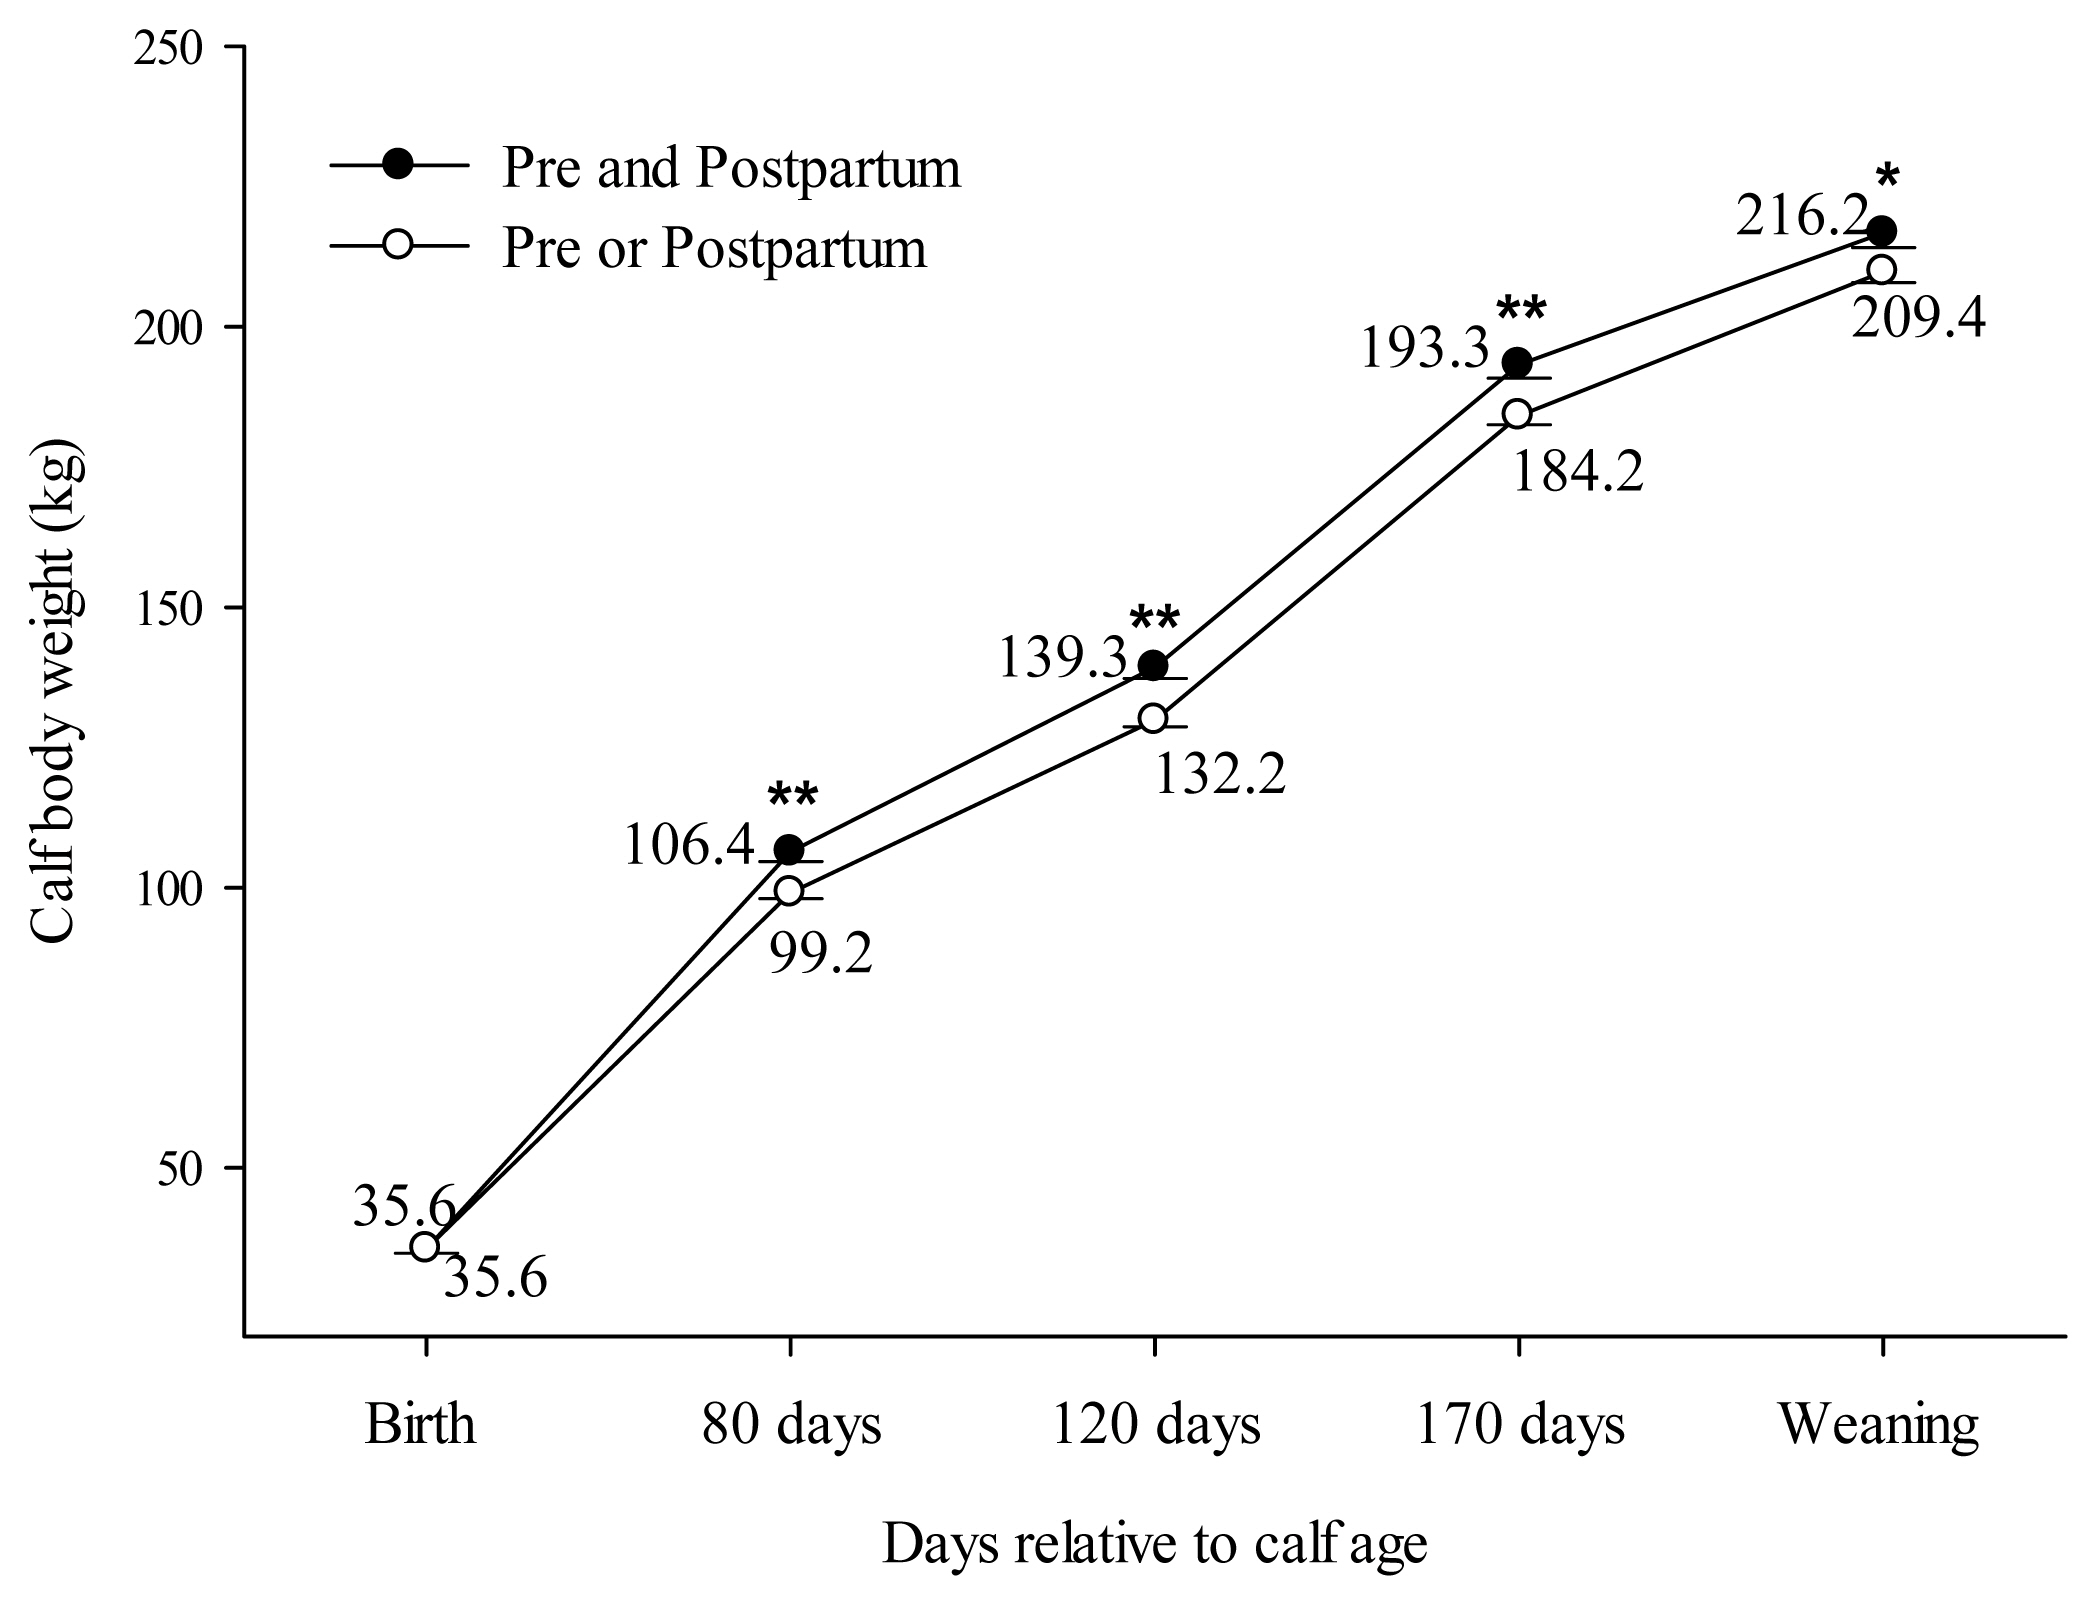
Figure 5
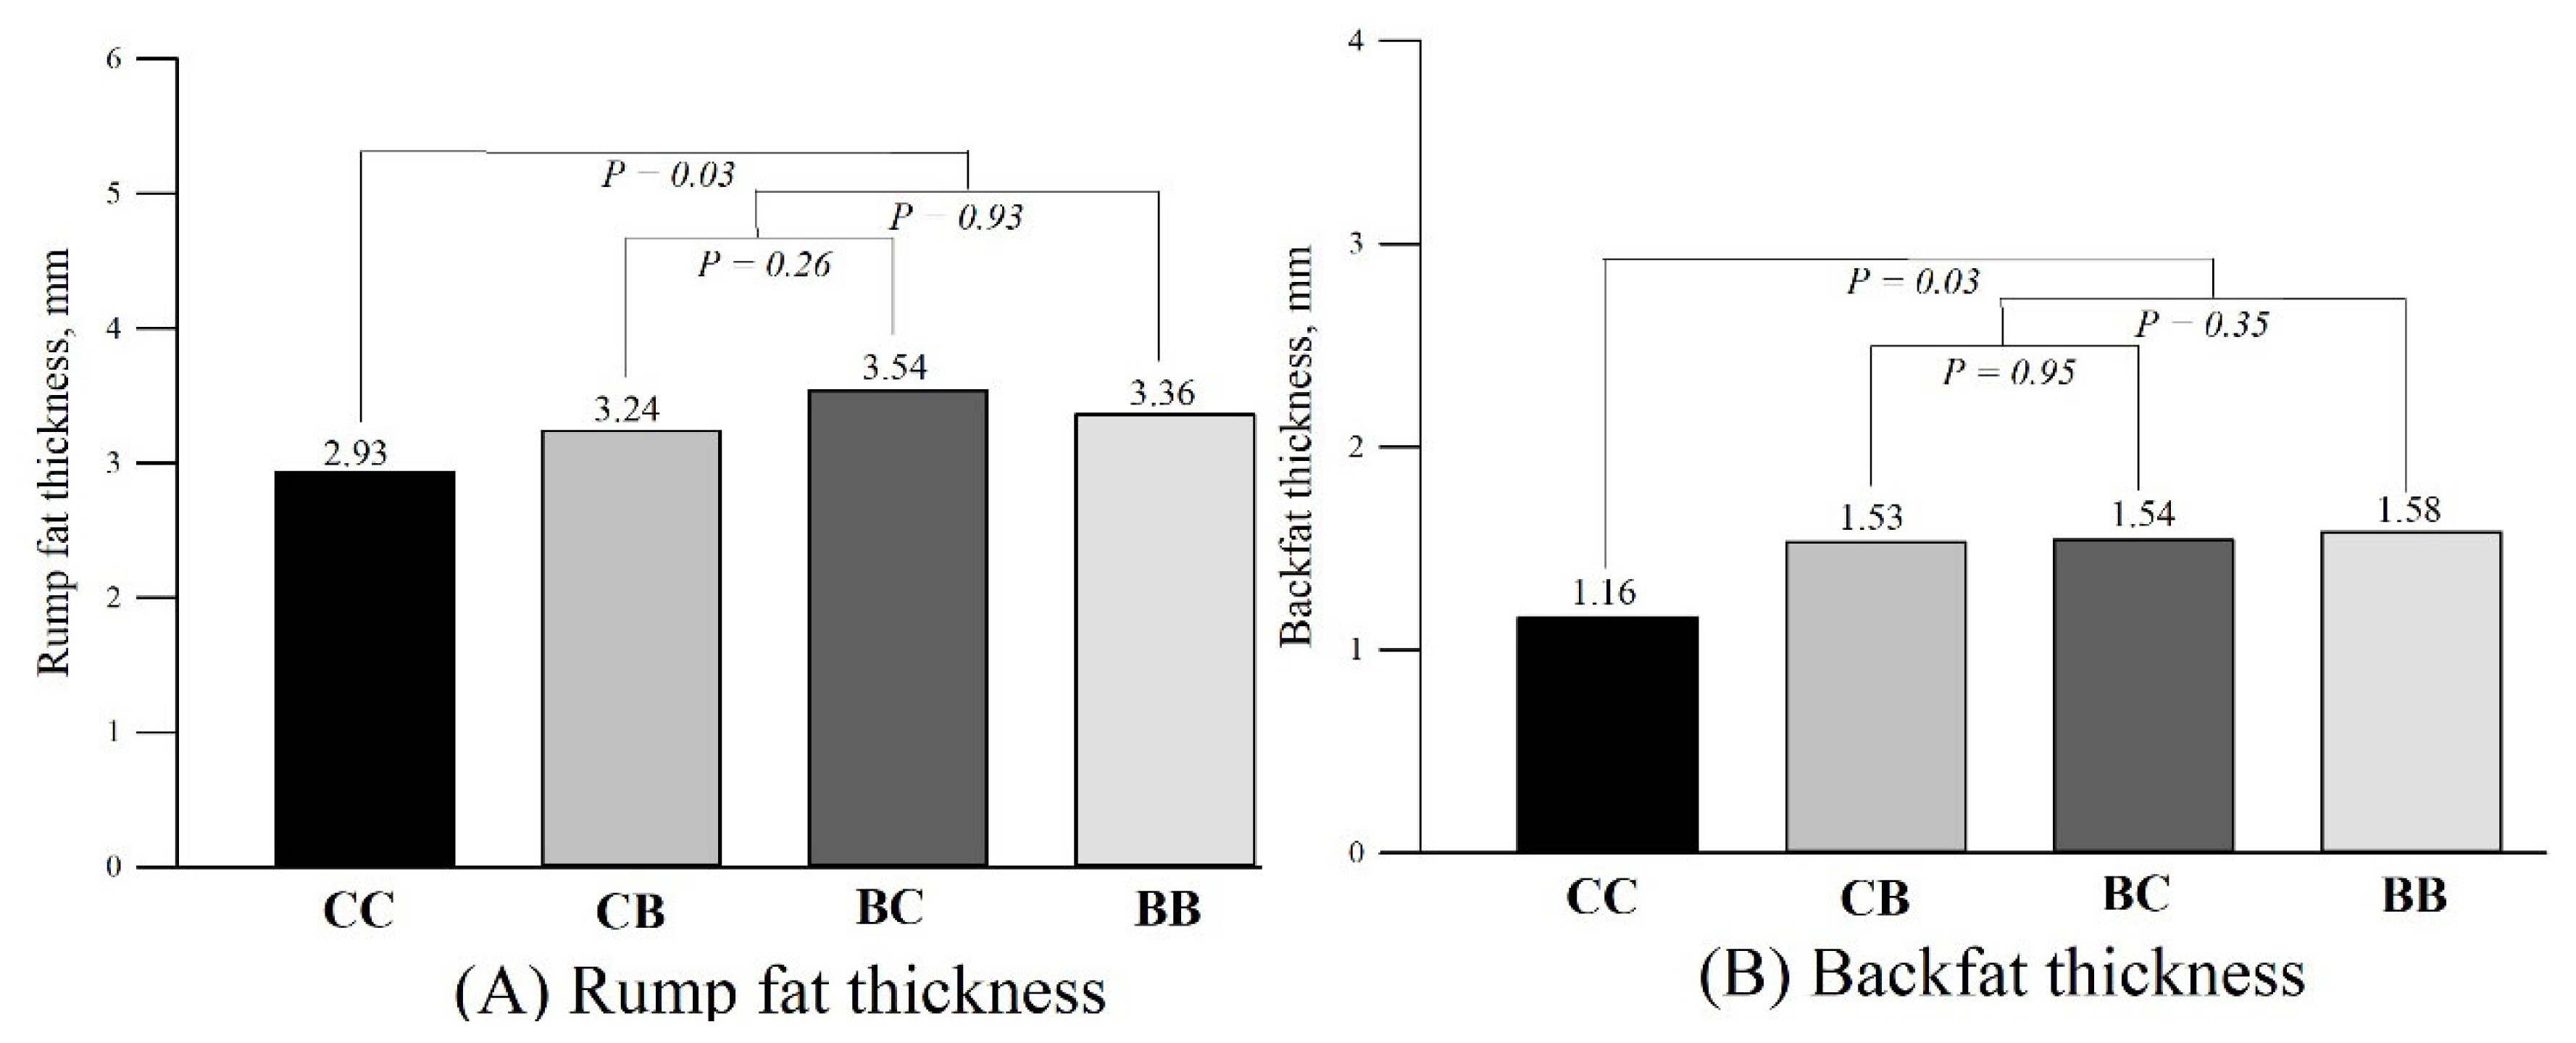
Figure 6
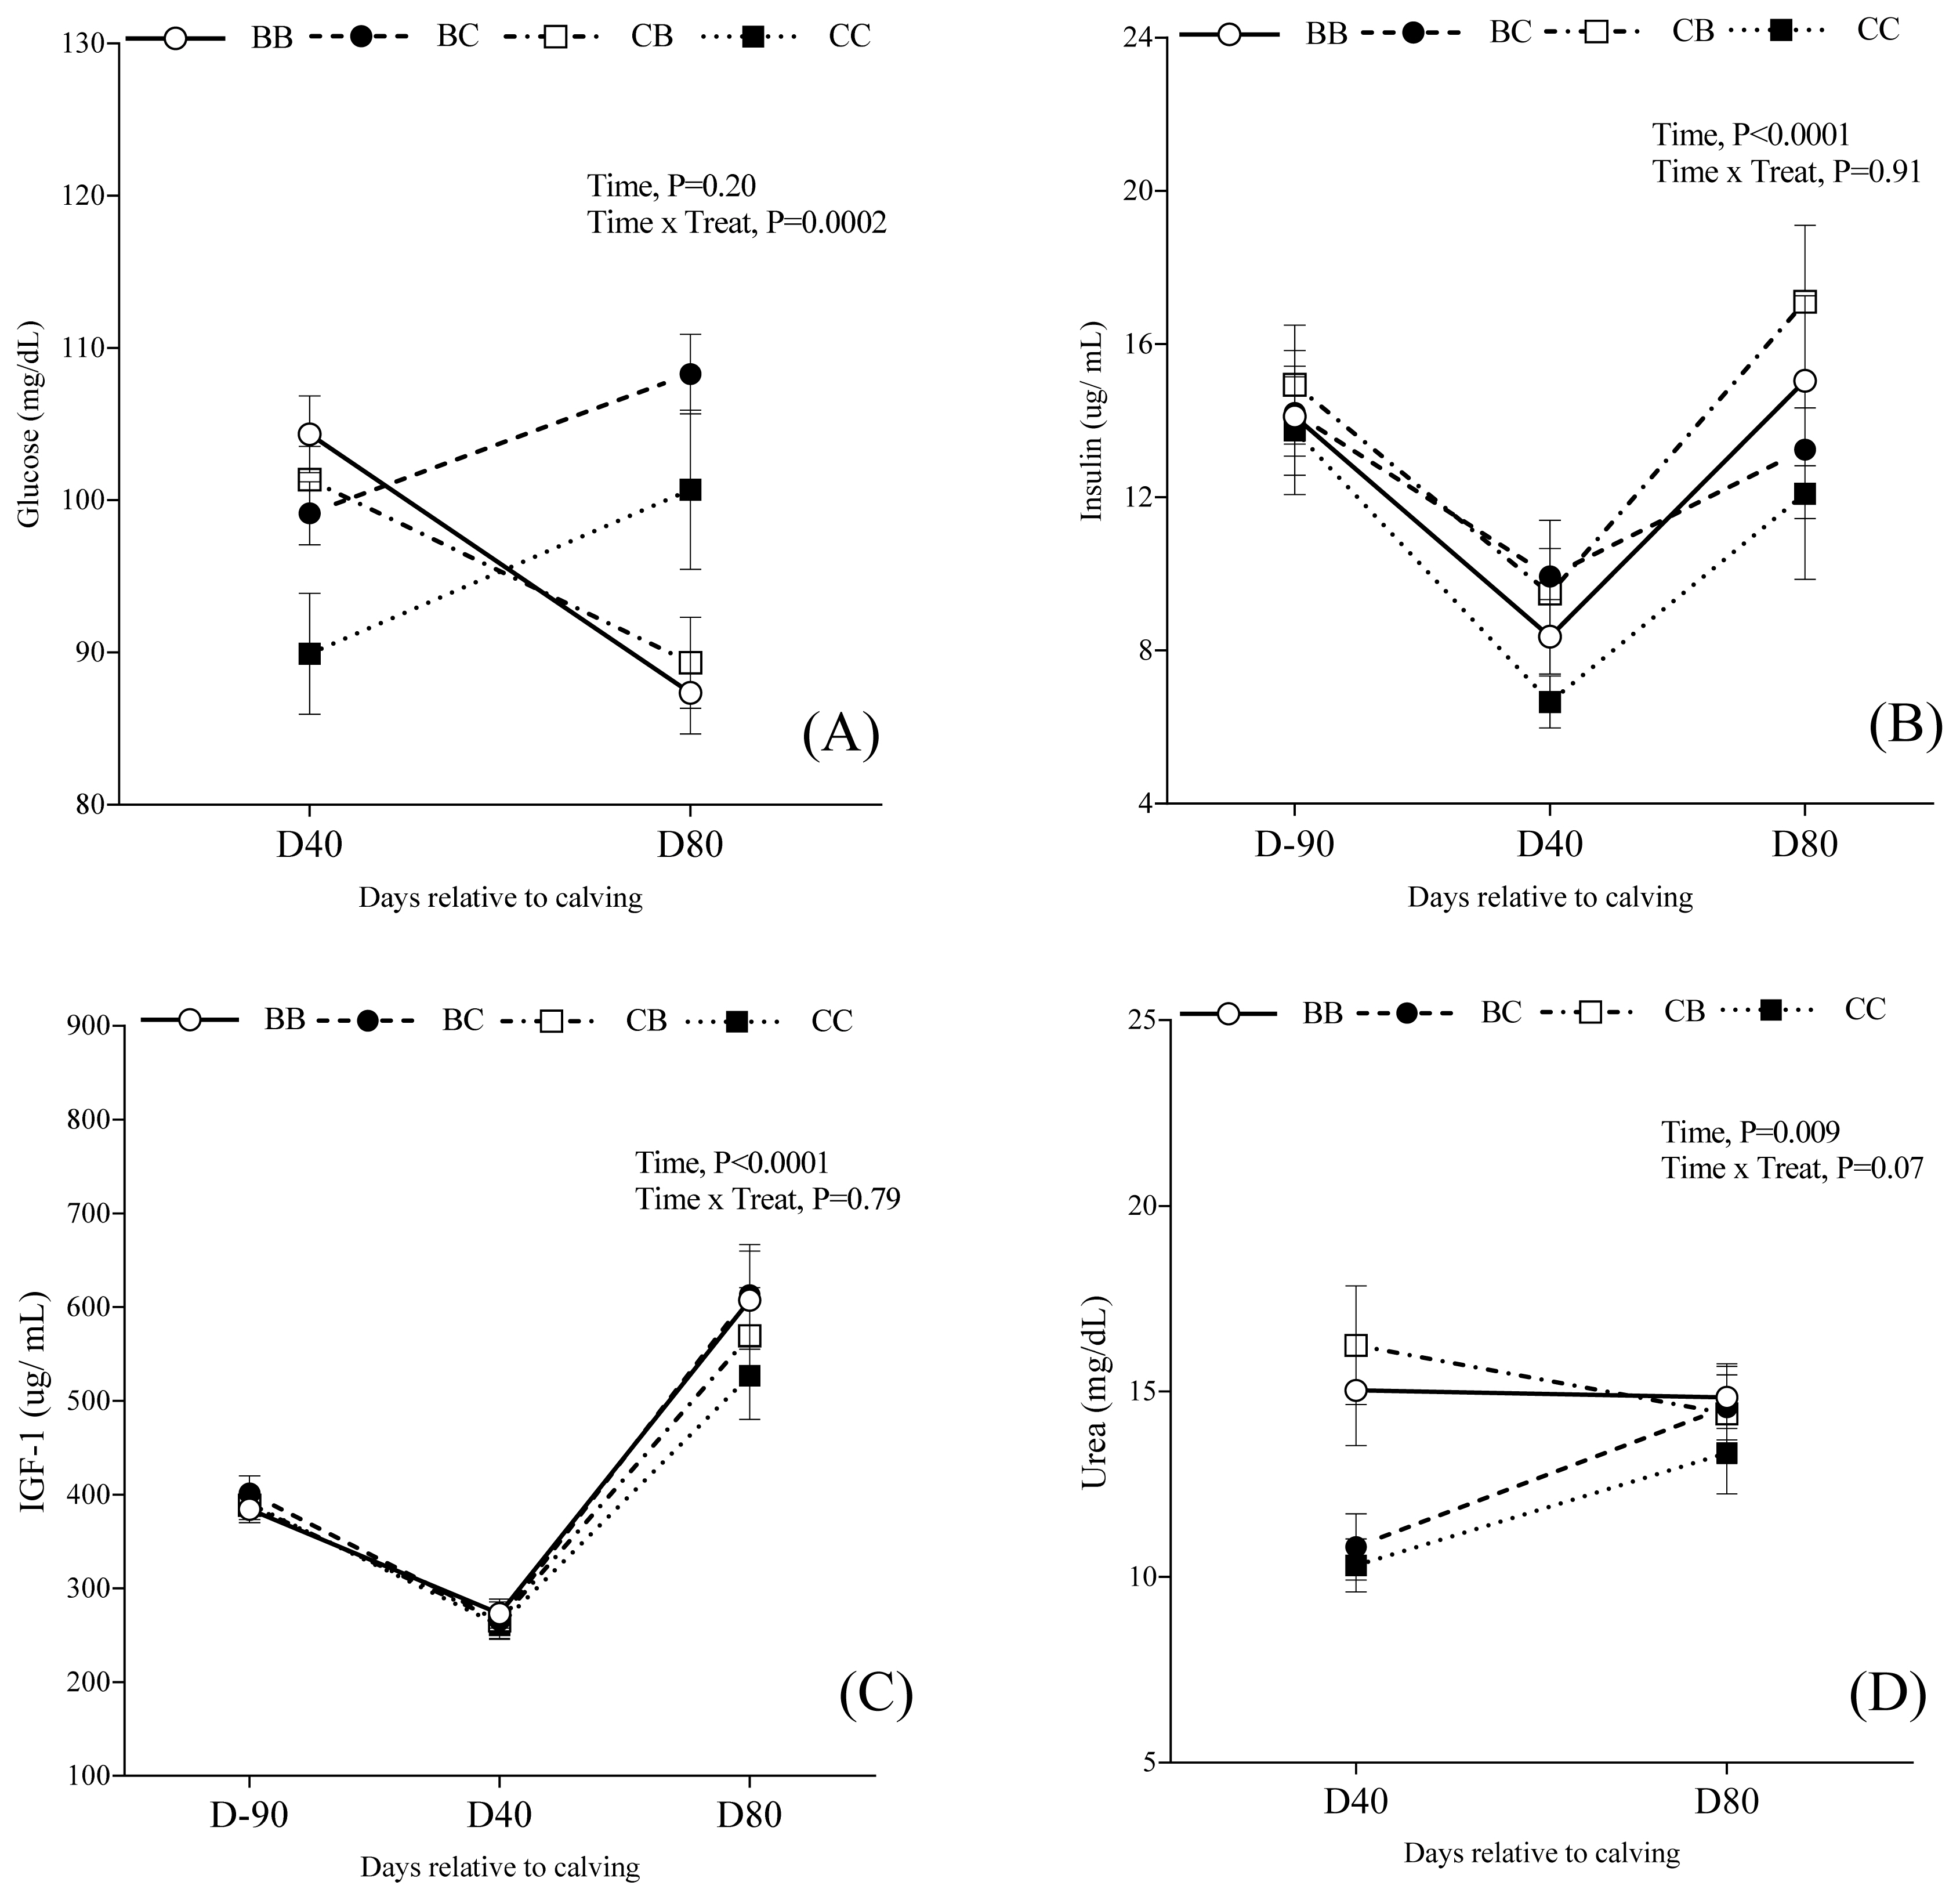
Table 1
| Item | Supplement1) | |
|---|---|---|
|
|
||
| C | B | |
| DM (%) | 92.5 | 90.0 |
| TDN (%) | 35.0 | 40.0 |
| CP (%) | 40.0 | 35.0 |
| NPN (%) | 5.1 | 3.5 |
| Ca (g/kg) | 80 | 65 |
| P (g/kg) | 30 | 20 |
| Na (g/kg) | 50 | 40 |
| S (g/kg) | 5 | 4 |
| Zn (mg/kg) | 1,400 | 920 |
| Cu (mg/kg) | 400 | 230 |
| I (mg/kg) | 20 | 13.5 |
| Co (mg/kg) | 22 | 17.5 |
| Se (mg/kg) | 7.2 | 9 |
| Mn (mg/kg) | 430 | 380 |
| Sodium monensin (mg/kg) | - | 300 |
Table 2
| Item2) | Month1) | |||
|---|---|---|---|---|
|
|
||||
| June | August | November | January | |
| HM (kg DM/ha) | 2.237 | 1.493 | 1.702 | 1.366 |
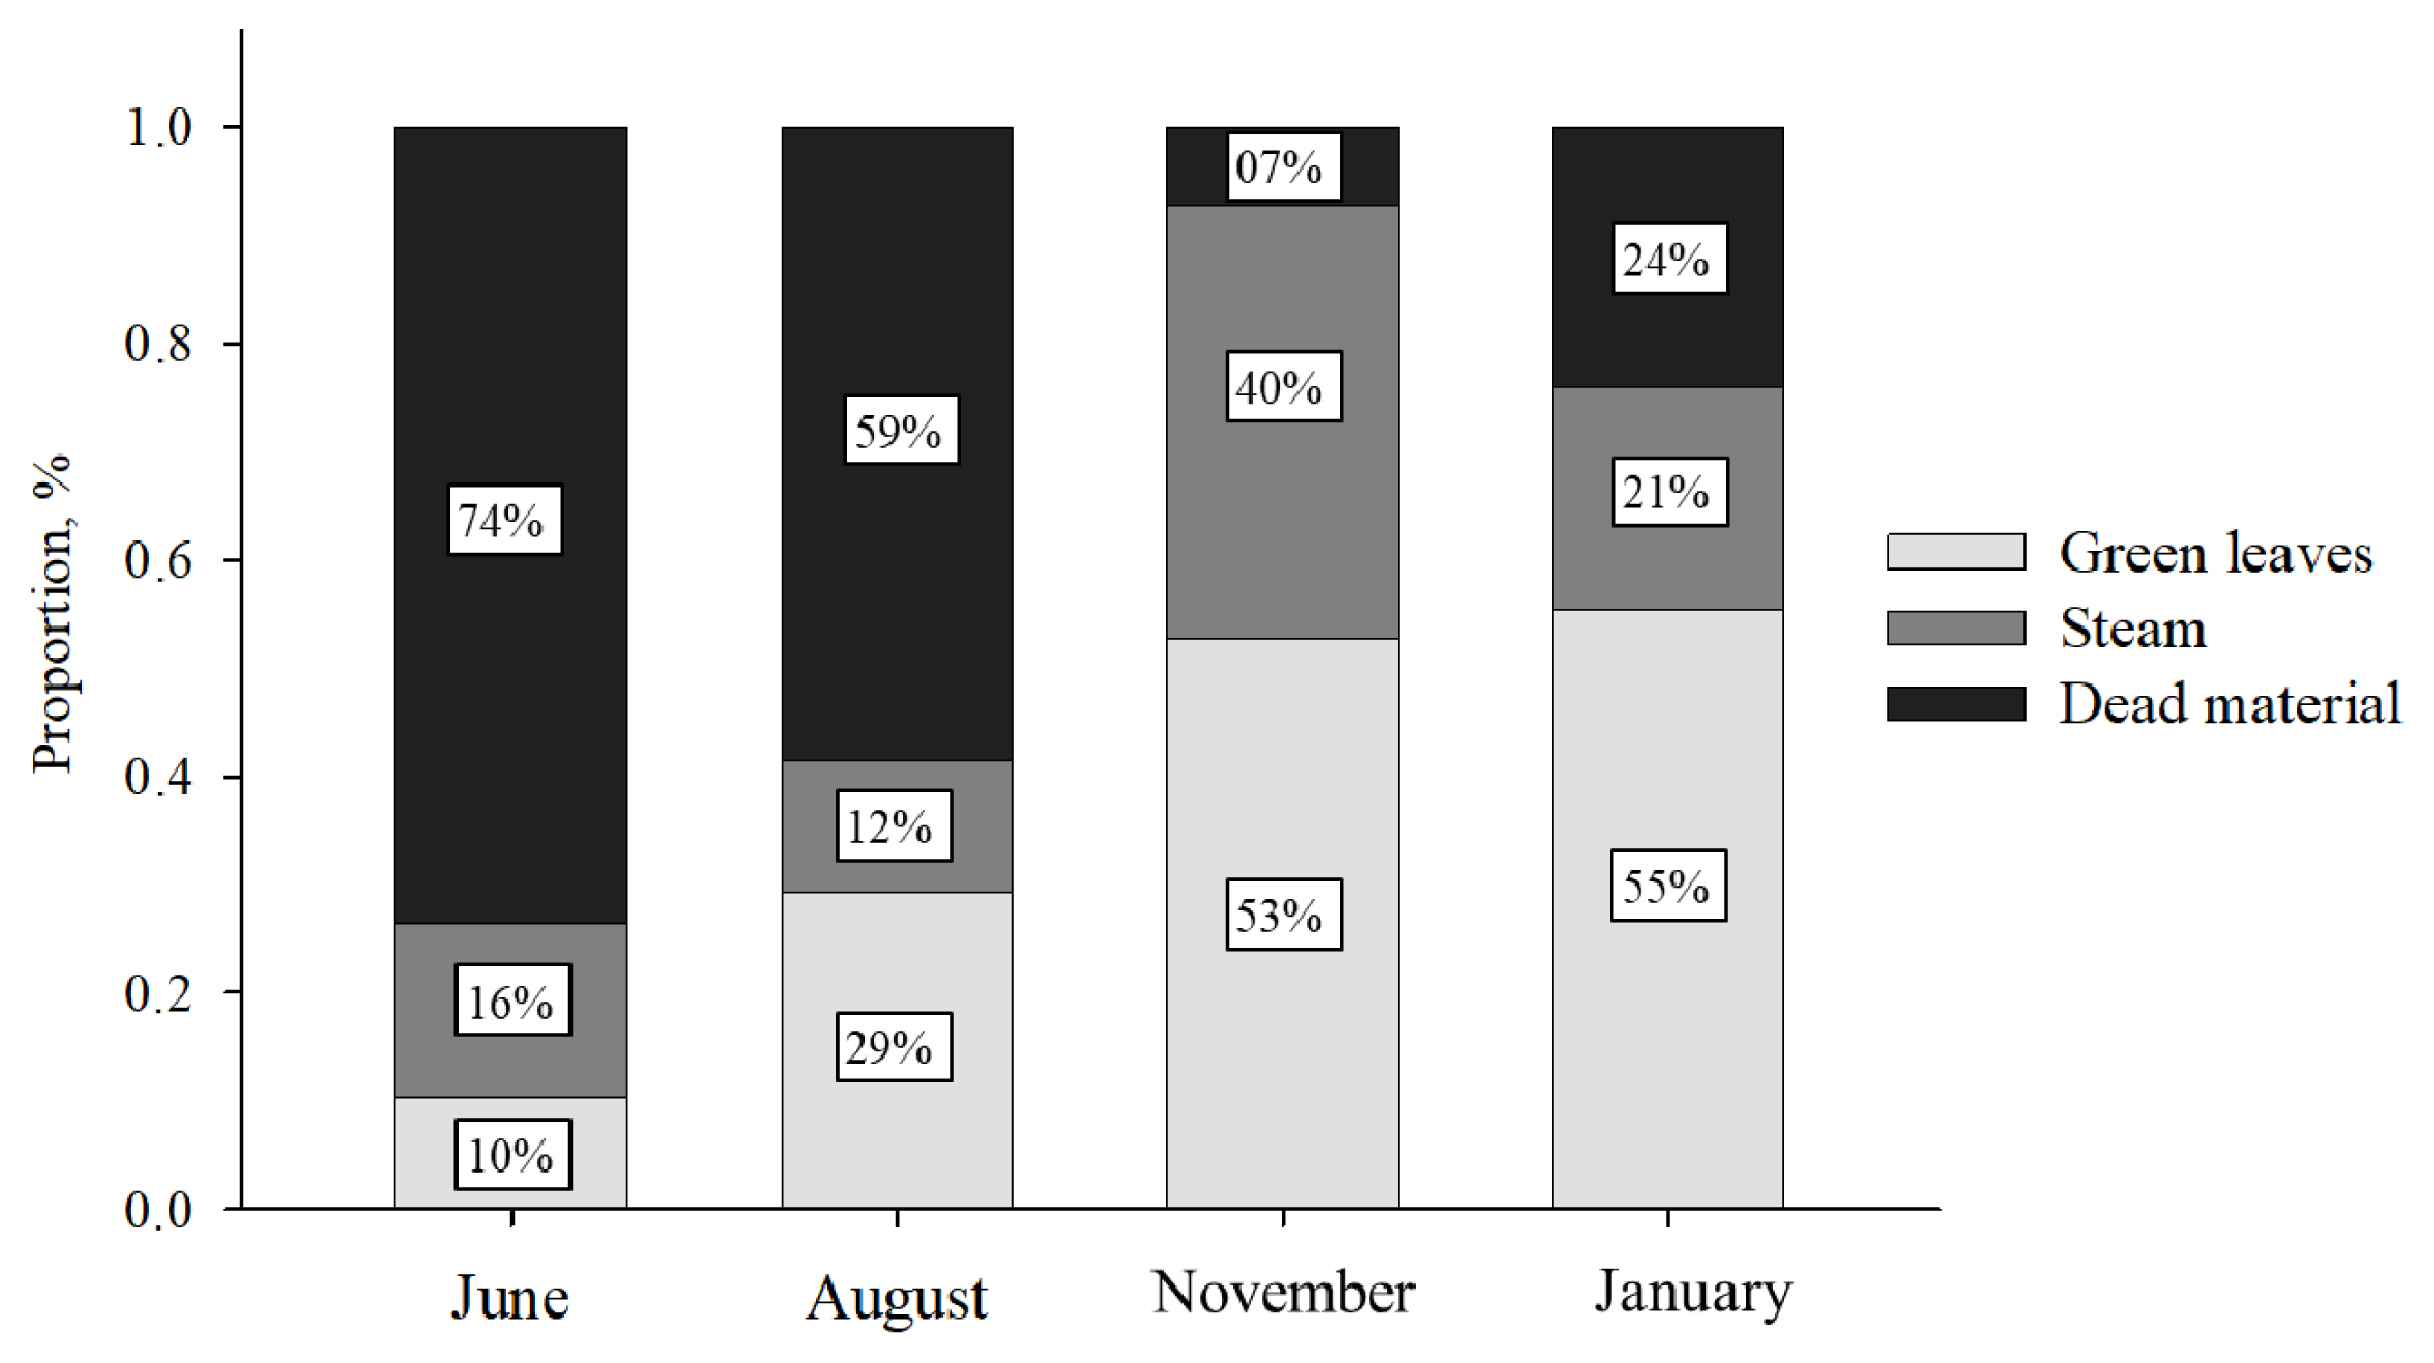
| Green leaves (%) | 10 | 29 | 53 | 55 |
| CP (%) | 14.8 | 14.3 | 8.8 | 9.6 |
| Ca (%) | 3.1 | 2.9 | 3.0 | 2.3 |
| P (%) | 2.1 | 1.5 | 2.1 | 1.6 |
| Cu (mg/kg) | 6.21 | 6.49 | 4.34 | 3.48 |
| Mn (mg/kg) | 82.66 | 77.63 | 52.26 | 32.53 |
| Zn (mg/kg) | 17.84 | 16.53 | 15.23 | 7.04 |
Table 3
| Variable (%, n/n)1) | Treatments2) | p-value3) | |||||
|---|---|---|---|---|---|---|---|
|
|
|
||||||
| CC | CB | BC | BB | C1 | C2 | C3 | |
| Postpartum cyclicity rate at D40 | 15.7 (17/108) | 18.8 (22/117) | 18.4 (19/103) | 22.5 (20/89) | 0.39 | 0.51 | 0.97 |
| Pregnancy rate at first FTAI | 41.7 (45/108) | 49.6 (58/117) | 49.5 (51/103) | 56.2 (50/89) | 0.04 | 0.15 | 0.97 |
| Pregnancy loss of first FTAI | 8.9 (4/45) | 8.6 (5/58) | 5.9 (3/51) | 10.0 (5/50) | 0.98 | 0.30 | 0.60 |
| Pregnancy rate at second FTAI | 46.0 (29/63) | 47.5 (28/59) | 48.1 (25/52) | 48.7 (19/39) | 0.70 | 0.93 | 0.95 |
| Pregnancy loss of second FTAI | 3.4 (1/29) | 7.1 (2/28) | 4.0 (1/25) | 5.3 (1/19) | 0.98 | 0.97 | 0.63 |
| Pregnancy rate at NM | 35.9 (14/39) | 49.5 (19/38) | 41.9 (13/31) | 53.8 (14/26) | 0.28 | 0.72 | 0.51 |
| Overall pregnancy rate at end of BS | 76.9 (83/108) | 83.8 (98/117) | 82.5 (85/103) | 86.5(77/89) | 0.05 | 0.54 | 0.81 |
1) Cyclicity rate, presence of corpus luteum at the onset of the FTAI protocol (D40); FTAI, fixed-time artificial insemination; NM, natural mating; Overall pregnancy rate = 1st FTAI+2nd FTAI+NM; BS, breeding season.
2) CC: heifers received control supplement (C) in loose meal form (0.06% of body weight [BW] offered daily before and after parturition; n = 108); CB: received C before parturition and block supplementation (B) after parturition (0.07% of BW offered weekly after parturition; n = 117); BC: received B before and C after parturition (n = 103); BB: received B before and after parturition (n = 89).
3) Orthogonal contrasts: C1 (Block supplementation effect): Control (CC) vs block supplementation (BB+BC+CB); C2 (Block supplementation effect in both pre and postpartum periods): Pre and postpartum (BB) vs Pre or postpartum (BC+CB); and C3 (Pre or postpartum effect): prepartum (BC) vs postpartum (CB).
Table 4
| Itens1) | Treatment2) | SEM | p-value3) | |||||||
|---|---|---|---|---|---|---|---|---|---|---|
|
|
|
|||||||||
| CC | CB | BC | BB | T | T×treat | C1 | C2 | C3 | ||
| BW (kg) | <0.0001 | <0.0001 | 0.83 | 0.98 | 0.76 | |||||
| 90 days prepartuma | 435.8 | 441.0 | 473.1 | 440.1 | 1.78 | - | - | 0.25 | 0.68 | 0.18 |
| 40 days postpartumb | 400.8 | 412.2 | 400.9 | 413.3 | 1.70 | - | - | 0.03 | 0.16 | 0.001 |
| 120 days postpartumd | 432.9 | 431.3 | 432.9 | 429.0 | 1.79 | - | - | 0.16 | 0.22 | 0.11 |
| BCS, 1–5 | <0.0001 | 0.002 | 0.05 | 0.03 | 0.60 | |||||
| 90 days prepartum4) | 2.91 | 2.95 | 2.93 | 2.94 | 0.01 | - | - | 0.15 | 0.45 | 0.64 |
| Parturition | 3.01 | 3.00 | 3.11 | 3.10 | 0.01 | - | - | 0.04 | 0.25 | <0.001 |
| 40 days postpartum5) | 2.83 | 2.90 | 2.90 | 2.95 | 0.02 | - | - | 0.02 | 0.21 | 0.99 |
| 80 days postpartum6) | 2.84 | 2.91 | 2.85 | 2.98 | 0.02 | - | - | 0.12 | 0.02 | 0.12 |
| 120 days postpartum7) | 3.00 | 3.07 | 2.99 | 3.04 | 0.02 | - | - | 0.56 | 0.65 | 0.20 |
| 170 days postpartum8) | 2.78 | 2.87 | 2.74 | 2.84 | 0.01 | - | - | 0.34 | 0.33 | 0.001 |
2) CC: heifers received control supplement (C) in loose meal form (0.06% of body weight [BW] offered daily before and after parturition; n = 108); CB: received C before parturition and block supplementation (B) after parturition (0.07% of BW offered weekly after parturition; n = 117); BC: received B before and C after parturition (n = 103); BB: received B before and after parturition (n = 89).
3) Orthogonal contrasts: C1 (Block supplementation effect): control (CC) vs block supplementation (BB+BC+CB); C2 (Block supplementation effect in both pre and postpartum periods): Pre and postpartum (BB) vs Pre or postpartum (BC+CB); and C3 (Pre or postpartum effect): prepartum (BC) vs postpartum (CB); T = time, days relative to calving; T×treat = interaction between sampling time and treatment.
Table 5
| Items | Treatment1) | SEM | p-value2) | |||||||
|---|---|---|---|---|---|---|---|---|---|---|
|
|
|
|||||||||
| CC | CB | BC | BB | T | Txtreat | C1 | C2 | C3 | ||
| CW (kg) | <0.0001 | <0.0001 | 0.11 | 0.20 | 0.13 | |||||
| Birth | 34.6 | 35.4 | 35.7 | 35.6 | 0.65 | - | - | 0.01 | 0.89 | 0.16 |
| 80 days3) | 97.8 | 98.7 | 99.7 | 106.4 | 0.78 | - | - | 0.03 | <0.001 | 0.75 |
| 120 days4) | 123.9 | 132.9 | 126.5 | 139.3 | 0.91 | - | - | <0.001 | <0.001 | 0.002 |
| 170 days5) | 182.9 | 183.7 | 184.8 | 193.3 | 1.18 | - | - | 0.55 | 0.002 | 0.93 |
| Weaning6) | 207.7 | 208.8 | 210.0 | 216.2 | 1.45 | - | - | 0.38 | 0.02 | 0.74 |
1) CC: heifers received control supplement (C) in loose meal form (0.06% of body weight [BW] offered daily before and after parturition; n = 108); CB: received C before parturition and block supplementation (B) after parturition (0.07% of BW offered weekly after parturition; n = 117); BC: received B before and C after parturition (n = 103); BB: received B before and after parturition (n = 89).
2) Orthogonal contrasts: C1 (Block supplementation effect): Control (CC) vs block supplementation (BB+BC+CB); C2 (Block supplementation effect in both pre and postpartum periods): Pre and postpartum (BB) vs Pre or postpartum (BC+CB); and C3 (Pre or postpartum effect): prepartum (BC) vs postpartum (CB). T, time, days relative to calf age; T×treat, interaction between sampling time and treatment.
Table 6
| Items | Treatment1) | SEM | p-value2) | |||||||
|---|---|---|---|---|---|---|---|---|---|---|
|
|
|
|||||||||
| CC | CB | BC | BB | T | TreatxT | C1 | C2 | C3 | ||
| Insulin (μg/mL) | (10.80) | (13.88) | (12.39) | (12.55) | 0.49 | <0.0001 | 0.91 | 0.008 | 0.13 | 0.26 |
| 90 days prepartum3) | 13.75 | 14.94 | 14.21 | 14.11 | 0.78 | - | - | - | - | - |
| 40 days postpartum4) | 6.66 | 9.49 | 9.93 | 8.63 | 0.58 | - | - | - | - | - |
| 80 days postpartum5) | 12.10 | 17.11 | 13.25 | 15.04 | 1.05 | - | - | - | - | - |
| IGF-1 (ng/mL) | (388.5) | (405.8) | (423.8) | (418.7) | 11.16 | <0.0001 | 0.79 | 0.24 | 0.35 | 0.99 |
| 90 days prepartum3) | 390.6 | 388.7 | 401.3 | 384.6 | 7.57 | - | - | - | - | - |
| 40 days postpartum4) | 260.7 | 265.4 | 265.7 | 273.1 | 7.59 | - | - | - | - | - |
| 80 days postpartum5) | 526.9 | 569.4 | 613.0 | 607.4 | 20.70 | - | - | - | - | - |
| Glucose (mg/dL) | 0.20 | 0.0002 | 0.83 | 0.76 | 0.20 | |||||
| 40 days postpartum4) | 89.9 | 101.6 | 99.1 | 104.3 | 1.83 | - | - | 0.01 | 0.34 | 0.65 |
| 80 days postpartum5) | 100.7 | 108.3 | 89.3 | 87.4 | 3.16 | - | - | 0.15 | 0.11 | 0.03 |
| Urea (mg/dL) | 0.009 | 0.07 | 0.04 | 0.19 | 0.22 | |||||
| 40 days postpartum4) | 10.31 | 16.24 | 10.81 | 15.03 | 0.70 | - | - | 0.03 | 0.33 | 0.004 |
| 80 days postpartum5) | 13.34 | 14.40 | 14.57 | 14.44 | 0.51 | - | - | 0.41 | 0.97 | 0.91 |
1) CC: heifers received control supplement (C) in loose meal form (0.06% of body weight [BW] offered daily before and after parturition; n = 108); CB: received C before parturition and block supplementation (B) after parturition (0.07% of BW offered weekly after parturition; n = 117); BC: received B before and C after parturition (n = 103); BB: received B before and after parturition (n = 89).
2) Orthogonal contrasts: C1 (Block supplementation effect): Control (CC) vs block supplementation (BB+BC+CB); C2 (Block supplementation effect in both pre and postpartum periods): Pre and postpartum (BB) vs Pre or postpartum (BC+CB); and C3 (Pre or postpartum effect): prepartum (BC) vs postpartum (CB).
REFERENCES
- TOOLS


 PDF Links
 PubReader
 ePub Link
 Full text via DOI
 Full text via PMC
 Download Citation
 Print
Print


