


INTRODUCTION
Many factors affect the energy expenditure in poultry. The indirect calorimetry method, together with heat production (HP) measurements, are being used to provide a better explanation of energy metabolism and HP variation factors [1]. A real-time HP measurement can evaluate the animal energy metabolism (and energy utilization) under different conditions and the energy available from the diets or feedstuff. Both components are essential to implementing the net energy (NE) system (requirements and feed energy values) [2].
The HP variations were studied under the effect of different factors. These can be classified as inherent to the animal (e.g., body mass, behavior, physiological state), dependent on the feed characteristics (e.g., Physico-chemical composition, particle size, feed processing, and bio-active components like exogenous enzymes), and environmental factors (e.g., temperature, photoperiod) [2ŌĆō4]. The HP is partitioned in its components of fasting heat production (FHP) and the thermal effect of feeding (TEF) or heat increment, aiming to elucidate the impact of each factor on energy metabolism. The FHP represents the minimum energy required to sustain life [5]. It is measured when the animal is subject to fasting, under thermoneutrality, and in an inactive circadian phase [6].
On the other hand, the TEF is described as the metabolic heat due to postprandial thermogenesis and metabolic utilization of nutrients, affected principally by the feed chemical composition [1,7,8].
Additionally, another source of energy expenditure is due to physical activity (HPA). In poultry production, the HPA has a low contribution to the total HP; however, it should not be neglected because physical activity (PA) increases the noise of collected data during a continuous measurement of HP. Besides, the physiological response from PA is influenced by metabolic heat expended and energy utilization [9].
This paper describes a procedure to quantify the partitioning of HP in FHP, HPA, and the TEF on roosters.
MATERIALS AND METHODS
Animals and management practice
The animal utilization, management and procedures were approved by The Ethics Committee on Animal Use of the Faculdade de Ci├¬ncias Agr├Īrias e Veterin├Īrias, UNESP, Jaboticabal, S├Żo Paulo, Brazil under protocol number n┬░ 013078/19.
Eighteen 54-wk-old Hy Line Brown roosters (2.916┬▒0.15 kg) were used. During the pre-experimental period, the roosters were allocated in individual cages (80├Ś80├Ś75 cm) equipped with feeders and nipple drinkers and maintained at 22┬░C┬▒2.2┬░C under a 16 L:8 D light program. The roosters were fed mash type diet (Table 1).
Experimental protocol
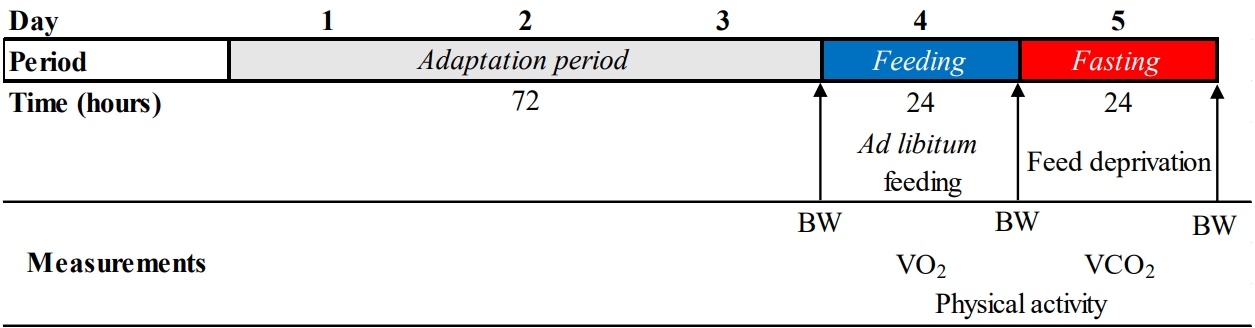
Every 5 d, one bird was randomly selected and transferred to the respiration chamber. The daily management consisted of bird weighting, excreta removal, chamber cleaning, and feed allocation. Daily, the bird's manipulation and chamber saturation lasted 2 h, and this period was not considered for gas exchange calculations.
During the data collection, roosters were adapted for 3 d (with free access to feed and freshwater), followed by the measurement of HP under ad libitum feeding (~24 h). Then, the feed was withdrawn to measure the HP in the fasting condition (~24 h) (Figure 1).
Indirect calorimetry and physical activity measurements
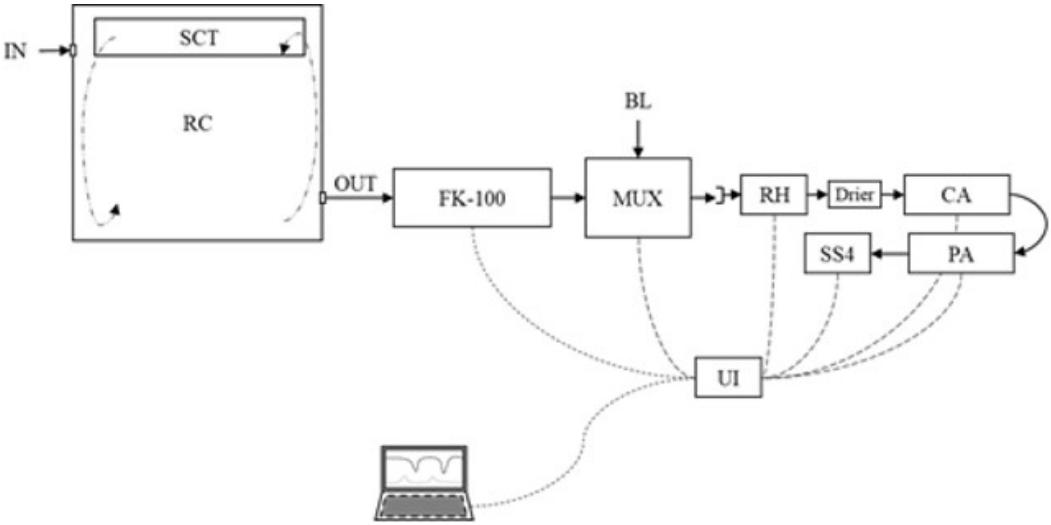
The gas exchange measurement was done in an open circuit respirometry chamber (dimension: 90├Ś85├Ś95 cm), equipped with environmental temperature control. The respirometry system (Figure 2) consists of a mass flow pump (FK-100; Sable System, Las Vegas, NV, USA) that sucks atmospheric air (by negative pressure) to the inside of the chamber at a flow range between 8 to 12 L/min. The ventilation flow was set to maintain the CO2 out-going concentration below 1%. A sub-sampler pump was set at 160 mL/min (SS4; Sable System, USA) to conduct the air sample through the drier (>99.5% CaSO4 dihydrate) and gas analyzers. The water vapor pressure was recorded by RH-100 (Sable System, USA), and the O2 and CO2 were measured using a paramagnetic analyzer (PA-10; Sable System, USA) and infrared analyzer (CA-10; Sable System, USA), respectively. The multiplexer (MUX; Sable System, USA) was programmed to record one data each second, by 3,000 s to chamber gas concentrations recording and 600 s for atmospheric air concentration. This procedure was repeated (in a loop) each hour for 24 h. Average gas concentration every hour was used for HP calculation. The CO2 mass recovery factor was 1.032 from a recovery test on the whole respirometry system check.
The physical activity (PA) was measured by an accelerometer (MPU-6050 Three-Axis; MEMS MotionTracking, San Jose, CA, USA) located below the cage to record the vibration (sensibility of ┬▒0.1 mV/s). The cage floor was a solid unfixed platform adapted to transfer the animal's movement with springs on the four vertexes. The PA was recorded each second and averaged every 60 points for further calculations.
Gas exchange and heat production calculations
According to the Lighton [10] description for an open-circuit system (pull-mode), the gas exchange calculation was done. The in-going airflow (Fin) to the chamber, oxygen consumption (VO2), and production of carbon dioxide (VCO2) were calculated according to the following calculations.
Where, Fout is the out-going airflow (measured by the FK-100 pump), [O2]in and [CO2]in is the atmospheric gas concentrations or baseline. VO2 and VCO2 were calculated from the corrected volume of gas at standard temperature and pressure dry and expressed per unit of metabolic body weight (BW) per day (kg0.75/d). The respiratory quotient (RQ) was calculated as
VCO 2 VO 2
Heat production description events and partitioning
The HP partitioning was based on metabolic conditions: A, ad libitum feeding, where the roosters have free access to feed; B, short fasting period; and C, long fasting period. A segmented model was used to describe the limit between a short and long fasting period, assumed as the variation between the drop of the metabolic cost up to lower stable phases, respectively:
Where U is the decline rate of HP (dependent variable) until time R (broken point), L is the plateau value of HP (plateau-FHP), I is the conditional factor (I = 1 if t<R or I = 0 if t>R), and t is the time (independent variable). The parameter R presents the time of transition between a short to a long fasting period (to define the B and C).
The HP partitioning was described for a rooster (no growth animal) subject to ŌĆ£no limitingŌĆØ conditions, considering the sum of their components:
The components with (t) subindex are assumed to be subject to variation along the measured time.
During event C, two components of HP were described without the effect of heat due feeding process, turning feasible to isolate the heat-induced per unit of PA through the linear regression model:
From Eq. 7, the standardized fasting heat production (st-FHP = ╬▓0) and the rate of heat production per unit of PA (HPA = ╬▓1├ŚPA) were estimated.
Statistical analyses
VO2, VCO2, RQ, and HP obtained during the feeding and fasting periods were subjected to one-way analysis of variance analysis. In addition, the HP and time for the segmented model (Eq. 5) were fitted using a non-linear regression procedure. In contrast, linear regression analyses were used for the HP and the PA (Eq. 7). The statistical analyses were performed using the Minitab v.20 statistical software (Minitab Inc., StateCollege, PA, USA).
RESULTS
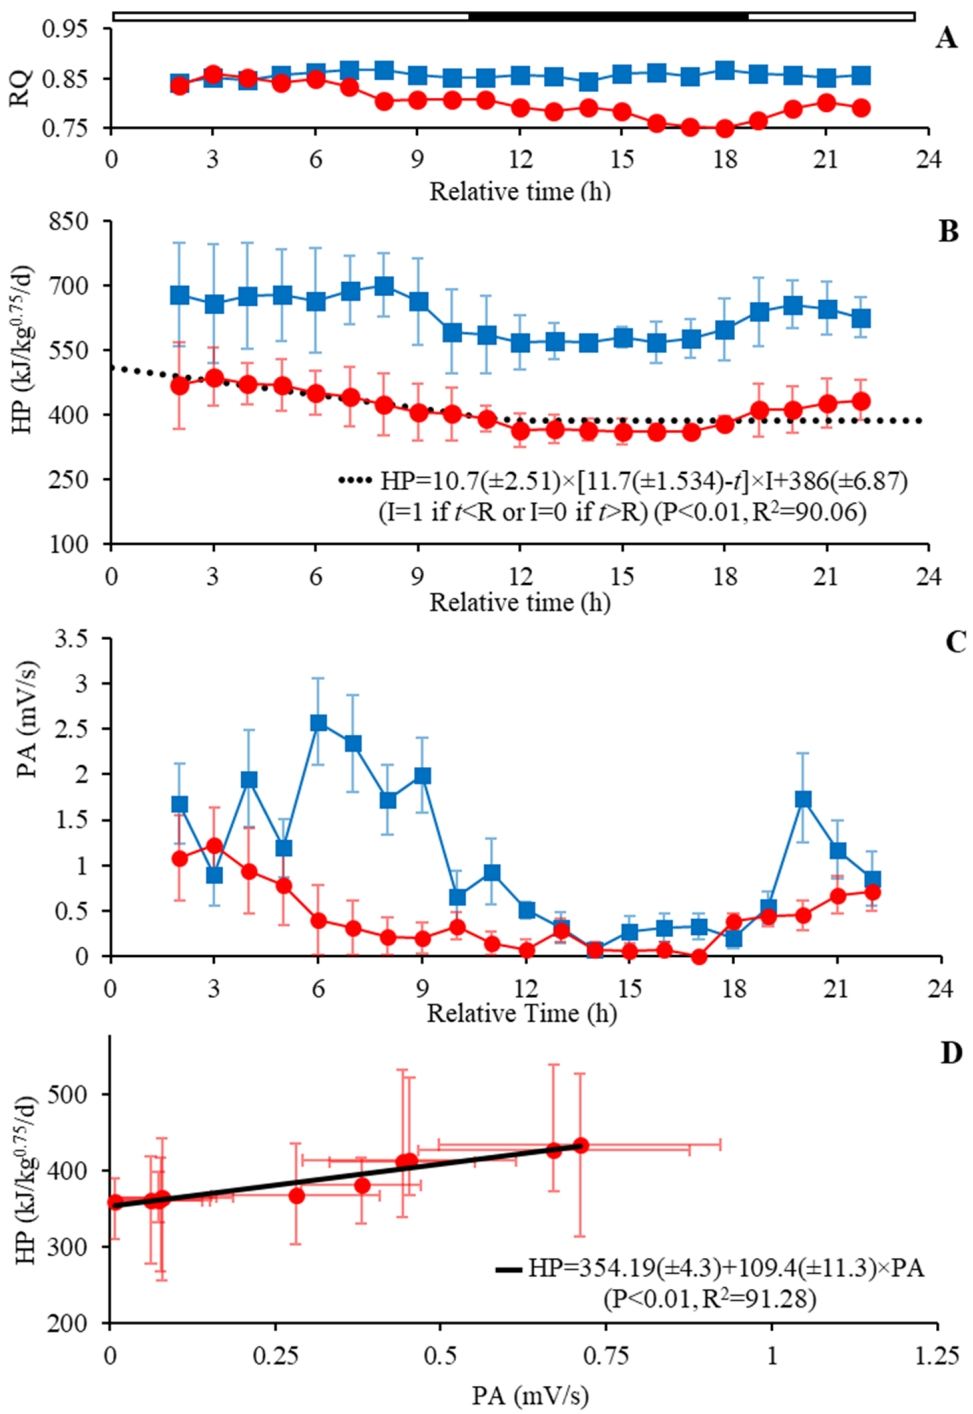
The average values of the gas exchange parameters (VO2 and VCO2), HP, and RQ are reported for the feeding and fasting period (Table 2). Furthermore, the feed intake (FI) and the metabolizable energy intake (MEI) during the feeding period were reported as the daily average was 0.130┬▒0.017 kg/bird and 720┬▒85 kJ/kg0.75, respectively. Roosters under ad libitum feeding consumed 14.54% more O2 and produced 14.52% more CO2 during the light (06 AM to 09 PM) compared to the dark period (10 PM to 05 AM). The triggered reduction of HP was 83 kJ/kg0.75/d during the resting (Figure 3B), and a decrease in 65% of PA, from 0.367┬▒0.26 to 1.059┬▒0.77 mV/min of the dark to light period (Figure 3C). On the other hand, the RQ was close during the darkness and light period (0.850 vs 0.856).
The metabolic measurements during the fasting period were low (p<0.01) to VO2 (ŌłÆ10.3 L/kg0.75/d), VCO2 (ŌłÆ9.94 L/kg0.75/d), and RQ (ŌłÆ0.055) compared to the ad libitum feeding (Figure 3A). Also, the result shows a reduction in metabolic HP of 34.5% for the fasting conditions compared to the feeding period (p<0.01) (Table 2).
The metabolic rate declined after feed deprivation, which significantly fits the segmented model (Figure 3A). The data demonstrate a linear reduction of HP (U = 10.7), starting on the feed withdrawal up to 11.7 h (R) of fasting. After which, the HP reached the plateau-FHP (386.37 kJ/kg0.75/d). The RQ associated with the plateau-FHP obtained was 0.751┬▒0.018.
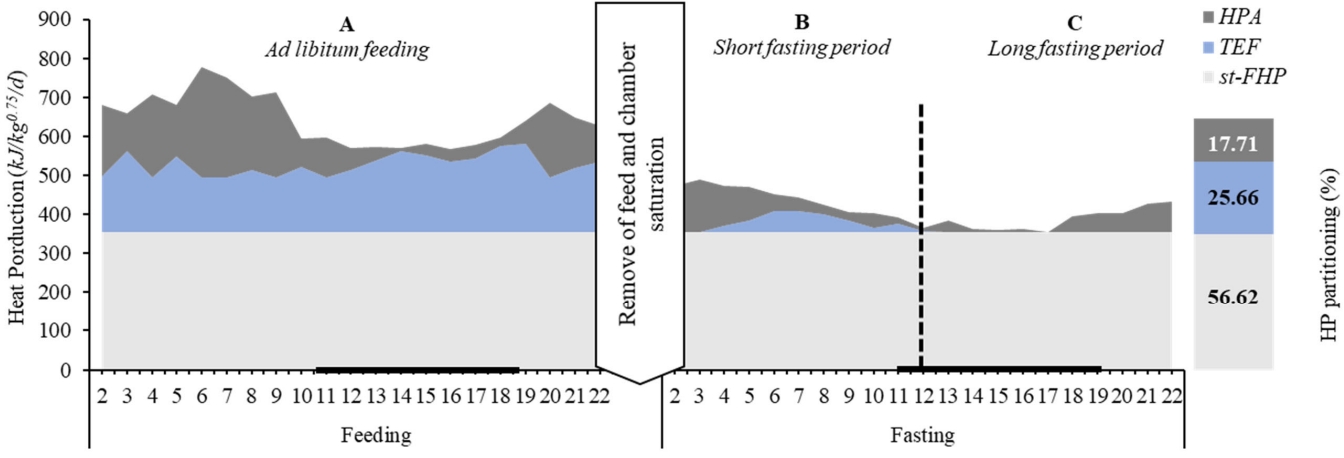
Based on the average of HP reported along the measurement periods investigated herein (Table 2; Figure 3), the events (A, ad libitum feeding; B, short fasting; and C, long fasting periods) and HP components are illustrated in Figure 4. When the roosters had free access to the feed (A), all HP components varied along the day. These variations were affected by the lighting and feeding process at each time. Sequentially, the roosters under a short fasting period (B) demonstrate a reduction in HP, where TEF was most affected by feed restriction and a lesser extent, by PA reduction. In a long fasting period (C), the HP has been constituted by the st-FHP and HPA. The linear regression model estimated the PA effect on total HP (p<0.01) between energy expenditure per unit of movement at 4.52 kJ/mV (╬▓1), and the st-FHP was calculated as the intercept (╬▓0 = 354 kJ/kg0.75/d) (Figure 3).
Two different values that describe the basal metabolic rate could be contrasted. The plateau-FHP was estimated from the broken-line model on the plateau phases after a long fasting period. Moreover, the st-FHP was estimated, considering the PA and isolating their effects. The st-FHP was lower (ŌłÆ42 kJ/kg0.75/d) than plateau-FHP.
With the result of previous calculations, was calculated the values of metabolizable energy (ME) partitioning in heat increment (described for this proposed as TEF+HPA, 275 kJ/kg0.75/d), 386 kJ/kg0.75/d of NEm (or st-FHP), and 59 kJ/kg0.75 of retained energy (NEp). Also, the energy efficiency of utilization was
61.85 % ŌĆē ( NE = ( NE m + NE p ) ME )
On average, the energy cost observed for a rooster is described as 56.6%, 25.7%, and 17.7% to st-FHP (386 kJ/kg0.75/d), TEF (159 kJ/kg0.75/d), and HPA (116 kJ/kg0.75/d), respectively (Figure 4).
DISCUSSION
Describing the partition of HP in roosters could be helpful to understand better the feed energy utilization and establish the bird's requirements [12ŌĆō14]. Therefore, this study shows the energy utilization of roosters to describe better HP partitioning and determine the maintenance requirement.
Indirect calorimetry parameters in laying breed roosters are rarely reported. A pioneering study in fed male broiler breeders reports similar results for gas exchange parameters than we found, 33.85 of O2 consumption and 34.87 CO2 productions (in L/kg0.75/d) [15]. In contrast, Barnas et al [16] conducted a study on laying cockerels reporting similarities with our findings and a slight reduction compared with meat-type breeders for VO2 (32 L/kg0.75/d) and VCO2 (27.68 L/kg0.75/d). Otherwise, a wide variation on the RQ is reported in the literature for poultry under fed conditions. In this sense, lower values of 0.86 were reported for laying breeders [16] and higher values close to 1.03 [15] in male broiler breeders. Conceptually the RQ is related to the oxidation rate depending on the substrate [17]. Also, in ad libitum fed animals, the RQ is close to 1 [1].
Additionally, the amount and frequency of feeding influenced this value [18]. In this way, broiler breeders present high FI (around 0.163 kg/bird) and a higher frequency of feeding as reported by Fuller et al [15], inducing heavy-fatty chickens, higher compared with male laying breeders [19] and besides higher values of RQ. Also, O'Neil et al [4] describe a wide variation in the RQ in fed roosters with different levels of a single diet and the same BW (around 2.5), varying from 0.814 to 1.050. In recent studies conducted by Liu et al [20] in broiler breeders to evaluate different diets ranging in their chemical composition with the same ME (12.96 MJ of ME/kg) and same FI (0.239 kg/bird), the authors observed no difference in the RQ (average of 0.96). The RQ variation is more related to the amount of FI (affected by the circadian rhythm) and the strain of the chickens (differentiated by the body composition).
Even with these variations in the RQ, Fuller et al [15] and Barnas et al [16] reported the same daily HP per unit of metabolic BW compared with our results, between 661 and 698 kJ/kg0.75.
In the continuous measurement of HP throughout the day, many random factors are a source of variation, like crowing [21], spontaneous PA [22], behavior states [23], and principally by the circadian cycle regulation and photoperiod [24]. Since HP is a dynamic phenomenon that constantly changes per unit of time, the calculations in short-time trials can result in noisy data [1]. The variation in HP is governed primarily by the locomotion activity induced by the light program [24]. Gleeson et al [9] reported relative reduction for the gas exchange parameters during the resting, beginning 0.3 and 0.92 L/kg0.75/d lower for VO2 and VCO2, respectively. That produced a numerical (non-significant) reduction in the HP with around nine kJ/kg0.75/d of difference between light and dark. Also, no difference was shown for the RQ, with an average reported of 0.930. On the other hand, Caldas et al [13] showed that female broiler breeders presented a significant variation in the gas exchange parameters affected by the light program adopted, reporting reductions of 27% (from 23 to 16.9 L/kg0.75/d) and 30% (from 21.9 to 15.4 L/kg0.75/d) for VO2 and VCO2, respectively.
We observed intermediate values than Gleeson et al [9] and Caldas et al [13], keeping a reduction of 15% during the dark period for both gases. Also, we showed a decrease of 65% in the locomotion of the roosters during the resting period.
Energy utilization (NE/ME) efficiency was reported at around 63% [25] for cockerels was closer than we found. The energy utilization in roosters is explained as the nutrient and energy intake destined mainly for maintenance (around 53.61% of ME). Also, a small fraction will be retained as lipid or turnover tissue (NEp around 8.24% of ME), making energy use by mature and non-productive animals less efficient.
The FHP determination depends on the methods used to estimate HP extrapolation at zero MEI [20] or submit the animals for a long time of fasting [8]. Also, the HP measurement under fasting conditions is broadly accepted and used for farm animal trials. Still, it presents some limitations, like guaranteeing the resting state after a long-time feed deprivation [6,26]. Some studies used the minimum HP plateau value to express basal metabolism [27]. Nonetheless, the observation from the present investigation demonstrates a necessity to isolate the effect of FHP for zero PA. In this sense, PA control should be essential to measure and separate the HPA contribution from FHP. The evaluation of metabolic trail conditions, like chamber size, light program, and animal behavior, must be carefully accounted for and monitored to reduce the roosters' displacement inside the chamber. Considering the experimental conditions, PA variation is expected to decline, allowing a better plateau-FHP estimation, matching with the basal metabolic rate of roosters.
As explained, a simple way to estimate the FHP relies on identifying a low asymptote or plateau in the HP after feed deprivation [23]. Still, it needs mechanisms or conditions to guarantee the animalŌĆÖs inactivity as much as possible [22]. Nevertheless, it is essential to know how much time the roosters need to be fasting to express the plateau-FHP. Noblet et al [8] mentioned that six hours after the last meal plus eight hours of feed deprivation is insufficient for young chickens to reach the plateau of FHP. Furthermore, Zubair and Leeson [27] obtained a constant minimum value of HP for 17-d-old chicks submitted to fasting between 24 to 36 h. Similar results were reported by Liu et al [18]. The latter found a constant RQ (0.65 to 0.75) between 12 and 36 h of fasting for broiler chickens. In our study, a plateau in the HP was observed after 11 h of fasting, therefore reaching the plateau-FHP; however, a longer time (24 h) of fasting might be necessary to achieve a reliable estimate of plateau-FHP [8].
As observed in this study, the plateau-FHP value was higher than st-FHP because even in fasting conditions, the PA effect increased the plateau-FHP estimation. Thus, they denote the importance of accounting for the bird's PA when estimating the basal metabolic rate.
The st-FHP obtained herein was close to that obtained by Rabello et al [25] (360 kJ/kg0.75/d) in broiler breeders, O'Neill et al [4] (308 kJ.kg0.75/d) in cockerels, and Johnson and Farrell [28] (359 kJ/kg0.75/d) discounting the PA effect. Thus, the slight difference between FHP found in literature is probably due to genetic variation and the methodologies applied to estimate the HP [1].
The TEF has low variation compared with the HPA, and it is mainly affected by the frequency of feed consumption and feed behavior, influenced by the light program when the bird has free access to feed [24].
The HPA fraction has more variation, which causes more noise in the trials of HP measurements. Still, it can be stimulated by the feeding period, light program, and other disturbances like crowing due to normal rooster behavior [21]. This fraction is more expressed during the feeding period. Still, it is not feasible to isolate this effect because it is combined with the feeding and the metabolic cost involved in the ingestion and digestion process.
The HP partitioning result was similar to van Milgen et al [26] reports on broiler chicks and Rivera-Torres et al [29] on growing turkeys. These studies partitioned the HP into three components, including heat increment related to the thermic effect of feeding (about 17% to 31% of total HP), FHP (around 52% to 29%), and HPA (17% to 23%), respectively.
In conclusion, the heat production partitioning into the FHP, TEF, and considering the HPA effect for each component improve the interpretation data of energy utilization in laying roosters. The FHP represents the major fraction of energy cost, followed by the TEF depending on the quantity of FI and chemical characteristics. Also, PA has a considerable impact on energy expenditure measurements. Therefore, more accurate maintenance regimes could be developed by PA measurement and quantification and their corresponding energy cost.
 PDF Links
 PubReader
 ePub Link
 Full text via DOI
 Download Citation
 Print
Print


