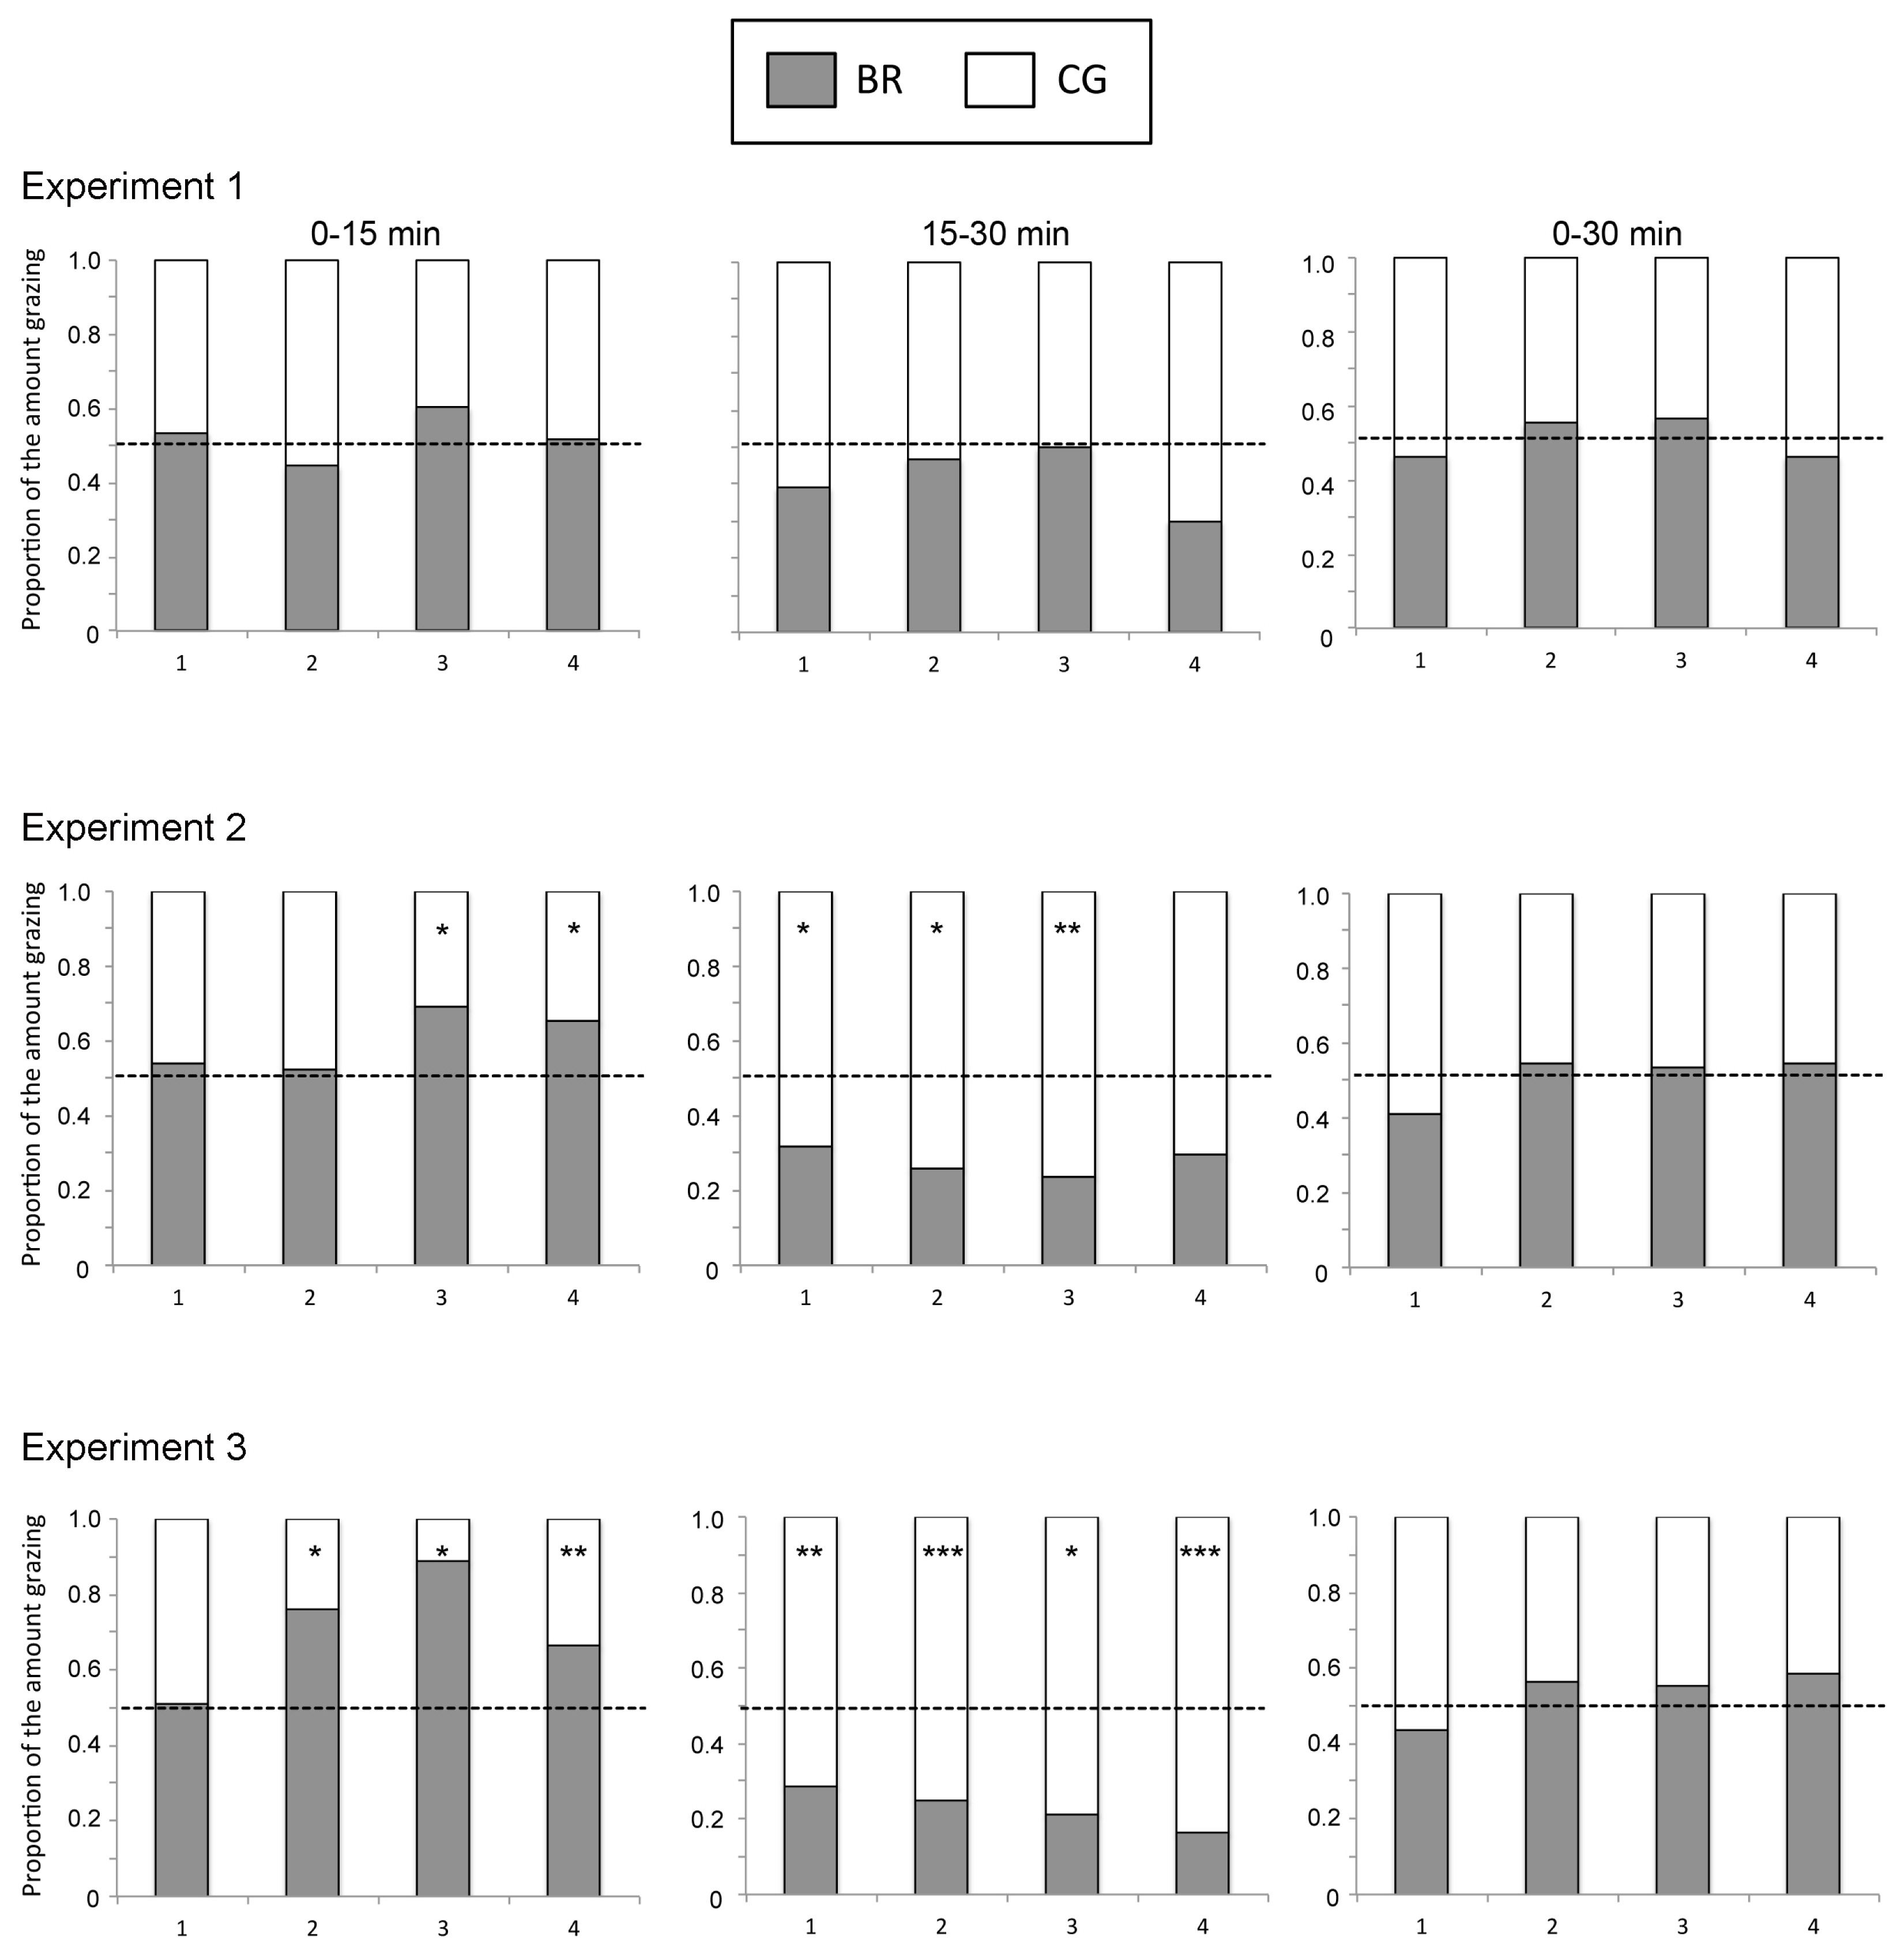
The followings are to be changed in Figure 2 and 3 of Asian-Australas J Anim Sci 2018. Vol 31, No. 5 : 748–754.
Figureآ 2
The chronological change for the proportion of time spent grazing ruzigrass tetraploid strain (BR, open columns) hay and Rhodes grass (CG, hatched columns) hay by cattle. The broken lines indicate the proportion of the amount of hay fed with the two grasses (BR:CG = 0.5:0.5). X-axis (1, 2, 3, 4) indicate experimental day. * Indicates a significant bias from the hay fed proportion at p<0.05. BR, Brachiaria ruziziensis; CG, Cloris gayana.

Figureآ 3
The chronological change for the proportion of grazing amount of ruzigrass tetraploid strain (BR, open columns) hay and Rhodes grass (CG, hatched columns) hay by cattle. The broken lines indicate the proportion of the amount of hay fed with the two grasses (BR:CG = 0.5:0.5). X-axis (1, 2, 3, 4) indicate experimental day. * indicates a significant bias from the hay fed proportion at p<0.05. BR, Brachiaria ruziziensis; CG, Cloris gayana.


 PDF Links
 PubReader
 ePub Link
 Full text via DOI
 Full text via PMC
 Download Citation
 Print
Print


