INTRODUCTION
Responses to directional selection and inbreeding in populations of species usually follow the regular patterns predicted by quantitative genetics theory (Falcorner, 1981). The heritabilities of most economical traits in pigs were considerable ratios (Hermesch et al., 2000; Hanenberg et al., 2001; Chen et al., 2003) for seed stock companies and farms to improve genetically their stocks through selection. However, many farmers with relatively small herds in Korea often hesitate to invest in genetic selection and instead import pigs from other countries. There are also fears of decreased performance in selection programs due to inbreeding depression and poor selection. Nevertheless, a number of adverse effects in response to the reckless import of pigs from various countries have been reported. For example, imports lead to introduction of pathogens to herds and decreased uniformity, which results in economic losses that greatly offset the benefits of any new genetic sources (NIAS, 2013). However, continuous genetic progress within a herd without importation of genes requires a proper method for evaluation and selection of pigs. Therefore, the present study was conducted to investigate factors related to selection in a closed population of a farm in full operation.
MATERIALS AND METHODS
Closed herd and records
In 2003, an experimental herd of Berkshire pigs was established in Sancheong (Korea) by the Swine Research Institute of Gyeongnam. The starting group of animals, which was imported from the United States, consisted of 20 boars and 83 sows with pedigree information. After its inception, the herd was kept closed. Breeding plans were developed with overlapping generations, and the entire animals were put on-farm testing. The records from 5,845 pigs and 822 litters, including pedigree information of 49 sires and 214 dams, were used for analysis. The sires and dams were mated with the aid of a software (Do, 2003; C-don Manager: A program for recording and managing seed stocks) that computes the selection index and inbreeding coefficient of hypothetical offspring. The index for selection on breeding values included days to 90 kg (D90kg), backfat thickness (BF), and number of piglets born alive (NBA). Most mating was practiced using offspring with an inbreeding coefficient of less than 3%. The pigs had ad libitum access to water and feed (standard scheme), in keeping with the practice in most farms in Korea. The traits measured in age cohorts were BF (mm), D90kg (day), and average daily gain (ADG) (g), which were used to estimate genetic progress. BFs were measured at 5-cm from the edge of the split back at the levels of the third, fourteenth, and fourth last ribs using a Piglog 105 device (Carometec A/S, Copenhagen, Denmark) and adjusted for a body weight of 90 kg. ADGs were measured from birth to the end of the performance test (about 145 age days). Details regarding the structure and selection of the herd are presented in Figure 1 and Table 1.
Population
The barns and facilities were newly built for the herd. The effects of the new building and facility might disappear in few years, mask selection response, and be confounded with annual effects in general. Selection was practiced for a relatively short period when compared with the previous studies (Rodrigáñez et al., 1998; Silió et al., 2013). Figure 1 shows the structure of the population according to birth year and month. Approximately 100 sows and 20 boars were maintained in the herd at all times, which produced about 1,600 pigs annually. A beginning herd requires time to fill the pens with newly born piglets, and it took a little over a year to reach normal herd size. The average herd size was approximately 800 pigs, excluding sires and dams, with a peak size of about 1,200 heads being attained in 2005. The newly built barns and short period of selection may not be suitable for selection experiments, but could help identify problems associated with ordinary seed stock farms.
Statistical analysis
Simple statistics and figures were obtained using a statistical package (SAS, Cary, NC, USA) and a database tool (Sybase PowerBuilder Enterprise, Sybase Inc., Dublin, CA, USA). Genetic parameters and breeding values were analyzed with the restricted maximum likelihood (REML) procedure based on an animal model using the Wombat program (Meyer, 2010). The statistical model for the traits was as follows.
Where yi is the vector of observations for the ith trait, and bi is the vector of fixed effects, including contemporary groups, such as birth year-month, sex and dam parity or farrowing year month and sow parity. For random effects, ai is the vector of random animal effects and ei is the vector of random residual effects. X and Z are incidence matrices relating records of a trait to fixed effects and random effects.
If a represents the vectors of animal genetic effects for traits, and e represents the vector of residual effects, then the random effects can be assumed to follow a normal distribution with a mean of zero and the following distribution parameters:
where, A is the numerator relationship matrix and G is a matrix with an order of 4, the covariance matrix of the genetic effect between traits. Matrix I is the identity matrix of appropriate dimension in each case, and R is the covariance matrix of residual effect. ⊗ denotes Kronecker product of matrices.
RESULTS AND DISCUSSION
Selection
Selection criteria were based on the rank of the selection index of hypothetical progeny of available sires for a dam. The selection index was calculated with breeding values and economical weights of traits. New breeding values were obtained from routine genetic evaluation of the traits for each performance test of an age cohort. Index weights on breeding values of ADG (g), BF (mm), and NBA (head) were 0.22, −2.58, and 58.70, respectively.
Selection at operational swine farms differs from selection of plants (Shaw and Sacks, 1995) and fruit flies (Bubliy and Loeschcke, 2005) in the laboratory, in which the results of selection including inbreeding coefficients and selection response are consistent with quantitative genetics. Selection of pigs for replacement or sale at farms in operation is practiced using both performance tests and genetic evaluation, if possible. The number of pigs to be selected is determined by the need for new breeding stocks and the superiority of candidates. Hence, selection intensity is continuously changing.
The sows with low rank of selection index comparing with candidates were culled after weaning their piglets. And the new young candidates for replacement waited for about two months to be mated after selection. That is, 5 month old gilts competed with the existing sows, which had mated two months previously and were pregnant. This selection scheme allowed a stable flow in production of pigs, but selection criteria changed continuously with selection intensity. Selection response and inbreeding coefficients were calculated from the average of individuals in the herd. Some of the pigs were selected and sold to multiplication farms (Table 1). In 2003, 5.7% and 14.6% of pigs were selected for the replacement of sires and dams, respectively. These rates gradually decreased every year, and thus sires and dams were selected upper 1.4%, 1.3%, and 1.0%, and 6.4%, 4.4%, and 2.8% of pigs with birth year 2004 through 2006, respectively. However, the percentile of dams did not mean absolute top ranking as previously mentioned about selection of gilts.
Changes in phenotypic values of the traits are shown in Table 1, and the selection differentials in the observed scales were provided. The selection differentials on BF in birth year 2003 through 2006 were −0.9, −2.4, −1.4, and −1.3 mm, respectively, for sires and −0.2, −1.3, −0.1, and 0.8 mm, respectively, for dams. However, the means phenotypic values of parents were about equal or even larger than the means of the population born in previous year. It indicated that breeding values of BF and the economical weight for BF did not give progress in phenotypic values. Further Figure 2 showed the results of no improvement in breeding values of BF. The observed means of ADG in 2003 indicated fast growth of pigs, and low means in 2005 and 2006 were recovered in 2007. The selection differentials (difference in parents from population) on ADG in birth year 2003 through 2006 were 19.5, 32.8, 76.1, and 58.4 g, respectively for sires and 1.5, 6.4, 58.7, and 32.4, respectively, for dams. The newly built pens were clean and spacious; thus, pigs were raised under low levels of pathogen infection and low density. Gonyou and Stricklin (1988) pointed out that individual pig productivity decreases as crowding increases, but productivity in farms may increase, improving the economics (Edwards et al., 1988; Powell and Brumm, 1992). It was assumed that the new building effects greatly influenced performance of animals in 2003 and 2004, during which time herd size increased gradually (Figure 1). Further, the influences masked continuous genetic progress and typical selection response. The phenotypic values of BF were increased for sires, dams and population.
Bulmer (1971) showed that the contribution to linkage disequilibrium in additive genetic variance decreased under selection. It could be evidence of selection effect that could reduce additive variation and subsequently could reduce phenotypic variation. However, phenotypic variations in the traits shown in Table 1 were not reduced by selection during the study period, possibly due to the short period and selection of three traits. Significant reductions in variance under selection requires many generations of selection or directional selection of a trait expressed by few loci (Jacquard, 1974).
Genetic progress
The heritabilities of BF, D90kg, ADG, and NBA estimated in the previous study (Do, 2007) were 0.29, 0.43, 0.45, and 0.23, respectively (Table 2). Cassady and Robison (2002) showed that heritabilities of backfat thickness, days to 230lb and ADG were 0.50, 0.25, and 0.30, respectively. The estimated growth traits obtained by Cassady and Robison (2002) (days to 230lb and ADG) and Do (2007) (D90kg and ADG) were similar, but the estimates in Table 2 were different (0.15 or more) and low, especially for BF (Cassady and Robison, 2002; Imboonta et al., 2007). Most reproductive traits are lowly heritable since environmental and other factors have significant effects on the traits (Imboonta et al., 2007). However, the heritability of NBA was high relative to previous studies (Chen et al., 2003; Johnson and Nugent, 2008; Savić et al., 2011). These findings indicated that the records from the same herd reduced environmental and erroneous effects, which resulted in high heritability in reproductive traits in the present study.
A genetic correlation between traits results in a correlated response to selection (Falconer, 1981). The trait of D90kg had values of opposite direction with ADG and a genetic correlation of −0.98. Body weight and BF tend to increase or decrease together. The genetic correlation of ADG and BF showed a positive value of 0.13, which differed from a study conducted by Imboonta et al. (2007), in which the value was −0.03. The genetic correlations of NBA with production traits were unfavorable and low, which differed from the favorable genetic correlations reported by Imboonta et al. (2007). The genetic parameters in Table 2 were estimated in the early stage of the population and used to develop the selection index as previously described. The genetic correlations in the present study did not appear to be extraordinary, even under selection.
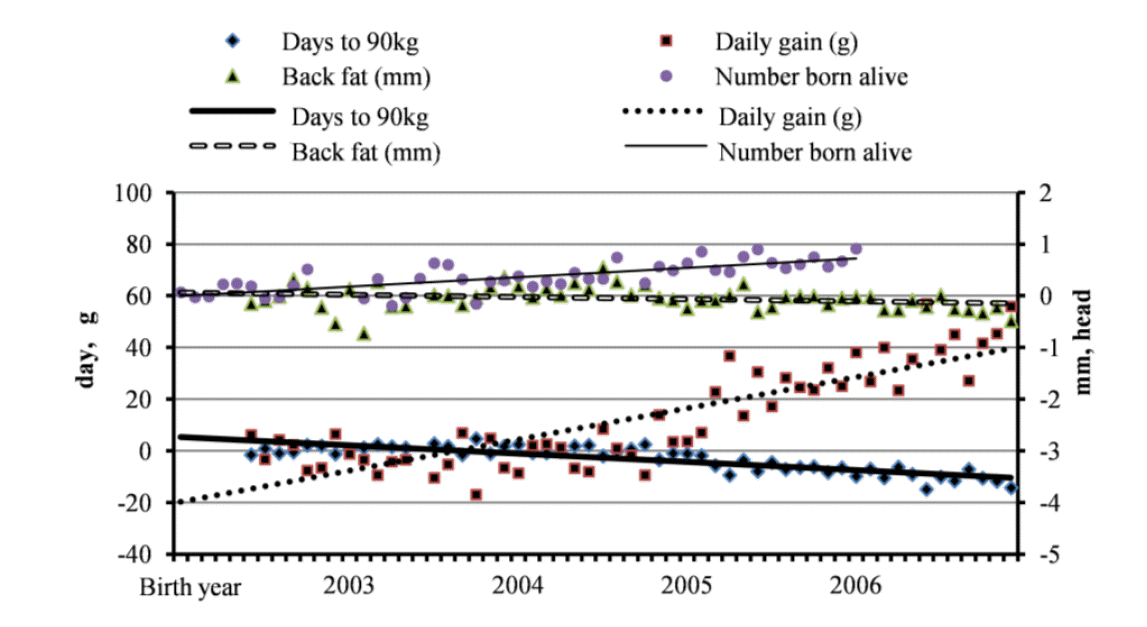
The breeding values of pigs were estimated using an animal model that took selection and non random mating into account (Kennedy et al., 1988). The numbers of pigs according to birth year month are shown in Figure 1. The average breeding values of the pigs with the same birth year month varied to some extent, as shown in Figure 2. Since breeding values were obtained by removing environmental and residual effects, average breeding values of the traits showed actual responses by selection over years. Consequently, the average breeding values of the traits over birth years could be traces of genetic progress reflecting aggregate breeding values in the herd.
The average breeding values of dams instead of the entire herd are shown for NBA in Figure 2. The average breeding values obtained for ADG for 2004 and 2005 were lower than those obtained in other years. The reason for this was not apparent, but these low values followed by continuous increases caused curves reflecting the average changes to have a bent shape. With the exception of ADG, the trends of other traits were linear. The traces in population under selection ran toward the breeding goals, as intended with the selection index. The equations describing the linear trends for BF, ADG, D90kg, and NBA in Figure 2 are shown for the herd in Table 3.
Gradients in breeding values during the period of selection were obtained for sires, dams and the herd, with regressions (Table 3). Annual changes were calculated by multiplying 12 months by monthly changes (regression coefficients). The changes of breeding values per year in parents (the averages for sires and dams) were 14.6 g, −0.13 mm, and −3.84 days for ADG, BF, and D90kg, respectively. Since Mendelian sampling contributions by heredity are summed as zero, the expected genetic response in the offspring is simply obtained by substituting the average of the parental breeding values in theory (Hill and Weir, 2011). However, as shown in Table 3, the changes in parents and the response of the herd were not the same. The gradients in parents were the intended selection differential by the breeder, whereas the gradients in the herd were due to selection. The percentages in Table 3 showed the portion of actual gain in the population from intended gain by selection of parents, and obviously represented selection efficiency in a sense. The proportions of ADG, BF, and D90kg in the herd were 82.6%, 31.7%, and 82.9%, respectively. The realized portion in NBA could not be obtained because litter records were only available for selected dams. The values were higher for growth (D90kg and ADG) than for leanness (BF). Unlike other traits, the average breeding values of BF fluctuated for a relatively long period (Figure 2). This may have been due to the low economic weight on BF relative to other traits. The large variations in breeding values of BF in 2003 and 2004 may have caused the low R-square of the regression and played a role in generation of the low selection efficiency.
The increases due to selection in parents were consistently larger toward the directionality of selection than those of the herd including offspring and parents. Accuracy is a measure of the standard error (SE) of prediction of an individual breeding value (Henderson, 1975) rather than the correlation between true and estimated breeding values in selected populations (Bijma, 2012). In general, additive genetic values of parents are more accurate than those of offspring, possibly due to differences in the changes. As shown in Table 1, the selection intensity for replacements increased rapidly. Selection differentials in parents to be selected also increased, but could be realized in offspring after a period of time, which might be a source of the differences. The gradients in breeding values of parents were always favorably large relative to those of the herd. If enough generations passed, the changes (gradients) of both parents and the herd could be very similar.
The changes in the breeding values per year in the herd were 12.1 g, −0.04 mm, and −3.13 days. The ADG was much higher than compared to previous studies (McKay, 1990; Hofer et al., 1992; Ferraz and Johnson, 1993). Genetic reductions in BF were similar to those reported by Kaplon et al. (1991), but much lower than that of −0.18 mm/yr reported by Hudson and Kennedy (1985). The low selection response in BF could be characteristic of the Berkshire breed, which generally has thicker backfat than white pig breeds (Do, 2007). Interestingly, the selection differential of the sires was greater than dams for NBA. The genetic gain of NBA in dams was 0.181, which was higher than 0.118 in Landrace and Large White pigs (Ferraz and Johnson, 1993). Even though economic weights on the traits, selection intensity, and genetic correlations among ADG, BF, and NBA primarily determined the results of selection, it is believed that the high responses for ADG and NBA in the present study were partly due to the low average genetic ability of the Berkshire breed (high margin for improvement).
Inbreeding
Inbreeding is defined as the probability of two alleles within an individual being identical by descent (Curie-Cohen, 1981). This phenomenon is unavoidable in small populations without introduction of new pigs (Falcorner, 1981), and is therefore a major concern to pig producers during selection. In the present study, mating plans were made with the aid of computer software, which limited inbreeding coefficients to below 0.03 whenever possible. Securing a sufficient number of sires relative to sows enabled maintenance of relatively low average inbreeding throughout the experiment. The ratio of sires to dams (1 to 5) was relatively low when compared with the ordinary seed stock farms in Korea. All pedigree information was used for computation of inbreeding coefficients, even though the ancestries beyond the grandparents of the founders were not available. As shown in Table 4, the average inbreeding coefficients from 2003 to 2007 were 0.023, 0.008, 0.013, 0.025, 0.026, and 0.005, respectively. The proportion of animals inbred increased rapidly, but the average inbreeding coefficients did not. The annual increase of inbreeding coefficients in the herd was 0.23% when 2007 was excluded from the calculation. Inbreeding itself was completely controlled by computer aided mating and inbreeding in 2007, during which time it decreased to 0.5%.
Increased homozygosity leads to inbreeding depression if the recessive alleles are detrimental. Increased homozygosity can also affect the breeding values through the average effects of gene substitution (Falconer, 1981), which consist of both dominance and additive effects. The records of inbred pigs were used to investigate the relationship between inbreeding and breeding values of the traits (Table 5). No breeding values of the traits were significantly correlated with inbreeding coefficients, except for NBA (correlation = −0.21). Inbreeding rarely affected breeding values of growth traits, and regression of the breeding values of NBA against the inbreeding coefficients was significant. The response per additional 1% of inbreeding was 0.0278 head reduction of breeding value in NBA. Rodrigáñez et al. (1998) also found a significant mean reduction of 0.27 piglets born and 0.39 live born for each 10% of litter inbreeding. Falconer (1981) stated that inbreeding depression exists to some degree in all populations, and it has often been observed in reproductive and fitness traits.
The results of the present study indicated that the number of boars was sufficient to keep inbreeding under control, even though the herd was closed. As shown in Table 3 and 4, the gain per year in NBA and inbreeding were 0.181% and 0.23%, respectively. If the inbreeding coefficient was converted to NBA, then a reduction of 0.0064 head occurred in the herd. This reduction due to inbreeding depression could be disregarded relative to the gain of year (0.181) in NBA, suggesting that inbreeding and inbreeding depression could be controlled with proper breeding schemes and were economical and safe relative to the risks associated with importation of pigs from various countries.
IMPLICATIONS
The results of this study indicate that inbreeding can be controlled and significant genetic progress in both production and reproduction traits can be obtained by a proper selection scheme, even in a small closed population. Therefore, import of seed stocks into farms should be prevented to avoid undesired pathogens and achieve uniform pig populations.



 PDF Links
 PubReader
 ePub Link
 Full text via DOI
 Full text via PMC
 Download Citation
 Print
Print