


INTRODUCTION
Cheese is one of the most popular foods globally. The International Dairy Foods Association (IDFA) reported in 2010, that cheese is the major manufactured dairy product, and that its importance for the dairy industry has grown remarkably. The consumption of cheese has been increasing gradually since the 1990s (Kim et al., 2007). However, some cheese is occasionally contaminated with food-borne pathogens such as Listeria monocytogenes, Staphylococcus aureus, and Escherichia coli (E. coli, Thayer et al., 1998; Kaan Tekin┼¤en and ├¢zdemir, 2006; Jo et al., 2007).
E. coli, a facultative anaerobic gram-negative bacillus, is commonly found in the intestinal flora of man and animals, and certain strains are pathogenic (Olsvik et al., 1991). Pathogenic E. coli strains are classified by infection and pathologic mechanism: enteropathogenic E. coli (EPEC), enteroinvasive E. coli, enterotoxigenic E. coli (ETEC), enterohemorrhagic E. coli (EHEC), and enteroaggregative E. coli (EAEC) (Nataro and Kaper, 1998). Recently, there have been reports from many countries, regarding the isolation of E. coli from various cheeses (Haran et al., 2012; Zinke et al., 2012). Moreover, several outbreaks of E. coli infections, related to cheese, have been reported (FSN, 2010). Therefore, several countries have a quantitative standard or ŌĆ£zero toleranceŌĆØ policy for controlling pathogens in cheese (Health Canada, 2008; FDA, 2009).
Predictive models can be used to determine how intrinsic or extrinsic factors affect or interact with growth parameters (Lihono et al., 2003). Moreover, they can predict the growth or survival of bacteria in accordance with a diverse range of parameters, such as storage temperature and storage time (McMeekin et al., 1997). Storage temperature is a major factor for bacterial growth, and it can be changed continuously under various circumstances such as transportation, display at retail, and storage at home. Therefore, it is important to describe the growth kinetics of pathogens under dynamic storage conditions.
Although the growth of E. coli has been evaluated in raw milk and unpasteurized cheese using predictive models (Sutherland et al., 1995), the growth of pathogenic E. coli on cheese has not been studied, especially in response to varying temperature. Therefore, the objective of this study was to develop a mathematical model that describes the growth kinetics of pathogenic E. coli under constant and dynamic temperature conditions.
MATERIALS AND METHODS
Inoculum preparation
Five strains of E. coli, NCCP14037 (ETEC), NCCP 14038 (EPEC), NCCP 14039 (EAEC), NCCP 15661 (EPEC), and ATCC11142 (ETEC) were supplied from National Culture Collection for Pathogens. They were cultured in 10 mL of tryptic soy broth (TSB; Bacto, Becton Dickinson, MD, USA), and incubated at 35┬░C for 2 h. We inoculated 0.1 mL of each culture suspension into 10 mL of TSB for subculturing at 35┬░C for 24 h. After incubation, the subcultures were then mixed and harvested by centrifugation for 15 min at 1,912 g and 4┬░C. The cell pellets were thoroughly washed twice with phosphate-buffered saline (PBS, pH 7.4; 0.2 g/L KH2PO4, 1.5 g/L Na2HPO4, 8.0 g/L NaCl, 0.2 g/L KCl in distilled water), followed by serial dilution with PBS to obtain approximately 5 to 6 log CFU/mL.
Sample preparation and inoculation
Two commercial natural cheeses (Brie and Camembert; no antimicrobial included) and two processed cheeses (sliced Mozzarella and sliced Cheddar; no antimicrobial included) were purchased at a retail store. The natural cheeses were cut into 15 g portions, and transferred into sample bags. The surfaces of the cheeses were inoculated with 0.1 mL of inoculum at 3 to 4 log CFU/g. The cheese samples were then massaged to spread the bacteria, and sealed (Food Guard VP5700, Rollpack, Gyeonggi, Korea). In addition, 0.1 mL portions of inoculum were inoculated onto each slice (18 g) of processed cheese (Mozzarella and Cheddar), using a sterile bent spreader. The processed cheese samples were then covered aboriginally. Two samples were then placed in a plastic bag, and sealed, followed by storage at 4┬░C (1,320 h), 10┬░C (768 h), 15┬░C (120 h), 25┬░C (48 h), and 30┬░C (24 h).
Experimental growth analysis
Cheese samples were analyzed 9 to 16 times during storage, depending on the storage temperature. Thirty milliliter of 0.1% buffered peptone water (BPW; Difco, Becton Dickinson, MD, USA) was added to the natural cheese samples and the mixture was homogenized for 120 min in a blender (BagMixer; Interscience, France), while processed cheese samples were transferred into a filter bag (Sample bag, 3M, Korea), containing 30 mL of BPW, and blended for 2 min. The homogenates were then serially diluted with BPW. Aliquots (0.1 mL) of the diluents were surface-plated on tryptic soy agar (TSA; Difco) and MacConkey sorbitol agar (Mac; Difco) for determining total bacterial and E. coli counts, respectively. The plates were incubated at 35┬░C for 24 h, and the colonies were manually counted. The pH values of the homogenates were measured via a digital pH meter (Accumet, Denver Instruments, CO, NY, USA), and the water activity, aw, of the samples was determined by a water activity meter (Aquaspector, NAGY Messsysteme, G├żufelden, Germany).
Primary model
The E. coli growth data was fitted to the Baranyi model (Baranyi and Robert, 1994), using DMFit (Institute of Food Research, Norwich, UK) to estimate the maximum specific growth rate (╬╝max; log CFU/g/h), the lag phase duration (LPD; h), the lower asymptote (N0; log CFU/g), and the upper asymptote (Nmax; log CFU/g).
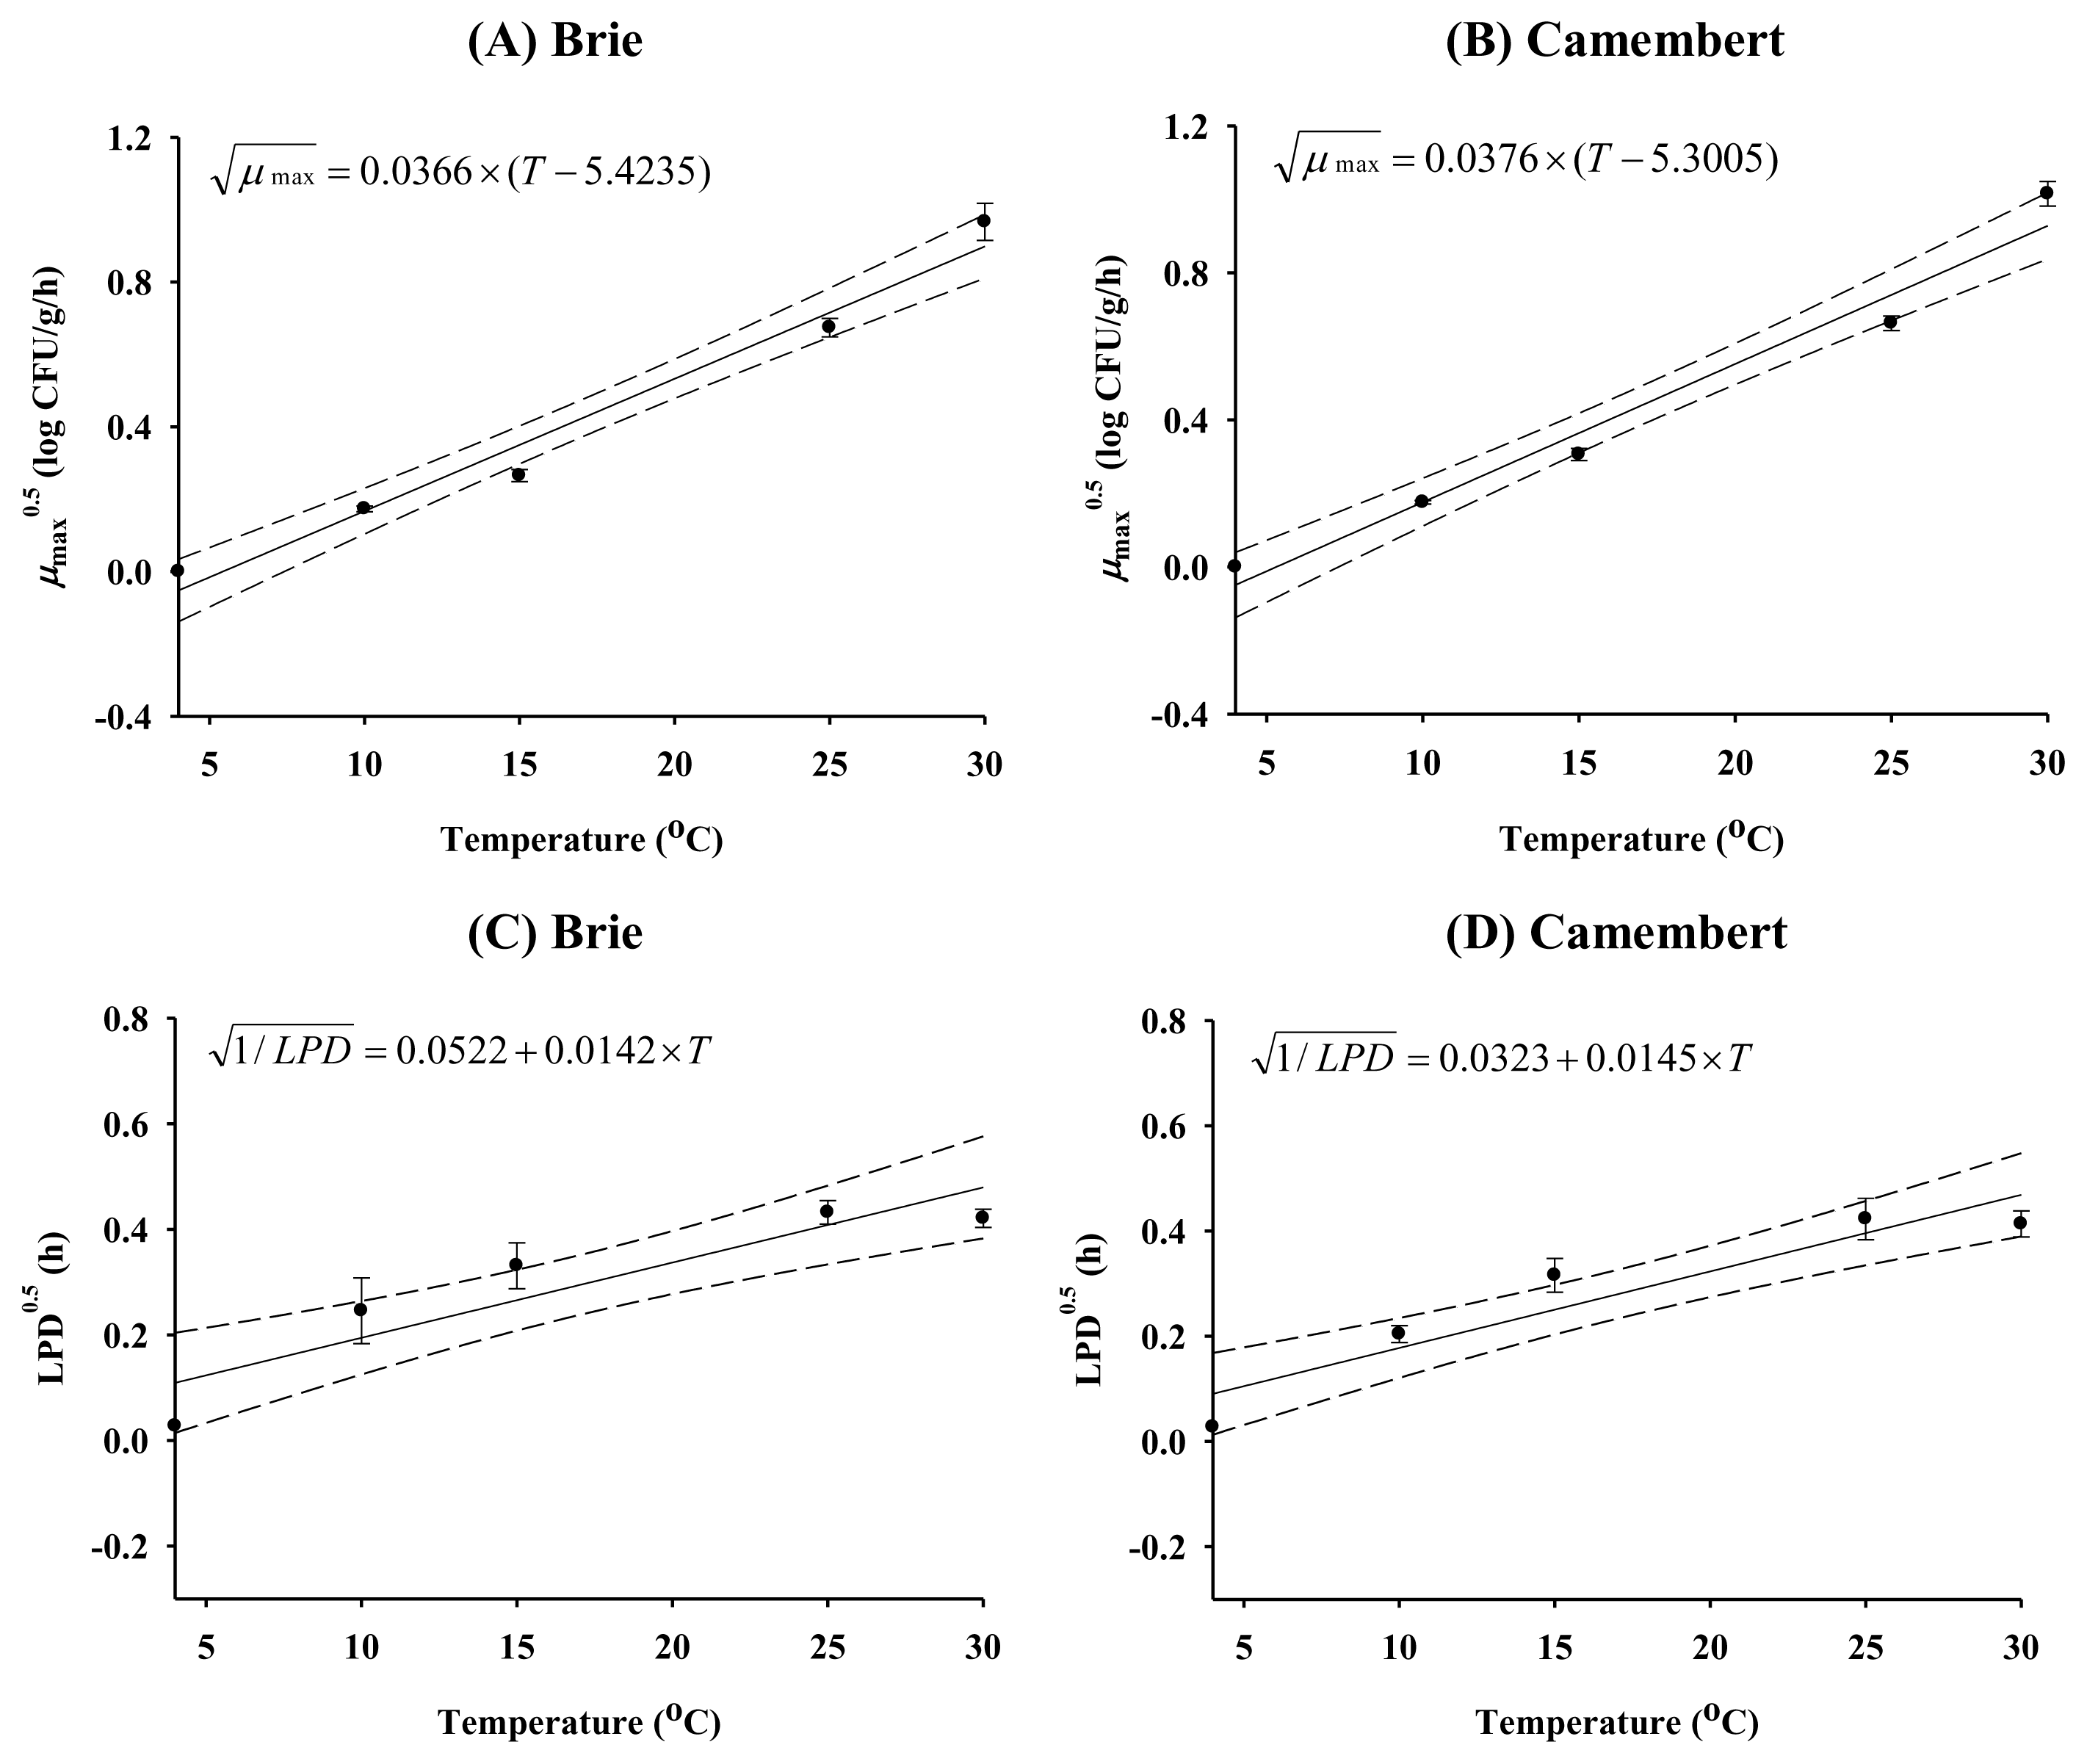
Secondary model
The kinetic parameters from the primary model were further analyzed as a function of storage temperature. The square root model and polynomial model were used for natural cheese and processed cheese, respectively, as follows:
where a╬╝ is the slope of the linear regression for the square root of ╬╝max and T is the temperature (┬░C). Tmin is the theoretical minimum temperature. ai is the coefficient of a polynomial equation. In addition, a linear equation was fitted to the square root of the inverse LPD for both natural and processed cheeses using the expression,
where aLPD are the slopes of the regression lines for the square root of the inverse LPD, and T is temperature (┬░C).
Validation
To validate the models, E. coli cell counts were obtained experimentally. These data were then compared with the predicted E. coli cell counts, which were estimated by our models. Subsequently, the root mean square error (RMSE) was calculated to evaluate the model performance as follows:
where n is the number of observations.
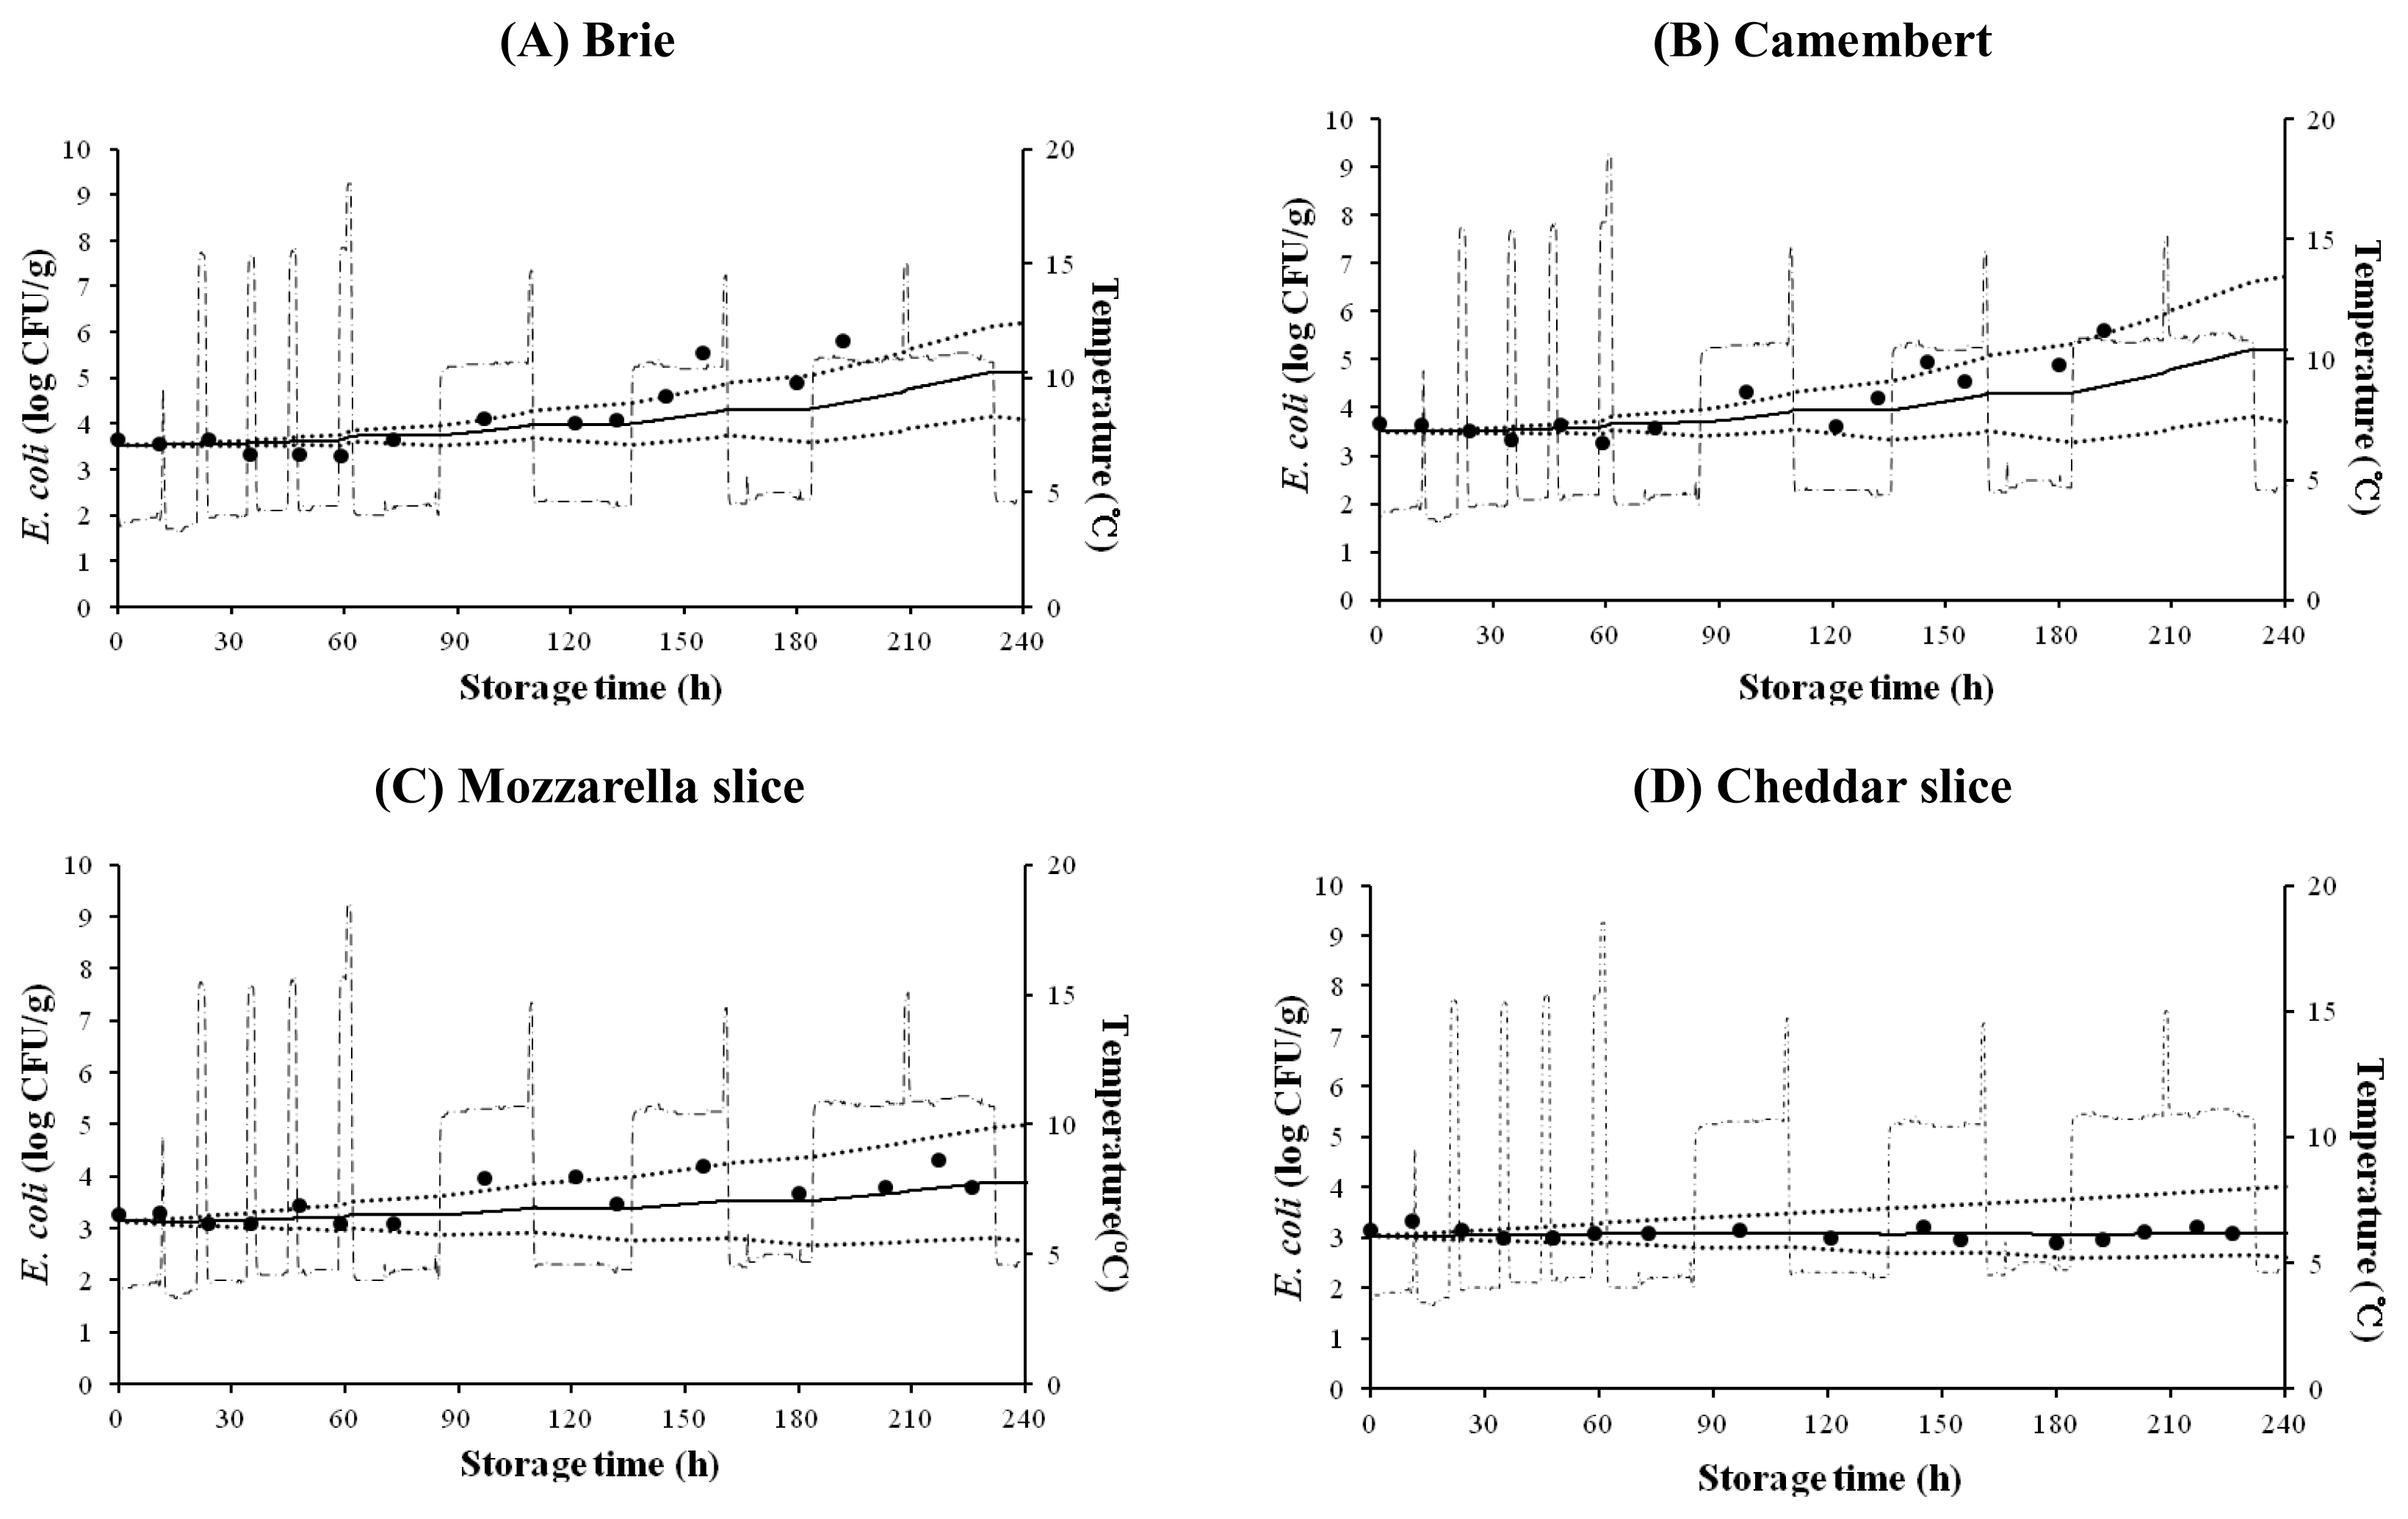
Dynamic model
A study by Lee et al. (2008) reported that the mean temperature and storage time in a retail store were 7┬░C (Tmin, ŌłÆ2┬░C; Tmax, 22.9┬░C) and 2 days, respectively, and that purchased cheeses were then transported in a car at 18┬░C for up to 1 h. In addition, Bahk (2010) showed that the mean temperature and storage time for a home refrigerator were 4┬░C (Tmin, ŌłÆ5┬░C; Tmax, 14┬░C) and 10 days, respectively. Therefore, E. coli populations were simulated by using the mathematical model defined by Baranyi and Roberts (1994) and a temperature profile based on the above studies (4┬░C to 14┬░C).
Statistical analysis
The experiments were repeated twice with two samples per repeat (n = 4). The growth parameters (╬╝max, LPD, N0, and Nmax) were analyzed using the general llinear model procedure of SAS version 9.2 (SAS Institute, NC, USA). Mean comparisons were performed by using a pairwise t-test with the criterion for significance set at p<0.05.
RESULTS AND DISCUSSION
pH values were similar for the four types of cheese and bacterial growth was not affected by pH (data not shown). E. coli growth was not observed for any cheese type at 4┬░C (data not shown). The processed Cheddar cheese showed E. coli growth at 15┬░C to 30┬░C, and the other cheeses had bacterial growth at 10┬░C to 30┬░C. LPD values decreased as the storage temperature increased (p<0.05), but no significant difference was observed between the cheeses (Table 1). ╬╝max values increased (p<0.05) when storage temperature increased, and the ╬╝max values of natural cheeses were higher (p<0.05) than those of the processed cheeses (Table 1). The aw values of Brie, Camembert, Mozzarella slice, and Cheddar slice cheese were 0.991, 0.987, 0.975, and 0.973, respectively. hus, these lower ╬╝max values of processed cheeses may have been caused by a lower aw (0.973 to 0.975), compared with those (0.987 to 0.991) of the natural cheeses. E. coli growth slows as aw approaches its minimum (0.950) (Aberoumand, 2010). The low aw of processed cheeses may be caused by evaporation during the heating process; NaCl concentrations were similar among the cheeses. In addition, the Nmax values were lower (p<0.05) in processed cheese than in natural cheese (Table 1). The R2 values of the primary models ranged from 0.918 to 0.998, indicating that the fit between the primary model and the E. coli growth data was appropriate (Table 1).
To evaluate the effect of storage temperature on kinetic parameters such as ╬╝max and LPD, secondary models were developed (Figures 1 and 2). When there was no growth of E. coli, e.g., at 4┬░C, ╬╝max was estimated to be zero, and the length of the storage period was estimated to be the LPD, which is the period of the time, showing no growth. The model predictions were close to the experimentally observed kinetic data, with high R2 values (0.890 to 0.994), indicating that the secondary models were valid for describing the effect of storage temperature on kinetic parameters.
To validate our model, predicted ╬╝max and LPD values were calculated via the secondary model at specific temperatures (18┬░C, 23┬░C, and 28┬░C). These predicted kinetic parameters were then used to predict E. coli cell counts at given storage times in accordance with the primary model. The predicted E. coli cell counts were then compared with the observed E. coli cell counts, which were obtained from our experiments. The RMSE values of Brie, Camembert, Mozzarella, and Cheddar slice cheeses, indicating the distance between observed values and predicted values, were 0.264, 0.218, 0.176, and 0.337, respectively., depending on the cheese. This result indicates that the model performance is adequate. The RMSE values for models by P├®rez-Rodr├Łguez et al. (2013) and Sk┼Öivanov├Ī et al. (2008) were 0.30 to 1.33 and 0.29 to 0.78, respectively, and this was considered adequate by the authors. Lee et al. (2012) concluded that their model was adequate with RMSE values of 0.326 to 0.361. Therefore, the performance of the model described by this study can be considered adequate.
E. coli growth on cheese was also simulated for changing storage temperatures. h0 values, which indicate the initial physiological state of bacteria (Grijspeerdt and Vanrolleghem, 1999) were calculated to be 1.816 to 2.074 for natural cheese and 0.549 to 0.874 for processed cheese (Figure 3). Although some experimental data were not very close to the predicted values, most data were within 95% confidence intervals. This result suggests that the dynamic models are useful for prediction of E. coli cell growth on natural and processed cheeses under dynamic temperature conditions.
In conclusion, the models developed in this study can be used to describe E. coli growth kinetics on natural cheeses (Brie and Camembert) and processed cheeses (sliced Mozzarella and sliced Cheddar). Such models could prove useful for exposure analysis in microbial risk assessment.

 PDF Links
 PubReader
 ePub Link
 Full text via DOI
 Full text via PMC
 Download Citation
 Print
Print


