Additivity of digestible energy and nutrient concentrations in hatchery byproducts fed to nursery pigs

Article information

Anim Biosci. 2022;35(3):453-460
Publication date (electronic) : 2021 June 24
doi : https://doi.org/10.5713/ab.21.0124
1Department of Animal Science and Technology, Konkuk University, Seoul 05029, Korea
2Animal Nutritional Physiology Team, National Institute of Animal Science, Rural Development Administration, Wanju 55363, Korea
*Corresponding Author: Beob Gyun Kim, Tel: +82-2-2049-6255, Fax: +82-2-455-1044, E-mail: bgkim@konkuk.ac.kr
Received 2021 March 13; Revised 2021 April 28; Accepted 2021 June 19.

Abstract

Objective

The objective was to test additivity of digestible energy and nutrient concentrations in the hatchery byproduct mixture fed to nursery pigs.

Methods

In the previous studies, energy, phosphorus, calcium, and amino acid digestibility of infertile eggs, unhatched eggs, culled chicks, and a mixture of 3 hatchery byproduct ingredients was determined in nursery pigs (initial body weight = 9.4 to 14.2 kg). An additivity test was conducted using these determined values.

Results

No difference was observed between determined and predicted metabolizable energy values in the mixture (3,998 and 3,990 kcal/kg as-is basis, respectively). Measured standardized total tract digestible phosphorus in the mixture was less than the predicted value (4.5 vs 5.3 g/kg as-is basis, respectively; p<0.05). Measured standardized total tract digestible calcium in the mixture was greater compared with the predicted value (40.0 vs 31.7 g/kg as-is basis, respectively; p<0.05). Measured standardized ileal digestible tryptophan in the mixture was greater than the predicted value (3.7 vs 3.1 g/kg as-is basis, respectively; p<0.05) whereas other amino acid values were additive.

Conclusion

Energy and most of amino acid concentrations in hatchery byproducts are additive in the mixture fed to nursery pigs.

INTRODUCTION

Additivity is the fundamental assumption when formulating diets using multiple ingredients. If a digestible energy (DE) value or a nutrient concentration in a mixed diet is equal to the proportional sum of DE values or nutrients from each ingredient, DE or nutrient concentration in the diet is regarded additive [1]. In layers hatchery facilities, infertile eggs, unhatched eggs, and culled chicks are regularly disposed of because only female chicks are economically valuable. These wastes from hatchery facilities are known as hatchery byproducts [2] and are regarded as alternative protein sources in nursery pig diets. A hatchery byproduct mixture could replace animal protein sources without compromising growth performance of nursery pigs [3]. For these reasons, the use of hatchery byproducts in swine diets would be both economically and environmentally beneficial. Generally, hatchery byproducts are pooled and then discarded together, but the ratio of each byproduct is not always constant.

An accurate nutritional evaluation of a feed ingredient is necessary for precise feed formulations [4,5]. To evaluate nutritional values of feed ingredients precisely, in vivo experiments with animals are required. However, it is nearly impossible to conduct in vivo experiments to determine nutritional value of hatchery byproduct mixtures whenever the ratio in the mixture changes. If the ratio of each component in the pooled hatchery byproduct mixture in layer hatchery facilities is known or estimated and if the energy and nutrient values are additive, available energy and nutrient concentrations in the mixture would be calculated as the proportional sum of energy and nutrients from each ingredient resulting in a precise feed formulation [1,6]. Therefore, the objective of the present study was to test the additivity of digestible energy, phosphorus (P), calcium (Ca), and amino acid (AA) concentrations in a hatchery byproduct mixture fed to nursery pigs based on previous metabolism studies [4,7].

MATERIALS AND METHODS

All protocols used in the animal studies were approved by the Animal Care and Use Committee of Konkuk University (approval number: KU17049, KU18072, and KU18145). Four digestibility experiments were conducted in environmentally controlled rooms at Konkuk University.

Data collection

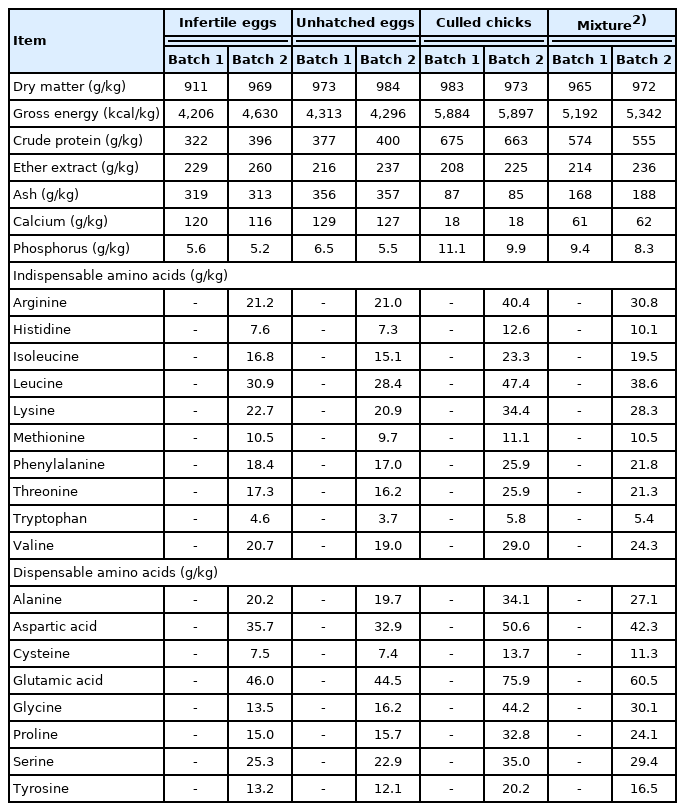
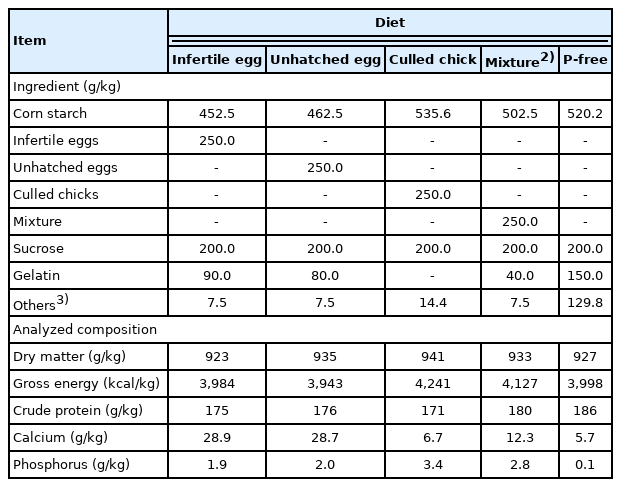
Digestible energy, metabolizable energy (ME), apparent total tract digestible (ATTD) P, standardized total tract digestible (STTD) P, ATTD Ca, STTD Ca, apparent ileal digestible (AID) AA, and standardized ileal digestible (SID) AA in infertile eggs, unhatched eggs, culled chicks, and a mixture of 3 ingredients consisted of 200 g/kg infertile eggs, 200 g/kg unhatched eggs, and 600 g/kg culled chicks (Table 1) fed to nursery pigs (initial body weight = 9.4 to 14.2 kg) were determined in our previous experiments [4,7]. The experimental diets for DE and ME measurement had constant corn to whey powder ratio to enable the calculation of DE and ME in the test ingredients using difference procedure (Table 2). The diets for P, Ca, and AA digestibility determination were formulated to contain a test ingredient as the sole source of P, Ca, or AA (Tables 3, 4, and 5), and thus, P, Ca, and AA digestibility values in an experimental diet represented the digestibility values in the ingredient. For energy, P, and Ca studies, the marker-to-marker method was used to collect feces totally, whereas the index method was used in AA study. Antibiotics were not included in the experimental diets.

Analyzed composition of hatchery byproducts, as-is basis1)

Ingredient and chemical compositions of the experimental diets used in energy digestibility experiment, as-fed basis1)

Ingredient and chemical compositions of the experimental diets used in phosphorus digestibility experiment, as-fed basis1)

Ingredient and chemical compositions of the experimental diets used in calcium digestibility experiment, as-fed basis1)

Ingredient and chemical compositions of the experimental diets used in amino acid digestibility experiment, as-fed basis1)

Calculations and statistical analyses

Digestible energy in infertile eggs, unhatched eggs, and culled chicks measured in the previous study [4] were used for calculating the predicted DE (kcal/kg) in the mixture according to the following equation modified from Kong and Adeola [8]:

Predicted DEMixture=(DEInfertile eggs+DEUnhatched eggs+3×DECulled chicks)/5

where predicted DEMixture is predicted DE in the mixture and DEInfertile eggs, DEUnhatched eggs, and DECulled chicks are measured DE values in infertile eggs, unhatched eggs, and culled chicks, respectively. Predicted values for ME (kcal/kg) and digestible P, Ca, and AA (g/kg) in the mixture were calculated as same as DE using the reported values [4,7].

For the comparison between measured and predicted values, a t-test was used and an alpha level of 0.05 was used to determine significance [9].

RESULTS

In the previous studies, 2 batches of hatchery byproducts were obtained and dried separately [4,7]. The first batch was used in energy and P digestibility experiments and the second batch was employed for Ca and AA digestibility experiments. Analyzed compositions of each hatchery byproduct of 2 batches were comparable (Table 1). Energy concentration and nutrient utilization of each hatchery byproduct ingredient and the mixture are provided in Table 6.

Energy concentrations (as-is basis) and coefficient of nutrient digestibility of phosphorus (P), calcium (Ca), and amino acids (AA) in the hatchery byproducts1),2)

No difference between measured and predicted values for DE and ME in the hatchery byproduct mixture of infertile eggs, unhatched eggs, and culled chicks was observed (Table 7). While measured ATTD P and STTD P in the mixture were less than predicted values (p<0.05), measured ATTD Ca and STTD Ca were greater than predicted values (p<0.05). No difference was observed between measured and predicted AID and SID AA in the mixture except for tryptophan (Table 8).

Measured and predicted values for energy, phosphorus (P), and calcium (Ca) concentrations in the hatchery byproduct mixture, as-is basis

Measured and predicted values for digestible crude protein and amino acid (AA) concentrations (g/kg) in the hatchery byproduct mixture, as-is basis

DISCUSSION

Information on additivity of energy concentrations in animal protein sources for non-ruminants is very limited. In ruminants, energy concentrations may not be additive if a mixed diet is composed of forages and readily available carbohydrates due to changes in pH value, volatile fatty acid production, and microbial activity in the rumen which significantly affect energy metabolism [10]. In contrast to ruminants, the DE and ME values in feed ingredients for pigs are known to be additive in the mixed diets containing feed ingredients including corn, soybean meal, camelina cake, and wheat bran [11,12]. The additivity assumption on energy concentrations in swine diets may be violated if the proportion of a high-fiber ingredient in a mixed diet is very high likely due to negative effects of dietary fiber on energy digestibility of other ingredients. If a high-fiber ingredient in a mixed diet impedes energy utilization of other ingredients in the mixed diets, an actual energy concentration in the mixed diet would be less than the value calculated assuming additivity. In the present work, energy concentrations were additive in the hatchery byproduct mixture as hatchery byproducts are animal protein sources containing very little fiber.

The hatchery byproduct mixture used by Sung et al [4,7] contained infertile eggs, unhatched eggs, and culled chicks. The classification of each hatchery byproduct ingredient is based on the hatchery process. Infertile eggs are the eggs identified as infertile on day 8 post-fertilization. Fertile eggs are incubated until day 21 post-fertilization. Unhatched eggs are the eggs where embryonic development ceases or a chick does not break eggshells until day 21 post-fertilization. Culled chicks are weak chicks or male chicks that cannot lay eggs.

The STTD P or Ca and SID AA have been reported to be more additive compared with ATTD and AID nutrients in the mixture [1315]. The reason for the non-additivity of apparent digestible nutrients in the mixture is an underestimation of ingredient nutrient digestibility particularly when a nutrient concentration is low mainly due to basal endogenous losses of nutrients [1,6]. In contrast to the ATTD and AID nutrients, STTD and SID nutrients are independent of basal endogenous losses of nutrients because these values are calculated by correcting apparent digestible nutrients for basal endogenous losses [1619]. For this reason, NRC [20] suggested that diet formulations and requirements should be expressed on STTD P and SID AA.

In the present work, predicted ATTD and STTD P in the mixture were greater than the measured values, indicating that digestible P concentrations in the hatchery byproducts are not additive in the mixture. The non-additivity of digestible P in the mixture may be partially due to different Ca to P ratios among the experimental diets. Phosphorus digestibility in pigs was reported to linearly decrease as the dietary Ca concentration increased from 7 to 23 g/kg when dietary P concentration was below the requirement [21]. The lower P digestibility with high Ca to P ratio in diets is likely due to the Ca-P complex formed by increased dietary Ca, which eventually impedes P from being absorbed. The contribution of P provided by culled chicks accounts for the largest proportion of total P (approximately 73%) in the mixture and Ca to P ratio in the mixture diet is more than twice of that in culled chick diet (4.4 vs 2.0). The low P digestibility in the mixture diet appears to be mainly attributed to the large Ca to P ratio. The P digestibility measured in the culled chick diet perhaps was not reflected in the mixed diet. In other studies, however, standardized or true total tract P digestibility values in mixed diets containing various cereal grains and oilseed meals were additive [13,22,23]. The Ca to P ratios in the experimental diets used in those studies ranged from 0.6 to 1.5, indicating that a non-excessive Ca to P ratio in diets is important for the additivity of digestible P in the mixture.

In contrast to P, predicted ATTD and STTD Ca were less than measured values. The reason for the non-additivity of digestible Ca in the mixture may be also attributed to different Ca to P ratios among experimental diets. Calcium intake exceeding the requirement has been suggested to lower intestinal absorption of Ca [24,25]. As P concentrations in experimental diets were relatively constant in the present work, dietary Ca intake was dependent on Ca to P ratio in diets. Calcium to P ratio in the mixture diet was less than that in infertile egg diet and unhatched egg diet (1.8 vs 2.6 and 2.7). Compared with the daily Ca requirement suggested by NRC [20] for 11- to 25-kg pigs (6.3 g/d), dietary Ca intake of pigs fed to infertile egg diet and unhatched egg diet (8.1 and 7.8 g/d) exceeded the requirement whereas Ca intake of the mixture diet was 5.8 g/d which was less than the requirement. The reason for greater measured digestible Ca in the mixture may be due to that the contribution of Ca supplied by infertile eggs and unhatched eggs in the mixture was over 80% and that the downregulation of intestinal Ca absorption of infertile eggs and unhatched eggs may have been alleviated in the mixture diet. However, Stein et al [21] reported that Ca digestibility was not compromised when the Ca to P ratio in the diet and daily Ca intake of 23-kg pigs were up to 2.3 and 9.7 g/d which are comparable to the values in the previous study [7]. The reason for the inconsistent results is unclear. Zhang and Adeola [14] reported that true total tract digestibility of Ca was additive in the Ca-P balanced mixed diets containing limestone and dicalcium phosphate in 20-kg pigs. In their experiment [14], the amount of dietary Ca was below the daily Ca requirement (2.3 to 3.6 g/d vs 6.3 g/d) and Ca to P ratios were relatively constant (0.9 to 1.0).

No difference between measured and predicted AID and SID AA except for tryptophan in the mixture was observed. Each hatchery byproduct was the sole source of the respective experimental diet when determining AID and SID AA. The AID AA were not additive in the literature [1,15]. The major reason for the non-additivity was low AA concentrations in the ingredients. In the present work, however, each hatchery byproduct contains relatively high concentrations of AA, and thus, AID values in the mixture could have been relatively precisely predicted from each ingredient. Standardized ileal digestible AA are widely accepted to be additive in mixed diets [6,15,23]. The reason for non-additivity of SID tryptophan in the mixture remains unclear. The low tryptophan concentration in experimental diets possibly resulted in large errors in the measurement of tryptophan digestibility [6]. However, this speculation is not supported by the previous studies where tryptophan concentration was also the lowest among AA in experimental diets [6,15,21].

CONCLUSION

Taken together, digestible energy and most AAs in hatchery byproducts were additive in the mixture fed to nursery pigs. However, digestible tryptophan, phosphorus, and calcium concentrations in the hatchery byproduct mixture deviated from the values calculated based on digestible nutrients in the ingredients.

Notes

CONFLICT OF INTEREST

We certify that there is no conflict of interest with any financial organization regarding the material discussed in the manuscript.

FUNDING

The authors are grateful for the support of Rural Development Administration (Republic of Korea; PJ01252803). The authors also would like to thank Join Inc. (Pyeongtaek, Republic of Korea) for providing the hatchery byproducts.

References

1. Stein HH, Pedersen C, Wirt AR, Bohlke RA. Additivity of values for apparent and standardized ileal digestibility of amino acids in mixed diets fed to growing pigs. J Anim Sci 2005;83:2387–95. http://doi.org/10.2527/2005.83102387x .
2. AAFCO. 2019 Official Publication West Lafayette, IN, USA: Association of American Feed Control Officials; 2019.
3. Sung JY, Kim BG. Effects of a hatchery byproduct mixture on growth performance and digestible energy of various hatchery byproduct mixtures in nursery pigs. Animals 2020;10:174. http://doi.org/10.3390/ani10010174 .
4. Sung JY, Ji SY, Son AR, Kim BG. Energy concentration and phosphorus digestibility in hatchery byproducts fed to nursery pigs. Animals 2019;9:255. http://doi.org/10.3390/ani9050255 .
5. Sung JY, Kim BG. Prediction equations for digestible and metabolizable energy concentrations in feed ingredients and diets for pigs based on chemical composition. Anim Biosci 2021;34:306–11. http://doi.org/10.5713/ajas.20.0293 .
6. Wang T, Osho SO, Adeola O. Additivity of apparent and standardized ileal digestibility of amino acid determined by chromic oxide and titanium dioxide in mixed diets containing wheat and multiple protein sources fed to growing pigs. J Anim Sci 2018;96:4731–42. http://doi.org/10.1093/jas/sky326 .
7. Sung JY, Ji SY, Kim BG. Amino acid and calcium digestibility in hatchery byproducts fed to nursery pigs. Anim Feed Sci Technol 2020;270:114703. http://doi.org/10.1016/j.anifeedsci.2020.114703 .
8. Kong C, Adeola O. Evaluation of amino acid and energy utilization in feedstuff for swine and poultry diets. Asian-Australas J Anim Sci 2014;27:917–25. http://doi.org/10.5713/ajas.2014.r.02 .
9. Seo S, Jeon S, Ha JK. Editorial - Guidelines for experimental design and statistical analyses in animal studies submitted for publication in the Asian-Australasian Journal of Animal Sciences. Asian-Australas J Anim Sci 2018;31:1381–6. http://doi.org/10.5713/ajas.18.0468 .
10. Karlsson CP, Lindberg JE, Rundgren M. Associative effects on total tract digestibility in horses fed different ratios of grass hay and whole oats. Livest Prod Sci 2000;65:143–53. http://doi.org/10.1016/S0301-6226(99)00178-5 .
11. Kim JW, Koo B, Nyachoti CM. Digestible, metabolizable, and net energy of camelina cake fed to growing pigs and additivity of energy in mixed diets. J Anim Sci 2017;95:4037–44. http://doi.org/10.2527/jas2017.1759 .
12. Lee SH, Jo H, Kim BG. Energy values of wheat bran are additive in corn–soybean meal–based swine diets. J Anim Sci 2017;95:192–3. http://doi.org/10.2527/asasann.2017.389 .
13. Fang RJ, Li TJ, Yin FG, et al. The additivity of true or apparent phosphorus digestibility values in some feed ingredients for growing pigs. Asian-Australas J Anim Sci 2007;20:1092–9. http://doi.org/10.5713/ajas.2007.1092 .
14. Zhang F, Adeola O. True is more additive than apparent total tract digestibility of calcium in limestone and dicalcium phosphate for twenty-kilogram pigs fed semipurified diets. J Anim Sci 2017;95:5466–73. http://doi.org/10.2527/jas2017.1849 .
15. Xue PC, Ragland D, Adeola O. Determination of additivity of apparent and standardized ileal digestibility of amino acids in diets containing multiple protein sources fed to growing pigs. J Anim Sci 2014;92:3937–44. http://doi.org/10.2527/jas.2014-7815 .
16. Son AR, Shin SY, Kim BG. Standardized total tract digestibility of phosphorus in copra expellers, palm kernel expellers, and cassava root fed to growing pigs. Asian-Australas J Anim Sci 2013;26:1609–13. http://doi.org/10.5713/ajas.2013.13517 .
17. Son AR, Park CS, Park KR, Kim BG. Amino acid digestibility in plant protein sources fed to growing pigs. Asian-Australas J Anim Sci 2019;32:1745–52. http://doi.org/10.5713/ajas.19.0037 .
18. Sung JY, Kim BG. Prediction models for apparent and standardized total tract digestible phosphorus in swine diets. Anim Feed Sci Technol 2019;255:114224. http://doi.org/10.1016/j.anifeedsci.2019.114224 .
19. Lee SA, Ahn JY, Son AR, Kim BG. Standardized ileal digestibility of amino acids in cereal grains and co-products in growing pigs. Asian-Australas J Anim Sci 2020;33:1148–55. http://doi.org/10.5713/ajas.19.0449 .
20. NRC. Nutrient requirements of swine 11th edth ed. Washington, DC, USA: National Academy Press; 2012.
21. Stein HH, Adeola O, Cromwell GL, et al. Concentration of dietary calcium supplied by calcium carbonate does not affect the apparent total tract digestibility of calcium, but decreases digestibility of phosphorus by growing pigs. J Anim Sci 2011;89:2139–44. http://doi.org/10.2527/jas.2010-3522 .
22. Zhai H, Adeola O. True total-tract digestibility of phosphorus in corn and soybean meal for fifteen-kilogram pigs are additive in corn-soybean meal diet. J Anim Sci 2013;91:219–24. https://doi.org/10.2527/jas.2012-5295 .
23. She Y, Wang Q, Stein HH, et al. Additivity of values for phosphorus digestibility in corn, soybean meal, and canola meal in diets fed to growing pigs. Asian-Australas J Anim Sci 2018;31:1301–7. http://doi.org/10.5713/ajas.17.0547 .
24. Pansu D, Bellaton C, Bronner F. Effect of Ca intake on saturable and nonsaturable components of duodenal Ca transport. Am J Physiol 1981;240:G32–7. http://doi.org/10.1152/ajpgi.1981.240.1.G32 .
25. Pointillart A, Fourdin A, Bourdeau A, Thomasset M. Phosphorus utilization and hormonal-control of calcium-metabolism in pigs fed phytic phosphorus diets containing normal or high calcium levels. Nutr Rep Int 1989;40:517–27.

Article information Continued

Table 1

Analyzed composition of hatchery byproducts, as-is basis1)

Item Infertile eggs Unhatched eggs Culled chicks Mixture2)


Batch 1 Batch 2 Batch 1 Batch 2 Batch 1 Batch 2 Batch 1 Batch 2
Dry matter (g/kg) 911 969 973 984 983 973 965 972
Gross energy (kcal/kg) 4,206 4,630 4,313 4,296 5,884 5,897 5,192 5,342
Crude protein (g/kg) 322 396 377 400 675 663 574 555
Ether extract (g/kg) 229 260 216 237 208 225 214 236
Ash (g/kg) 319 313 356 357 87 85 168 188
Calcium (g/kg) 120 116 129 127 18 18 61 62
Phosphorus (g/kg) 5.6 5.2 6.5 5.5 11.1 9.9 9.4 8.3
Indispensable amino acids (g/kg)
 Arginine - 21.2 - 21.0 - 40.4 - 30.8
 Histidine - 7.6 - 7.3 - 12.6 - 10.1
 Isoleucine - 16.8 - 15.1 - 23.3 - 19.5
 Leucine - 30.9 - 28.4 - 47.4 - 38.6
 Lysine - 22.7 - 20.9 - 34.4 - 28.3
 Methionine - 10.5 - 9.7 - 11.1 - 10.5
 Phenylalanine - 18.4 - 17.0 - 25.9 - 21.8
 Threonine - 17.3 - 16.2 - 25.9 - 21.3
 Tryptophan - 4.6 - 3.7 - 5.8 - 5.4
 Valine - 20.7 - 19.0 - 29.0 - 24.3
Dispensable amino acids (g/kg)
 Alanine - 20.2 - 19.7 - 34.1 - 27.1
 Aspartic acid - 35.7 - 32.9 - 50.6 - 42.3
 Cysteine - 7.5 - 7.4 - 13.7 - 11.3
 Glutamic acid - 46.0 - 44.5 - 75.9 - 60.5
 Glycine - 13.5 - 16.2 - 44.2 - 30.1
 Proline - 15.0 - 15.7 - 32.8 - 24.1
 Serine - 25.3 - 22.9 - 35.0 - 29.4
 Tyrosine - 13.2 - 12.1 - 20.2 - 16.5
1)

Analyzed composition of batches 1 and 2 were adapted from Sung et al [4,7], respectively. The batch 1 was used for the determination of energy and phosphorus digestibility. The batch 2 was used for calcium and amino acid digestibility experiments.

2)

The mixture contained 200 g/kg dried infertile eggs, 200 g/kg dried unhatched eggs, and 600 g/kg dried culled chicks.

Table 2

Ingredient and chemical compositions of the experimental diets used in energy digestibility experiment, as-fed basis1)

Item Diet

Basal Infertile egg Unhatched egg Culled chick Mixture2)
Ingredient (g/kg)
 Ground corn 867.0 660.1 660.1 656.7 662.8
 Whey powder 100.0 76.1 76.1 75.7 76.4
 Infertile eggs - 250.0 - - -
 Unhatched eggs - - 250.0 - -
 Culled chicks - - - 250.0 -
 Mixture - - - - 250.0
 Others3) 33.0 13.8 13.8 17.6 10.8
Analyzed composition
 Dry matter (g/kg) 904 909 921 920 919
 Gross energy (kcal/kg) 3,850 3,971 4,006 4,369 4,274
 Crude protein (g/kg) 95 157 164 237 207
1)

Adapted from Sung et al [4,7].

2)

The mixture contained 200 g/kg dried infertile eggs, 200 g/kg dried unhatched eggs, and 600 g/kg dried culled chicks.

3)

Others were limestone, monosodium phosphate, sodium chloride, vitamin premix, and mineral premix.

Table 3

Ingredient and chemical compositions of the experimental diets used in phosphorus digestibility experiment, as-fed basis1)

Item Diet

Infertile egg Unhatched egg Culled chick Mixture2) P-free
Ingredient (g/kg)
 Corn starch 452.5 462.5 535.6 502.5 520.2
 Infertile eggs 250.0 - - - -
 Unhatched eggs - 250.0 - - -
 Culled chicks - - 250.0 - -
 Mixture - - - 250.0 -
 Sucrose 200.0 200.0 200.0 200.0 200.0
 Gelatin 90.0 80.0 - 40.0 150.0
 Others3) 7.5 7.5 14.4 7.5 129.8
Analyzed composition
 Dry matter (g/kg) 923 935 941 933 927
 Gross energy (kcal/kg) 3,984 3,943 4,241 4,127 3,998
 Crude protein (g/kg) 175 176 171 180 186
 Calcium (g/kg) 28.9 28.7 6.7 12.3 5.7
 Phosphorus (g/kg) 1.9 2.0 3.4 2.8 0.1
1)

Adapted from Sung et al [4,7].

2)

The mixture contained 200 g/kg dried infertile eggs, 200 g/kg dried unhatched eggs, and 600 g/kg dried culled chicks.

3)

Others were cellulose, soybean oil, crystalline amino acids, limestone, potassium carbonate, magnesium oxide, sodium chloride, vitamin premix, and mineral premix.

Table 4

Ingredient and chemical compositions of the experimental diets used in calcium digestibility experiment, as-fed basis1)

Item Diet

Infertile egg Unhatched egg Culled chick Mixture2) Ca-free
Ingredient (g/kg)
 Ground corn 764.7 769.8 733.9 778.0 828.9
 Potato protein concentrate 115.0 110.0 - 50.0 150.0
 Infertile eggs 100.0 - - - -
 Unhatched eggs - 100.0 - - -
 Culled chicks - - 250.0 - -
 Mixture - - - 150.0 -
 Others3) 20.3 20.2 16.1 22.0 21.1
Analyzed composition
 Dry matter (g/kg) 882 882 892 883 871
 Gross energy (kcal/kg) 4,019 4,000 4,327 4,068 4,027
 Crude protein (g/kg) 203 199 216 182 196
 Calcium (g/kg) 12.4 11.8 4.8 9.0 0.9
 Phosphorus (g/kg) 4.8 4.4 4.6 4.9 4.6
1)

Adapted from Sung et al [4,7].

2)

The mixture contained 200 g/kg dried infertile eggs, 200 g/kg dried unhatched eggs, and 600 g/kg dried culled chicks.

3)

Others were monosodium phosphate, sodium chloride, vitamin premix, and mineral premix.

Table 5

Ingredient and chemical compositions of the experimental diets used in amino acid digestibility experiment, as-fed basis1)

Item Diet

Infertile egg Unhatched egg Culled chick Mixture2) N-free
Ingredient (g/kg)
 Cornstarch 479.3 480.1 479.9 482.5 680.0
 Sucrose 200.0 200.0 200.0 200.0 200.0
 Infertile eggs 300.0 - - - -
 Unhatched eggs - 300.0 - - -
 Culled chicks - - 300.0 - -
 Mixture - - - 300.0 -
 Others3) 20.7 19.9 20.1 17.5 120.0
Analyzed composition
 Dry matter (g/kg) 936 940 936 936 925
 Gross energy (kcal/kg) 3,920 3,824 4,302 4,111 3,681
 Crude protein (g/kg) 119 119 200 160 3
 Lysine (g/kg) 7.0 6.8 10.1 8.3 0.1
 Methionine (g/kg) 3.2 2.9 3.2 3.2 0.1
 Threonine (g/kg) 5.4 5.3 7.7 6.4 0.1
 Tryptophan (g/kg) 1.5 1.5 1.4 1.5 0.0
1)

Adapted from Sung et al [4,7].

2)

The mixture contained 200 g/kg dried infertile eggs, 200 g/kg dried unhatched eggs, and 600 g/kg dried culled chicks.

3)

Others were soybean oil, cellulose, limestone, monosodium phosphate, potassium carbonate, magnesium oxide, sodium chloride, vitamin-mineral premix, and chromium oxide.

Table 6

Energy concentrations (as-is basis) and coefficient of nutrient digestibility of phosphorus (P), calcium (Ca), and amino acids (AA) in the hatchery byproducts1),2)

Item3) Infertile egg Unhatched egg Culled chick Mixture4) SEM p-value
Gross energy (kcal/kg) 4,206 4,313 5,884 5,192 - -
Digestible energy (kcal/kg) 2,759d 3,735c 4,840a 4,224b 116 <0.001
Metabolizable energy (kcal/kg) 2,645c 3,625b 4,560a 3,998b 123 <0.001
CATTD of P 0.640a 0.447b 0.438b 0.355b 0.042 <0.001
CSTTD of P 0.817a 0.616b 0.539b 0.474b 0.042 <0.001
CATTD of Ca 0.485b 0.383c 0.633a 0.580a 0.033 <0.001
CSTTD of Ca 0.533c 0.434d 0.756a 0.645b 0.033 <0.001
CSID of crude protein 0.750a 0.713ab 0.638b 0.682ab 0.027 0.023
CSID of indispensable AA
 Arginine 0.815a 0.791ab 0.717b 0.738ab 0.024 0.009
 Histidine 0.783a 0.750ab 0.683b 0.715ab 0.027 0.027
 Isoleucine 0.820a 0.779ab 0.675c 0.718bc 0.028 <0.001
 Leucine 0.842a 0.804ab 0.706c 0.749bc 0.027 0.001
 Lysine 0.810 0.793 0.777 0.795 0.026 0.740
 Methionine 0.836 0.810 0.809 0.834 0.024 0.606
 Phenylalanine 0.824a 0.782ab 0.670c 0.716bc 0.027 <0.001
 Threonine 0.788a 0.750ab 0.652b 0.700ab 0.030 0.010
 Tryptophan 0.833a 0.774ab 0.513c 0.694b 0.030 <0.001
 Valine 0.820a 0.780ab 0.662c 0.709bc 0.027 <0.001
CSID of dispensable AA
 Alanine 0.797 0.779 0.726 0.750 0.028 0.163
 Aspartic acid 0.719a 0.665ab 0.593b 0.626b 0.025 0.006
 Cysteine 0.723a 0.623ab 0.381c 0.525b 0.032 <0.001
 Glutamic acid 0.810a 0.782ab 0.701b 0.742ab 0.026 0.017
 Glycine 0.645 0.656 0.586 0.598 0.047 0.465
 Proline 0.195 0.317 0.363 0.363 0.185 0.701
 Serine 0.741a 0.714a 0.563b 0.620b 0.025 <0.001
 Tyrosine 0.829a 0.779ab 0.635c 0.694bc 0.031 <0.001

SEM, standard error of the means; CATTD, coefficient of apparent total tract digestibility; CSTTD, coefficient of standardized total tract digestibility; CSID, coefficient of standardized ileal digestibility.

1)

Adapted from Sung et al [4,7].

2)

Each least squares mean represents 6 to 8 observations.

3)

Basal endogenous losses (g/kg dry matter intake) were determined from pigs fed semi-purified diets: phosphorus, 0.36; calcium, 0.66; crude protein, 21.52; arginine, 0.69; histidine, 0.27; isoleucine, 0.44; leucine, 0.75; lysine, 0.73; methionine, 0.14; phenylalanine, 0.47; threonine, 0.92; tryptophan, 0.18; valine, 0.67; alanine, 0.86; aspartic acid, 1.17; cysteine, 0.30; glutamic acid, 1.58; glycine, 1.56; proline, 3.11; serine, 0.91; tyrosine, 0.40.

4)

The mixture contained 200 g/kg dried infertile eggs, 200 g/kg dried unhatched eggs, and 600 g/kg dried culled chicks.

a–d

Least squares means within a row without a common superscript differ (p<0.05).

Table 7

Measured and predicted values for energy, phosphorus (P), and calcium (Ca) concentrations in the hatchery byproduct mixture, as-is basis

Item Measured Predicted Standard error1) p-value
DE (kcal/kg) 4,224 4,203 199 0.890
ME (kcal/kg) 3,998 3,990 219 0.959
ATTD P (g/kg) 3.3 4.2 0.2 0.003
STTD P (g/kg) 4.5 5.3 0.2 0.004
ATTD Ca (g/kg) 36.0 27.9 1.9 0.004
STTD Ca (g/kg) 40.0 31.7 1.9 0.004

DE, digestible energy; ME, metabolizable energy; ATTD, apparent total tract digestible; STTD, standardized total tract digestible.

1)

Standard error of the difference between measured and predicted values.

Table 8

Measured and predicted values for digestible crude protein and amino acid (AA) concentrations (g/kg) in the hatchery byproduct mixture, as-is basis

Item Apparent ileal digestible Standardized ileal digestible


Measured Predicted SE1) p-value Measured Predicted SE p-value
Crude protein 308.7 303.2 12.5 0.469 378.7 370.4 12.5 0.356
Indispensable AA
 Arginine 20.5 21.9 0.7 0.113 22.8 24.2 0.7 0.125
 Histidine 6.3 6.6 0.3 0.557 7.2 7.4 0.3 0.621
 Isoleucine 12.5 13.2 0.6 0.583 14.0 14.6 0.6 0.634
 Leucine 26.5 27.5 1.1 0.667 28.9 29.9 1.1 0.705
 Lysine 20.1 20.8 0.8 0.700 22.5 23.0 0.8 0.752
 Methionine 8.3 8.3 0.3 0.565 8.8 8.7 0.3 0.603
 Phenylalanine 14.1 14.6 0.7 0.671 15.6 16.1 0.7 0.712
 Threonine 12.0 12.5 0.7 0.731 14.9 15.3 0.7 0.805
 Tryptophan 3.1 2.5 0.2 0.004 3.7 3.1 0.2 0.004
 Valine 15.0 15.8 0.7 0.487 17.2 17.9 0.7 0.558
Dispensable AA
 Alanine 17.6 18.5 0.7 0.404 20.3 21.1 0.7 0.474
 Aspartic acid 22.8 23.9 1.1 0.474 26.5 27.5 1.1 0.521
 Cysteine 5.0 4.2 0.4 0.067 5.9 5.1 0.4 0.063
 Glutamic acid 40.0 41.5 1.6 0.548 44.9 46.3 1.6 0.587
 Glycine 13.1 14.7 0.9 0.169 18.0 19.4 0.9 0.221
 Proline −0.5 −0.3 4.0 0.930 8.7 8.7 4.0 0.967
 Serine 15.4 16.1 0.8 0.533 18.2 18.8 0.8 0.585
 Tyrosine 10.1 10.4 0.6 0.848 11.5 11.8 0.6 0.896

SE, standard error.

1)

Standard error of the difference between measured and predicted values.