Genome–wide association study of carcass weight in commercial Hanwoo cattle
Article information

Abstract
Objective
The objective of the present study was to validate genes and genomic regions associated with carcass weight using a low-density single nucleotide polymorphism (SNP) Chip in Hanwoo cattle breed.
Methods
Commercial Hanwoo steers (n = 220) were genotyped with 20K GeneSeek genomic profiler BeadChip. After applying the quality control of criteria of a call rate ≥90% and minor allele frequency (MAF) ≥0.01, a total of 15,235 autosomal SNPs were left for genome-wide association (GWA) analysis. The GWA tests were performed using single-locus mixed linear model. Age at slaughter was fitted as fixed effect and sire included as a covariate. The level of genome-wide significance was set at 3.28×10⁻⁶ (0.05/15,235), corresponding to Bonferroni correction for 15,235 multiple independent tests.
Results
By employing EMMAX approach which is based on a mixed linear model and accounts for population stratification and relatedness, we identified 17 and 16 loci significantly (p<0.001) associated with carcass weight for the additive and dominant models, respectively. The second most significant (p = 0.000049) SNP (ARS-BFGL-NGS-28234) on bovine chromosome 4 (BTA4) at 21 Mb had an allele substitution effect of 43.45 kg. Some of the identified regions on BTA2, 6, 14, 22, and 24 were previously reported to be associated with quantitative trait loci for carcass weight in several beef cattle breeds.
Conclusion
This is the first genome-wide association study using SNP chips on commercial Hanwoo steers, and some of the loci newly identified in this study may help to better DNA markers that determine increased beef production in commercial Hanwoo cattle. Further studies using a larger sample size will allow confirmation of the candidates identified in this study.
INTRODUCTION
The Korean native cattle have inhabited in the Korean Peninsula for over 2000 years. Mitochondrial based analysis showed that Korea cattle carried only Bos taurus haplotype [1]. Hanwoo cattle breed has been phenotypically subjected to intensive selection for meat production and quality traits including carcass weight, eye muscle area, backfat thickness, and marbling score [2]. As a result, a substantial genetic gain has achieved for carcass weight and eye muscle area [3]. Similarly, a yearling weight was increased from 315.54 kg to 355.06 kg over the last 13 years [3].
Carcass weight is one of the most critical quantitative traits affecting beef cattle production. And it needs to be taken into consideration in genetic improvement programs to assess the economic return on investment in beef cattle production. Carcass weight is considerably affected by genetics and environmental factors [4]. Bos taurus and Bos indicus×Bos taurus breeds had greater mean live weight, carcass weight and dressing percentage than pure Bos indicus breed [5]. Similarly, within Bos taurus breeds, late maturing breeds produces a heavier carcass with little fat, while early maturing breeds produce lighter weight carcasses [4].
With the advent of genome sequencing and genotyping platforms, genome-wide association studies (GWAS) have become a powerful tool and increasingly used to dissect the genetics of quantitative trait loci (QTL) in several domestic livestock species. In cattle, different genotyping platforms including the Illumina Bovine 50K (San Diego, CA, USA), 770K and 10 chips (Santa Clara, CA, USA) have been developed during the last few years [6]. GWAS correlate allele frequencies at the entire genome level and provides a high resolution to map loci even with modest effects on QTLs [7,8].
With the availability of such genotyping arrays, GWAS have been performed to dissect the genetics of QTL in several beef cattle breeds [9,10]. Particularly, GWAS based studies have uncovered several genomic regions that harbor QTLs for carcass weight in various cattle breeds. For instance, Lee et al [11] genotyped 1,011 Hanwoo steers obtained from progeny testing programs using a high-density single nucleotide polymorphism (SNP) chip and detected QTL for carcass weight on bovine chromosome 14 (BTA14, 23 to 25 Mb). Using a low- density SNP chip [12] reported QTL for carcass weight on BTA4 in Korean Hanwoo cattle. In Japanese Black cattle [13], mapped markers associated with carcass weight on chromosomes 6, 8, and 14. Another study by [14] detected significant linkages with carcass weight on BTA 1, 6, 7, and 10. Recently, Sorbolini et al [15] used high-density assay and identified significant SNPs on BTA2 associated with carcass weight and average daily gain in Marchiana cattle breed. Additionally, GWAS revealed the association of SNPs within diacylglycerol O-acyl transferase 1 and leptin receptor gene with beef traits [16]. Non-synonymous SNP on BTA 6 within non-SMC condensin I complex subunit G identified to be significantly associated with carcass weight in a large Japanese black population [10].
Although over the past few years, GWAS have identified several QTLs in Hanwoo steers of progeny tested populations, to date no GWAS have been conducted on carcass weight of commercial Hanwoo steers. Though there is little information on QTLs for carcass weight at different growth stages, studies in inbred mice found that QTLs affecting early and late growth traits were distinct and mapped to different chromosomes, indicatingthat different genes and physiological mechanisms may control body growth at different stages [17]. Similarly, age specific QTLs for growth rate were reported in crossbred chickens [18]. In human, it has been demonstrated that age significantly affected the expression of genes related to metabolism and cell development in skeletal muscle [19]. Therefore, different loci may control body weight/carcass weight at different ages in cattle. In the present study, we performed a GWAS using 220 commercial Hanwoo steers genotyped on 20KGGP (GeneSeek genomic profiler) array (Gene Seek Inc., Lincoln, NE, USA) to identify loci that are significantly associated with carcass weight. The results of the current study will aid the development of selection tool in commercial Hanwoo cattle populations.
MATERIALS AND METHODS
Animals, genotyping, and quality control
Nasal samples were collected using Performagene LIVESTOCK's nasal swab DNA collection kit (DNA Genotek Inc., Kanata, ON, Canada) from 220 Hanwoo steers from commercial Hanwoo production farms. The 220 animals were sired by 30 bulls ranging from 1 to 38 calves per sire. Carcass weight was measured at an average age of 31.07 months with an average value of 442.45±45.98 kg. All animals were genotyped on GeneSeek genomic profiler BeadChip (Gene Seek Inc., USA) according to the manufacture’s protocol (http://www.illumina.com) that contains 19,720 SNPs of which, 18,593 were mapped to autosomes, 1,023 to X–chromosome, 9 to Y–chromosome, 13 to mtDNA, and 82 not assigned to any chromosome. SNPs on sex chromosomes, mtDNA and not assigned to any genomic location were removed from further analyses. Quality control was performed with SNP and Variation Suit v8.4.4 (Golden Helix, Inc., Bozeman, MT, USA www.goldenhelix.com). Four individuals with missing genotype greater than 10% were excluded. After applying quality control by individuals, a total of 18,593 autosomal SNPs with an average spacing of 135.10 kb were filtered for a call rate ≥90% and minor allele frequency (MAF) ≥0.01. We also filtered out SNPs that significantly deviated from Hardy-Weinberg equilibrium (HEW) with p<1×10⁻⁶. Subsequently, 3,223 SNPs that had MAF less than 0.01, 89 SNPs departed from the HWE and 121 SNPs with a call rate less than 90% (10% missing) were excluded from analysis. After applying the above quality control criteria, a total of 15,235 autosomal SNPs left for 220 Hanwoo steers were used for genome-wide association analysis.
Statistical analyses
Genome-wide association (GWA) tests were performed using single-locus mixed linear model GWAS (EMMAX) using SNP and Variation Suit v8.5.0 (Golden Helix, Inc., USA www.goldenhelix.com). In GWAS, lack of accounting for population structure may lead to spurious association results [20]. The EMMAX (Efficient Mixed-Model Association expedited) statistic test approach is proven to outperform the principal analysis and genomic control in accounting for sample structure (stratification and relatedness) [20]. In our analysis, this technique was used to correct for confounding effects due to subpopulation structure and relatedness between individuals. In the EMMAX, the n×n genetic matrix of identity by state between individuals is computed from the genotype data. The model used can be expressed as:
Where y is an n×1 the vector of observed phenotypic values of the animals, X is an n×f matrix of fixed effects including mean SNPs and age (month), β is a q×1 vector representing coefficients of the fixed effects, Z is an n×t relating the instances of the random effect to the carcass weight, β coefficient of fixed effects, u the random animal effects, and e residual effect. The proportion of variance explained (pve) by the effects of the marker was estimated with SNP and Variation Suit v8.5.0 (Golden Helix, Inc., USA www.goldenhelix.com) using the EMMA technique [20]. Age at slaughter was fitted as fixed effect and sire is included as a covariate. We tested the additive and dominance genotypic models. The level of genome-wide significance was set at 3.28×10⁻⁶ (0.05/15,235), corresponding to Bonferroni correction for 15,235 multiple independent tests. The general linear model (GLM) procedure of the Statistical Analysis (V.9.1, SAS Inc., Cary, NC, USA) was used to test for significant difference between the genotypes of the 17 SNPs that are significantly associated (p<0.001) with carcass weight. We further used a haplotype-based approach to identify variants associated with carcass weight. Haplotype blocks were defined according to Gabriel method [21]. According to this method, SNP pairs to be in strong linkage disequilibrium (LD) if the one-sided upper 95% confidence bound on D′ is 0.98 (that is consistent with no historical recombination) and the lower bound is above 0.7. Haplotype trend regression analysis was performed using SNP and Variation Suit v8.4.4 (Golden Helix, Inc., USA www.goldenhelix.com). Genes within the significant SNPs and their close vicinity were explored from National Center for Biotechnology Information database (http://www.ncbi.nlm.nih.gov/). We have further searched for the QTL regions overlap with the identified candidate regions from bovine QTL database (http://bovinegenome.org/bovineqtl_v2/findQTL.html) and (http://www.animalgenome.org/cgi-bin/QTLdb/BT/index). Gene network analysis provides an important insight into the genetic architecture of complex polygenic traits [22]. To this end, we carried out gene network analysis using the candidate genes by employing GeneMANIA (www.genemania.org/plugin/) implemented in Cytoscape software 3.4 [23].
RESULTS AND DISCUSSION
In the current study, we collected carcass weight from and genotyped 220 Hanwoo steers with GeneSeek genomic profiler BeadChip that contains 19,720 SNPs. Of these, 15,235 autosomal SNPs that met the quality control criteria were used for the genome-wide association analysis. In GWAS, significant SNPs were declared when the p value was less than the genome-wide type I error rate, adjusted with Bonferroni correction by using α/K, where α = 0.05 and K = number of SNPs. After applying a Bonferroni correction (0.05/15,235 = 3.28 ×10⁻⁶), however, we did not detect any SNP displaying the set genome-wide significant threshold for the models tested (Figure 1, Table 1) but this was not unexpected given the limited number of samples used in our study (n = 220). In addition, as indicated in the previous studies, the lack of significance at the genome-wide level because this is a stringent test [24]. A total of 17 and 16 SNPs were found to be associated with carcass weight across the bovine genome at the 0.1% significant level for the additive and dominant models, respectively (Tables 1, 2).
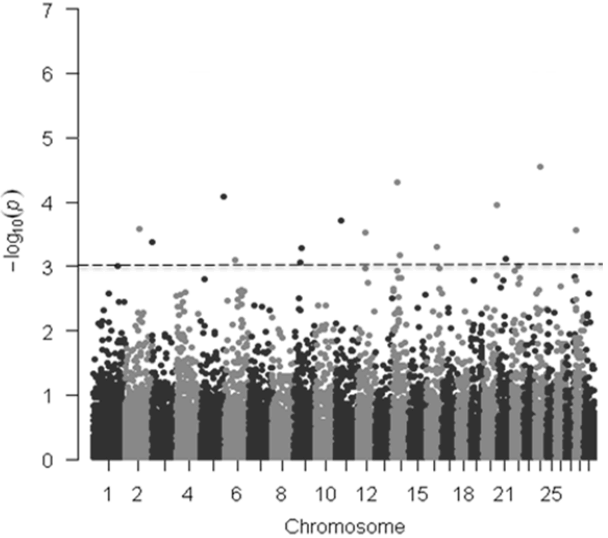
Manhattan plots of genome-wide −log10 (p-values) for carcass weight in Hanwoo cattle for additive model. The dotted horizontal line represents the set significant threshold (−log10 [p-value = 3]).
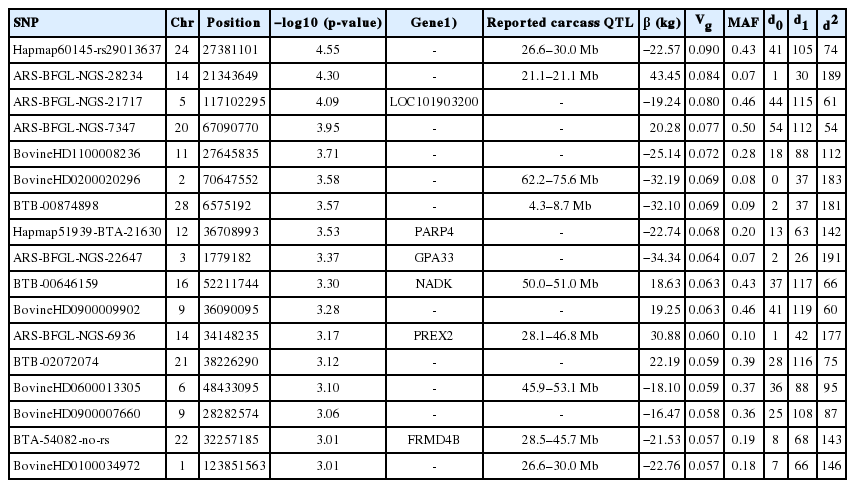
Summary of significant SNPs (p<0.001) associated with carcass weight in 220 Hanwoo cattle using the additive model
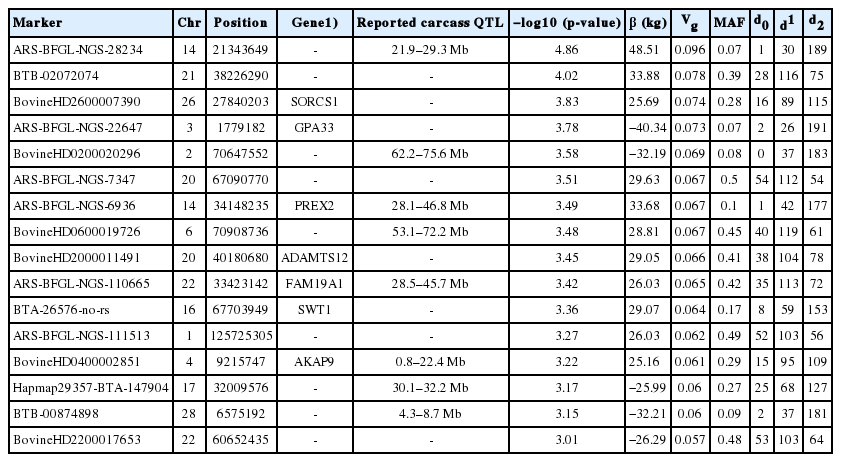
Summary of significant SNPs (p<0.001) associated with carcass weight in 220 Hanwoo cattle using the dominant model
For the additive model, the 17 significant SNPs (p<0.001) were distributed over 15 BTA containing 6 annotated genes, including LOC101903200, poly (ADP-ribose) polymerase family member 4 (PARP4), glycoprotein A33 (GPA33), NAD kinase (NADK), phosphatidylinositol-3,4,5-trisphosphate dependent Rac exchange factor 2 (PREX2), and FERM domain containing 4B (FRMD4B). The most significant association was observed with Hapmap60145-rs29013637 (p = 0.000027) on BTA 24 at 27.38 Mb. This SNP is an intergenic and 124 kb away from the TRNAS-GGA [transfer RNA serine (anticodon GGA)] gene. The second most significant SNP (ARS-BFGL-NGS-28234; p = 0.000049) was located on BTA 14 at 21 Mb (Table 1, Figure 1).
Allele substitution effects for the significant SNPs ranged from 16.47 (BovineHD0900007660) to 43.45 kg (ARS-BFGL-NGS-28234). The most significant SNP (Hapmap60145-rs 29013637) had an allele substitution effect of 22.57 kg, whereas the second most significant SNP (ARS-BFGL-NGS-28234) had an effect of 43.45 kg (Table 1). It was notable that PREX2 and GPA33 genes were significant for both additive and dominant models.
To gain additional information on the loci that had a large effect on observed phenotypic variance, we further calculated the proportion of genetic variance explained by each SNP finding that the most significant SNP on BTA24 at 27.38 Mb explained 0.09% of the total variance, whereas the second most significant SNP accounted for about 0.08% of the total variance (Table 1). The proportion of variance explained by each significant SNP was very low showing that the polygenic nature of carcass weight is governed by many genes with small effects. In our GLM analysis of the effect of genotype on carcass weight, 4 SNPs (ARS-BFGL-NGS-21717, BovineHD090000 7660, BovineHD0900009902, and BTB-00646159) had significant effect on carcass weight (p<0.05) (Figure 2).
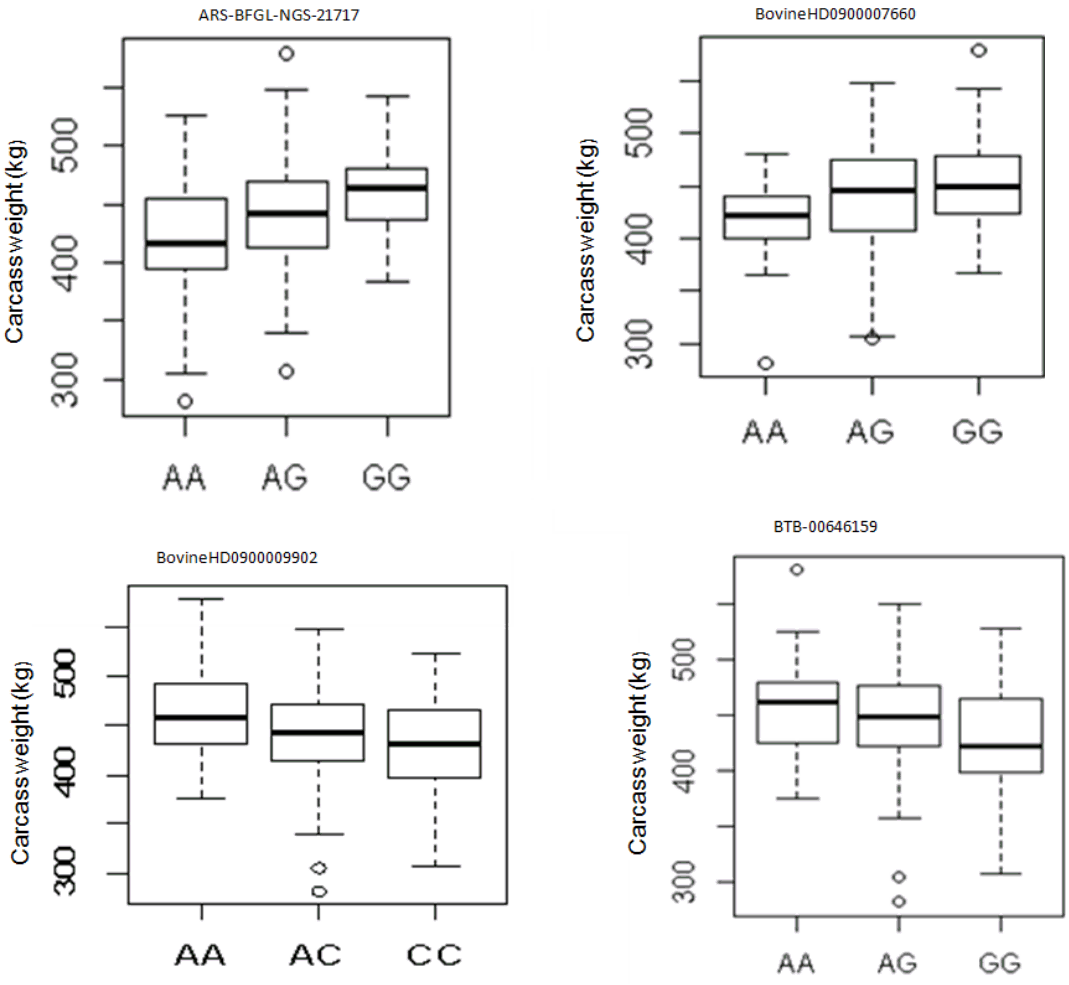
The effect of genotypes of four single nucleotide polymorphism identified to be associated with carcass weight in Hanwoo cattle for additive model.
Eight of the 17 SNP coincide with carcass weight QTLs in various beef cattle breeds. The regions on BTA14 at 21 Mb and 34 Mb were reported to harbor QTL for carcass weights in beef cattle breeds. A number of previous studies identified QTL for carcass weight, bovine stature, and growth related traits in cattle on bovine BTA14. In Hanwoo cattle, Lee et al [25] identified SNPs significantly association with carcass weight on BTA 14 (23 Mb to 25 Mb). In addition, [9] identified QTL for carcass weight on BTA 14 harboring pleomorphic adenoma gene 1 (PLAG1) gene in Japanese Black cattle. In Nellore cattle, GWAS using 777K SNPs [26] also detected association for carcass weight on BTA14. Moreover, Rempel et al [27] identified carcass weight QTL (21.1 to 21.1 Mb) on BTA14 in crossbred beef cattle. It has been also reported that the QTLs on BTA14 associated with body size in taurine and zebu cattle [28].
The other SNP (BTB-00874898) that was significantly associated with carcass weight (p = 0.0002) was located at 6.5 Mb of chromosome 28. On the same chromosome (between 4.3 to 8.7 Mb), McClure et al [29] identified QTLs for carcass weight in Angus cattle. The significance SNP (BTA-54082-no-rs) on BTA 22 (32 Mb) contains FRMD4B gene. In mice, this gene plays a key role in actin cytoskeleton dynamics and membrane trafficking during junction remodeling and epithelial polarization [30]. QTL mapping by [31] detected QTL for carcass weight on BTA22 (28.5 to 45.7 Mb) in Bos indicus-Bos taurus cross. Interestingly, one of our significant SNP (BTB-00874898) lies within the reported QTL region. The SNP on BTA12 (Hapmap51939-BTA-21630) is located within the PARP4 gene. This gene was known to have a key role in regulating adipogenesis [32]. McClure et al [29] mapped QTL regions associated with carcass weight on BTA 2 (62.2 to 75.6 Mb), BTA 6 (45.9 to 53.1 Mb), 24 between 26.6 to 30.0 Mb and BTA28 (4.3 to 8.7 Mb) in Angus cattle breed. Genome-wide association study identified QTL for carcass weight on BTA6 in Japanese Black cattle [9]. Similarly, several SNPs were highly associated with growth on BTA6 between 25 and 53 Mb on BTA 6 [33]. Cattle QTL for birth weight [34,35], pre- and post-weaning body weight gain [35,36], and yearling weight [34] were reported from 25 to 53 Mb on BTA6.
Haplotype–based association analyses have been a powerful approach to detecting the causative variants underlying complex phenotypes [21,37]. To examine whether any haplotype was associated with carcass weight, we also performed haplotype regression analysis. Twelve haplotype blocks distributed in 9 chromosomes were shown to have a significant (p<0.05) effect on carcass weight. A highly significant (p = 0.0002) effect on carcass weight was found for haplotypes detected on BTA12. This haplotype block spanned 119.855 kb and contains two SNPs (Hapmap51939-BTA-21630 and ARS-BFGL-NGS-32801) within PARP4 and ring finger protein 17 (RNF17) genes. In GWAS, it has been demonstrated that RNF17 gene was associated with the fatty acid profile in Nellore cattle [38] and growth traits [39]. We found that a haplotype block of 3.591 kb (SNPs BovineHD1900016031 and BovineHD1900016032) on BTA19 had also a significant association with carcass weight (p = 0.001) and harbors transmembrane protein 94. Another region associated with carcass weight (p = 0.02) was located on BTA20 encompassing a single annotated gene, ADAM metallopeptidase with thrombospondin type 1 motif 12 (ADAMTS12). Recent co-association network analysis revealed that PR domain containing 16 (PRDM16) was among the key transcription factors regulating growth traits in pigs [39]. This gene is also involved in the differentiation of adipose tissue [40]. Interestingly, ADAMTS12 identified as co-associated with PRDM16 [39]. In human, ADAMTS12 is involved in skeletal muscle regeneration and mediates the neurotoxic effect of beta-amyloid peptide [41].
The MyoD gene family encodes basic helix-loop-helix proteins and are involved in muscle cell determination and differentiation [42,43]. Interestingly, our gene-network analysis uncovered key transcription factors associated with myogenesis including myogenin and lymphoid enhancer-binding factor 1 transcription factors related genes (Figure 3). A study in beef cattle has shown that myogenin (MYOG) was up-regulated in cells from Wagyu x when compared to cells from Angus and Hereford [44]. In another study, it has been found that variation in myogenic factor 5 (MYF5), myogenic factor 6 (MYF6) and MYOG genes were associated with growth and carcass traits in pigs [45]. LEF-1 transcription factor is an element of canonical Wnt pathway, which is required to induce myogenesis [46]. In pigs, variation in MYOG has been associated with increased meat production [47].
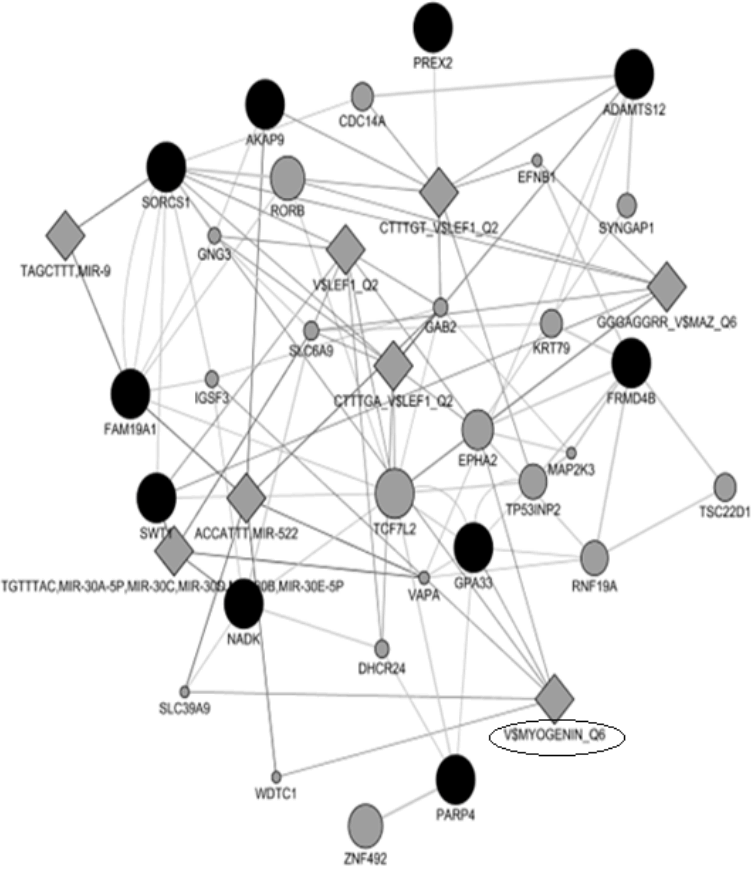
Results of gene networks analysis. Dark and gray circles represent candidate genes and associated genes, respectively.
We did not detect common SNPs with previous studies carried out in Hanwoo cattle [11,24]. The lack of overlap with previous studies might be attributed to the difference in SNP density, population sample size and, and lack of detection power [48,49]. Additionally, in the present study, we used carcass weight of commercial Hanwoo cattle measured at an average age of 31 months, whereas in the previous GWAS, Hanwoo steers of 24 months of age from the progeny-testing program were analyzed [25]. The association of distinct QTL with body weight and growth rates at different developmental stages has been well demonstrated in model and farm animal species [17,18]. The difference in age between our study population and previous studies might have affected to detect common significant loci for carcass weight. Different genes and physiological pathways may contribute to an observed difference in body weight/carcass weight at various developmental stages. Therefore, it will be yet possible to investigate QTLs for carcass weight at different ages and physiological phases in the Hanwoo cattle.
The lack of detection of SNPs that reached the genome-wide significant level is seemingly due to small sample size used in our study. A sufficiently large sample size is required to detect variants that account for a moderate proportion of genetic variance [7]. Therefore, validation of the most significant SNPs using reasonable sample size is required to design SNP-assisted selection program in commercial Hanwoo cattle. Yet, some of the SNPs identified in this study may help to understand the molecular mechanisms that determine beef production in Hanwoo cattle.
ACKNOWLEDGMENTS
This research was supported by the grants of Chungbuk Industry University Cooperation Institute in 2016 and “Leaders in Industry-university Cooperation +” project by the Ministry of Education and National Research Foundation of Korea.
Notes
CONFLICT OF INTEREST
We certify that there is no conflict of interest with any financial organization regarding the material discussed in the manuscript. Ku J, Seo S are employees of Turbosoft Inc..