Effect of dietary net energy concentrations on growth performance and net energy intake of growing gilts
Article information
Abstract
Objective
This experiment investigated the effect of dietary net energy (NE) concentrations on growth performance and NE intake of growing gilts.
Methods
Five diets were formulated to contain 9.6, 10.1, 10.6, 11.1, and 11.6 MJ NE/kg, respectively. A metabolism trial with 10 growing pigs (average body weight [BW] = 15.9±0.24 kg) was conducted to determine NE concentrations of 5 diets based on French and Dutch NE systems in a 5×5 replicated Latin square design. A growth trial also was performed with five dietary treatments and 12 replicates per treatment using 60 growing gilts (average BW = 15.9±0.55 kg) for 28 days. A regression analysis was performed to predict daily NE intake from the BW of growing gilts.
Results
Increasing NE concentrations of diets did not influence average daily gain and average daily feed intake of growing gilts. There was a quadratic relationship (p = 0.01) between dietary NE concentrations and feed efficiency (G:F), although the difference in G:F among treatment means was relatively small. Regression analysis revealed that daily NE intake was linearly associated with the BW of growing gilts. The prediction equations for NE intake with the BW of growing gilts were: NE intake (MJ/d) = 1.442+(0.562×BW, kg), R2 = 0.796 when French NE system was used, whereas NE intake (MJ/d) = 1.533+(0.614×BW, kg), R2 = 0.810 when Dutch NE system was used.
Conclusion
Increasing NE concentrations of diets from 9.6 to 11.6 MJ NE/kg have little impacts on growth performance of growing gilts. Daily NE intake can be predicted from the BW between 15 and 40 kg in growing gilts.
INTRODUCTION
Net energy (NE) is well known to be a better expression of available energy in diets for pigs than digestible energy (DE) or metabolizable energy (ME) because NE reflects the closest true available energy value [1]. Therefore, there has been an increasing focus on pig diets formulated based on the French [2] or Dutch NE system [3]. Recently, the NRC [4] also incorporated these NE systems into the swine feeding standard [5].
The advantage of NE system over DE or ME system in diet formulation is that NE values pro vide a better prediction of pig performance, which become more obvious if diets are formulated with ingredients containing highly various concentrations of protein and fiber [1,5]. Thus, many countries have chosen NE systems over DE or ME systems in swine diets. However, a lack of information regarding the effect of dietary NE concentrations on pig performance retards rapid and widespread adoption of NE systems. Moreover, energy intake is considered a key driving force of pig growth and has been used to recommend energy concentrations of diets [4]. However, much of the data concerning energy intake in pigs is based on DE or ME [4,6], whereas the information is scarce regarding the effect of different NE concentrations of diets on NE intake for growing gilts.
Therefore, the objective of the current experiment was to de termine the effect of varying NE concentrations of diets on growth performance of growing gilts. In addition, the possibility of predicting daily NE intake from the body weight (BW) of growing gilts was tested.
MATERIALS AND METHODS
Dietary treatments
Two experiments were conducted, and the Institutional Animal Care and Use Committee at Chung-Ang University reviewed and approved the protocols for both experiments. The ingredients and nutrient compositions of the experimental diets are presented in Table 1. The diets were formulated to contain increasing NE concentrations using published NE values for each ingredient adopted from Sauvant et al [7]. Increasing NE concentrations of diets were achieved by increasingly substituting corn, fish meal, and soybean oil for wheat, barley, soybean meal, and wheat bran. The gradual change of ingredients was adopted to minimize the potential of ingredient-specific effects on growing pigs [8]. The formulated NE concentrations of five dietary treatments were 9.6, 10.1, 10.6, 11.1, and 11.6 MJ/kg, respectively. The concentrations of standardized ileal digestible (SID) of lysine, methionine+cysteine, threonine, and tryptophan were set across all diets to 1.20, 0.66, 0.71, and 0.20 g/MJ NE, respectively [4]. The concentrations of total phosphorus (P) and calcium (Ca) were 0.59 g/MJ NE and 0.68 g/MJ NE for all diets, respectively [4]. These formulations ensured that nutrients were not limiting factors for the growth of gilts during the experiment. Vitamins and minerals also were included in all diets at the levels that meet or exceed recommended nutrient requirement estimates [4]. All diets were offered as a mash form.
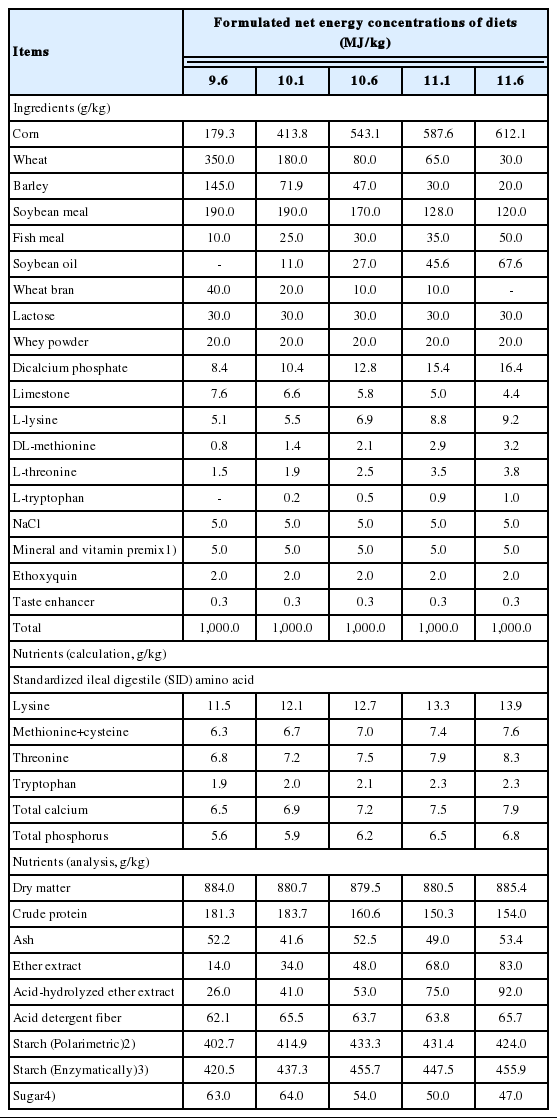
Composition and nutrient content of experimental diets (as-fed basis)
Experiment 1: Metabolism trial
This experiment was designed to measure the DE and ME concentrations and to predict NE concentrations of five treatment diets. Ten growing barrows (Duroc×Landrace×Yorkshire) with 15.9±0.24 kg of initial BW were used. Pigs were allotted to a 5×5 replicated Latin square design with five diets and five periods. Pigs were individually housed in metabolism cages equipped with a feeder and a nipple drinker. Room temperature was maintained at 25°C via a mechanical ventilation system.
Diets were provided at daily levels of 2.5 times the estimated maintenance requirement for energy (i.e., 106 kcal of ME/kg BW0.75) [6] with two equal meals provided at 0800 and 1800 h. The feed allowance was adjusted at the beginning of each period when the BW of each pig was recorded. Pigs had free access to water throughout the experiment. Each period lasted for 10 days. Total collections of urine and feces commenced on the morning of day 6 and finished on the morning of day 11. The initial 5 days were an adaptation period to the diet. On day 6, each pig was fed 5 g of ferric oxide as an indigestible marker in 100 g of diets that were fed in the morning. The remaining portion of the morning diets was offered after all marked diets were consumed. Fecal collection commenced when the marker appeared in the feces. On the morning of day 11, pigs were again offered 100 g of marked diets, as described above, and collection of feces was terminated when the marked feces appeared. Feces were collected twice daily and stored at −20°C. Urine buckets containing 50 mL of 5 N HCl were placed under the metabolism cages to permit total collection. They were collected once daily in the morning. An aliquot of urine sample (10% of total weight) was obtained, strained through cotton gauze and glass wool, and stored at −20°C.
After sample collections, urine samples were thawed and mixed, and a subsample was collected for chemical analysis. Fecal samples were dried at 50°C in a forced-air oven and finely ground prior to chemical analysis. Urine samples were prepared and lyophilized before gross energy (GE) analysis. All samples were analyzed in triplicate. Diets and feces were analyzed for dry matter (DM; Method 930.15) [9], ash (Method 942.05) [9], ether extract (EE; Method 2003.06) [9], acid-hydrolyzed EE (AEE; Method 996.01) [9], acid detergent fiber (ADF; Method 973.18) [9], and crude protein (CP; Method 990.03) [9]. The concentrations of starch in the diet were measured using the Ewers polarimetric method [10] and the amyloglucosidase method [11] for French and Dutch NE system, respectively. The concentrations of total free sugar in the diet were measured using the Luff-schoorl method for French NE system [12]. The enzymatically degraded fraction of total sugar for Dutch NE system was assumed as 73% of total free sugar measured using the Luff-schoorl method [3]. The samples for diets, feces, and urine were analyzed for GE using bomb calorimetry (Model 6400; Parr Instruments Co., Moline, IL, USA) with benzoic acid being used as the calibration standard.
The coefficients of total tract apparent digestibility (CTTAD) of DM, CP, EE, AEE, organic matter (OM), and ADF in diets were calculated by the standard procedures [13]. The DE and ME concentrations of diets were determined [4]. The NE concentrations of diets were predicted using the NRC [4] equations of Eq. 1–7, Eq. 1–8, Eq. 1–9 (French NE system) [2], and Eq. 1–10 (Dutch NE system) [3]:
Where DCP = digestible CP, DEE = digestible EE, DRES = digestible residue, DRES = DOM–(DCP+DEE +starch+DADF), DOM = digestible OM, DADF = digestible ADF, DAEE = digestible AEE, Starcham = enzymatically digestible fraction of starch, Suge = enzymatically degraded fraction of total sugar (= Sugartotal× 0.73), and FCH = Starchferm (assumed to be 0)+Sugferm (= Total sugar – Suge)+DOM–DCP–DAEE– Starcham–Sugartotal×0.95 (= correction factor for disaccharides in feed ingredients). All nutrient and digestible nutrient concentrations were expressed as g/kg DM.
Although all energy values for DE, ME, and NE were expressed as kcal/kg DM in these NRC [4] equations, the resulting caloric values were converted to joule values (MJ/kg, as-fed basis) as expressed as dietary treatments in this experiment. The average NE value (NEaverage) was also calculated by averaging NE7, NE8, and NE9 values predicted from the NRC [4] equations of Eq. 1–7, Eq. 1–8, and Eq. 1–9, respectively. The reason for averaging these three NE values was that they were predicted from the French NE system [2], and Sauvant et al [7] used average NE values for ingredients in their feeding tables. However, the NE10 values were not used to calculate average NE values because they were predicted from the Dutch NE system [3].
Experiment 2: Growth trial
This experiment was conducted to evaluate growth performance and to determine daily NE intake of growing gilts as affected by different NE concentrations of diets that were used in the metabolism trial. A total of 60 growing gilts (Landrace×Yorkshire; average initial BW = 15.9±0.55 kg) were used in a 28-day feeding trial. Pigs were allotted to five dietary treatments with 12 replicates (one pig per replicate) in a completely randomized design. Pigs were individually housed in pens (1.5×1.6 m) that were equipped with a feeder and a nipple drinker. Pigs had free access to diets and water throughout the experiment. Rooms were mechanically ventilated to maintain a minimum temperature of 25°C.
The average daily gain (ADG), average daily feed intake (ADFI), and feed efficiency (gain to feed ratio; G:F) of pigs in each treatment were calculated based on weekly recording of the BW and feed intake (FI) of pigs, but these data were summarized over the entire experimental period. Daily NE intake for each pig (MJ/d) was also calculated based on predicted NE concentrations (NEaverage or NE10, MJ/kg) of diets from Exp. 1 and ADFI (kg/d) of individual pigs from Exp. 2.
Statistical analysis
The data obtained from Exp. 1 were analyzed using the MIXED procedure (SAS Institute Inc., Cary, NC, USA) with the individual pig as the experimental unit. Homogeneity of the variances was verified using the UNIVARIATE procedure of SAS. Dietary treatment was the main effect in the model, whereas pig and period were random effects. However, no significant random effects were observed, and therefore, the random effects were removed from the final model. The LSMEANS procedure was used to calculate mean values. Orthogonal polynomial contrast tests were used to determine the linear and quadratic effects of increasing NE concentrations of diets.
The data obtained from Exp. 2 were analyzed in a manner similar to that of Exp. 1, but in a completely randomized design with the individual pig as the experimental unit. The model included dietary treatment as the main effect with no random variables in the model. In addition, regression analysis was performed to develop prediction equations for daily NE intake (MJ/d) as a function of the BW of pigs. Average BW of pigs between weeks was used to represent the independent variables in the analysis. A probability of p<0.05 was considered significant for all data analyses.
RESULTS
Experiment 1: Metabolism trial
No apparent animal health or technical problems were observed. The CTTAD of DM, OM, and ADF were increased (linear, p< 0.01) with increasing NE concentrations of diets (Table 2). The CTTAD of EE and AEE were also increased (linear and quadratic, p<0.01) as NE concentrations of diets were increased. The CTTAD of CP did not differ among five diets.

The digestible nutrient concentrations of diets were calculated from the total nutrient concentrations of diets and CTTAD of nutrients (Table 3). The digestible CP concentrations of diets were decreased (linear and quadratic, p<0.01) as NE concentrations of diets were increased. Increasing NE concentrations of diets increased digestible EE, digestible AEE (linear and quadratic, p<0.01), OM (linear, p<0.01), and ADF (linear, p<0.05) concentrations of diets.

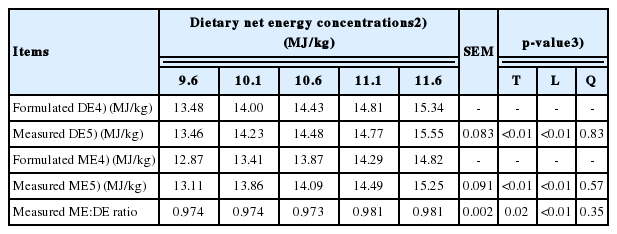
Both measured DE and ME concentrations of diets were increased (linear, p<0.01) as NE concentrations of diets were increased (Table 4). These values were close to formulated values from tabulated DE and ME values for individual ingredients. The ME to DE ratio also was increased (linear, p<0.01) with increasing NE concentrations of diets.
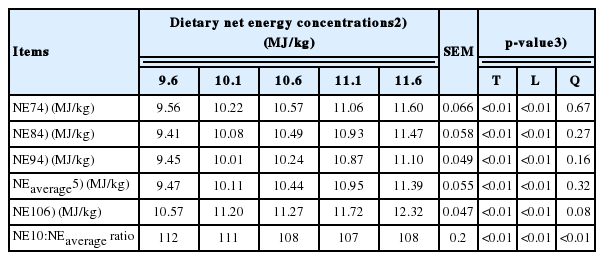
The NE concentrations of diets, which were predicted based on the Eq. 1–7 (NE7), Eq. 1–8 (NE8), and Eq. 1–9 (NE-9) were increased (linear, p<0.01) with increasing NE concentrations of diets (Table 5). The average NE concentrations of diets (NEaverage) from NE7, NE8, and NE9 were also increased (linear, p<0.01) as NE concentrations of diets were increased. Increasing NE concentrations of diets increased (linear, p<0.01) NE concentrations of diets that were predicted from the Eq. 10 (NE10); however, these values were greater than the formulated NE values and NEaverage values. The ratio of NE10 to NEaverage was decreased (linear and quadratic, p<0.01) with increasing NE concentrations of diets.
Experiment 2: Growth trial
No apparent animal health or technical problems were observed. Final BW, ADG, and ADFI were not affected by increasing NE concentrations of diets (Table 6). There was a quadratic relationship (p = 0.01) between G:F and NE concentrations of diets; however, the difference in G:F among the treatment means was relatively small.

The linear regression equation of predicting daily NE intake (MJ/d) from NEaverage of diets (French NE systems) and ADFI as a function of BW was NE intake = 1.442+0.562×BW (n = 240, R2 = 0.796, p<0.01; Figure 1), whereas NE intake = 1.533+0.614×BW (n = 240, R2 = 0.810, p<0.01; Figure 2) when NE10 values (Dutch NE system) were used to represent dietary NE concentrations. Quadratic regression analysis was also conducted. However, a goodness of fit for the model (R2) was almost identical to the linear regression model, and therefore, quadratic regression equation was not reported herein.
DISCUSSION
The observation that increasing NE concentrations of diets increased the values for the CTTAD of DM, OM, ADF, EE, and AEE is likely related to differences in the inclusion levels of lipid and fiber ingredients. Inclusion levels of soybean oil were increased to achieve increasing NE concentrations of diets, whereas those of fiber ingredients such as wheat bran were concurrently reduced in this experiment. It is suggested that inclusion of lipids in diets slows the rate of digesta passage in the gastrointestinal tract, and as a consequence, improves the digestibility of other dietary components [14–16]. On the other hand, decreasing inclusion levels of fiber ingredients in diets have been reported to increase CTTAD of nutrients [17,18].
Decreasing CP concentrations of diets were achieved in diet formulation by increasing NE concentrations of diets, which are expected to decrease the CTTAD of CP owing to the greater contributions of endogenous losses of CP to the CTTAD of CP in low CP diets than in high CP diets [19]. However, no differences in the CTTAD of CP were observed in this experiment. Thus, we speculated that no differences in the CTTAD of CP among diets may be due to the fact that positive effects of increasing inclusion of lipids and concomitant decreasing inclusion of fiber ingredients on the CTTAD of CP ameliorate the reduction in the CTTAD of CP by decreasing CP concentrations of diets. In addition, the curvilinear increase in the CTTAD of EE and AEE with increasing NE concentrations of diets was in accordance with previous observations [20,21], and it is likely due to reduced effects of endogenous losses of EE and AEE on total EE and AEE excretion in feces as lipid concentrations of diets were increased [20,21].
The measured DE and ME concentrations of five diets were similar to the formulated DE and ME concentrations of diets, which were based on tabulated DE and ME concentrations of individual ingredients of the diets [7]. As expected, increasing inclusion of lipid ingredients high in DE and ME and decreasing inclusion of fiber ingredients low in DE and ME resulted in an increase in the measured DE and ME concentrations of diets. In addition, increasing NE concentrations of diets increased the measured ME:DE ratio of diets, which is likely associated with increasing lipid concentrations and decreasing CP concentrations of diets [22].
Increasing NE concentrations of diets linearly increased pre dicted NE7, NE8, and NE9 values and these values were similar although different prediction equations were used, indicating that NE values predicted from all three NE equations of NRC are comparable [4]. The NEaverage values were also close to those of the formulated NE concentrations of diets, which were based on tabulated NE concentrations of ingredients used for diets [7]. This is likely because tabulated NE values for ingredients were also predicted from the similar NE equations [2,7].
The values for NE10 of diets were greater than the values for NE7, NE8, NE9, and NEaverage of diets. This result agrees with the results of previous experiments [5,23] in which values predicted from the equation of Blok [3] appeared to be greater than those predicted from the equations of Noblet et al [2]. This discrepancy can be attributed to differences in the concept of carbohydrate utilization of pigs and in the analytical procedure of lipids [5,23]. These NE prediction equations adopt digestible nutrient concentrations of feed ingredients to estimate the NE values for diets and ingredients in a similar manner [5,24]. However, Blok [3] separated total digestible carbohydrates (i.e., starch and sugar) into an enzymatically-digestible portion and a fermentable portion due to the different energetic efficiencies of carbohydrates utilized in the small intestine vs. the large intestine of pigs. In addition, Blok [3] proposed the regression coefficient (= 8.54) for digestible lipids in the NE equation based on the CTTAD of lipids calculated with both diet and fecal AEE concentrations, whereas Noblet et al [2] generated the regression coefficient (= 8.37) based on the CTTAD of lipids calculated with feed EE but fecal AEE concentrations.
It was expected that the ranking of NE values for the 5 diets predicted from either Noblet et al [2] or Blok [3] would be similar in this experiment because the relative contributions of different digestible nutrient fractions appear to be comparable in the NE equations [5]. Interestingly, increasing NE concentrations of diets decreased the ratio of NE10 to NEaverage. This result is most likely a consequence of increasing lipid concentrations of diets for increasing NE concentrations of diets.
It has long been recognized that growing pigs generally try to consume feed or energy to satisfy their energy requirements for maintenance and growth, and therefore, if energy concentrations of diets are increased, voluntary FI of pigs will decline [25–27]. However, it was reported that young pigs weighing less than 20 kg had a limited ability to control FI in response to decreasing energy concentrations of diets, mainly due to limited physical gut capacity [28]. On the other hand, growing pigs from 20 to 50 kg BW had a greater ability to adjust their FI to different energy concentrations of diets than young pigs if DE concentrations of diets exceeded 14 MJ DE/kg (assumed to be 9.94 MJ NE/kg; NE = 0.71×DE) [28]. Similar results were also reported by Beaulieu et al [8] who observed a linear decrease in the FI of pigs during the growth period of 30 to 50 kg BW as DE of diets was increased from 13.6 to 14.9 MJ DE/kg (assumed to be 9.7 to 10.6 MJ NE/kg; NE = 0.71×DE) [2]. In the current experiment, however, increasing NE concentrations of diets from 9.6 to 11.6 MJ NE/kg did not affect the ADFI of growing gilts. This result was in agreement with observations by Oresanya et al [29] who reported that the ADFI was not affected by increasing NE concentrations of diets from 9.2 to 10.1 NE MJ/kg during the initial growing period (from 9.5 to 25.0 kg BW) of weanling barrows. Kil et al [14] also observed no differences in the ADFI of growing pigs between 20 and 50 kg BW if diets containing increasing NE concentrations by inclusion of soybean oil were provided. The reason for these conflicting results is not clear; however, it may be associated with variations in experimental conditions including environment (temperature, group size etc.), animals (age, genotype, health etc.), and diets (nutrient concentrations, ingredient sources etc.) as demonstrated by Nyachoti et al [25]. For instance, pigs used in this experiment and other experiments [14,29] were raised individually, and thus may have the greater FI because of unlimited access to feeds [14,25,26], which may affect the ability to regulate FI in response to different NE concentrations of diets. In this experiment, increasing NE concentrations of diets were achieved by increasing inclusion of fish meal and soybean oil in the diets while concomitantly reducing inclusion of soybean meal and wheat bran. This approach may inadvertently increase the palatability of the diets to pigs [30], which may offset the reduction in FI that results from increasing NE concentrations of diets.
The observation that increasing NE concentrations of diets had no effects on the ADG of growing gilts may be a result of the lack of a difference in the ADFI among pigs fed 5 dietary treatments. This result agreed with previous experiments using weanling barrows [29] and growing pigs [14,31–33]. Increasing NE concentrations of diets increased the concentrations of SID of essential amino acid (AA) as well as those of total Ca and P to maintain a constant ratio of AA, Ca, and P to NE (g/MJ) [4], and all diets were formulated to provide nutrients in excess of the requirement for this stage of pigs. This diet formulation was based on the assumption that FI will be decreased proportionally as NE concentrations of diets were increased, ensuring that other nutrients were not limited for pig growth [26]. However, we failed to detect differences in FI, indicating that growing gilts used in this experiment were not limited in the supply of any nutrient for growth across different NE concentrations of diets. This result further suggested that nutrient concentrations of diets containing 9.6 NE/kg, which contained the least amounts of energy and nutrients, may be sufficient to maintain proper growth of growing gilts housed individually.
Increasing energy concentrations of diets have been typically known to improve G:F in pigs by decreasing ADFI and/or increasing ADG [8,27]. However, this notion is not always warranted, owing to various animal and environmental factors affecting FI and the utilization of energy and nutrients in pigs’ bodies. Several previous experiments reported no effects of increasing NE concentrations of diets on the G:F of weanling pigs [29] and growing pigs [14,31,34]. However, the current experiment showed a quadratic relationship between NE concentrations of diets and G:F. Growing gilts fed diets containing 11.6 MJ NE/kg tended to have greater G:F than those fed diets containing 10.1 or 10.6 MJ NE/kg, whereas other pigs fed diets containing 9.6 or 11.1 MJ NE/kg showed intermediate value for G:F. This result was difficult to be explained because final BW, ADG, and ADFI did not differ among dietary treatments and there were no apparent issues with animal health or technical problems. We speculated, therefore, that this quadratic relationship may be due to an unexpectedly greater G:F for pigs fed diets containing 9.6 MJ NE/kg with unknown reasons, whereas there was an increasing tendency for G:F as NE concentrations of diets were increased from 10.1 to 11.6 MJ NE/kg, which was supported by the general relationship between energy concentrations of diets and the G:F of pigs [8,27].
The energy intake is an important factor affecting growth per formance of pigs, and it is also used to determine recommended energy concentrations of diets if FI is predicted accurately [4]. Most prediction equations for energy intake have been established based on DE [6] or ME [4] with an asymptotic relationship to the wide range of BW between 15 and 110 kg [6] or between 20 and 140 kg [4]. To our knowledge, however, there has been limited information regarding NE intake predicted from the BW of young gilts, specifically for the growing phase although NE is superior to DE or ME for predicting pig performance [1,5]. In the present study, therefore, daily NE intake as a function of the BW for growing gilts between 15 and 40 kg BW was predicted from the data for ADFI and predicted NE concentrations (i.e., NEaverage and NE10) derived from NRC [4] NE equations [2,3], and the average BW of individual pigs measured weekly. As a goodness of fit for the regression model, the R2 values for both regression equations of NEaverage intake and NE10 intake were relative high (i.e., near to 0.80). According to NRC [4], daily NE intake was estimated to be 16.38 MJ NE for growing pigs between 25 and 50 kg, and this value was comparable to 16.90 MJ NE for pigs of 27.5 kg BW predicted from the regression equation of NEaverage intake in the current experiment. However, daily NE intake was 18.42 MJ NE based on the regression equation of NE10 intake for pigs of 27.5 kg BW. The greater NE intake based on NE10 rather than NEaverage was expected due to greater NE10 values than NEaverage values. It is suggested, therefore, that both equations can reasonably be used to predict daily NE intake as a function of the BW of growing gilts. However, a similar regression analysis for finishing gilts between 40 and 80 kg was performed in our previous experiment [23], but R2 values for the regression equations were very low (i.e., less than 0.37). Thus, we suggest that daily NE intake can be predicted solely from the BW of growing gilts, but this has little reliability for finishing gilts.
In conclusion, formulated NE concentrations of diets based on NE concentrations of ingredients are close to predicted NE concentrations of diets using NRC [4] NE equations (French NE system), although formulated NE concentrations of diets in this experiment vary largely. Increasing NE concentrations of diets have little effect on growth performance of growing gilts. Daily NE intake for growing gilts can be predicted from the BW of pigs between 15 and 40 kg.
ACKNOWLEDGMENTS
This work was carried out with the support of “Cooperative Research Program for Agriculture Science and Technology Development (Project No. PJ01181801)”, Rural Development Administration, South Korea. This research was also supported by the Chung-Ang University Research Scholarship Grants in 2017.
Notes
CONFLICT OF INTEREST
We certify that there is no conflict of interest with any financial organization regarding the material discussed in the manuscript.