Effects of particle size and adaptation duration on the digestible and metabolizable energy contents and digestibility of various chemical constituents in wheat for finishing pigs determined by the direct or indirect method
Article information
Abstract
Objective
This experiment was conducted as a 3×2×2 factorial design to examine the effects of particle size (mean particle size of 331, 640, or 862 μm), evaluation method (direct vs indirect method) and adaptation duration (7 or 26 days) on the energy content and the apparent total tract digestibility (ATTD) of various chemical components in wheat when fed to finishing pigs.
Methods
Forty-two barrows (Duroc×Landrace×Yorkshire) with an initial body weight of 63.0±0.8 kg were individually placed in metabolic cages and randomly allotted to 1 of 7 diets with 6 pigs fed each diet. For the indirect method, the pigs were fed either a corn-soybean meal based basal diet or diets in which 38.94% of the basal diet was substituted by wheat of the different particle sizes. In the direct method, the diets contained 97.34% wheat with the different particle sizes. For both the direct and indirect methods, the pigs were adapted to their diets for either 7 or 26 days.
Results
A reduction in particle size linearly increased the digestible energy (DE) and metabolizable energy (ME) contents as well as the ATTD of gross energy, crude protein, organic matter, ether extract (EE) and acid detergent fiber (ADF) (p<0.05), and had a trend to increase the ATTD of dry matter of wheat (p = 0.084). The DE, ME contents, and ATTD of gross energy, crude protein, dry matter and organic matter were higher (p<0.05) when determined by the direct method, but the ATTD of ADF, EE, and neutral detergent fiber were higher when determined by the indirect method (p<0.05). Prolongation of the adaption duration decreased the ATTD of neutral detergent fiber (p<0.05) and had a trend to increase the ATTD of EE (p = 0.061). There were no interactions between particle size and the duration of the adaptation duration. The ATTD of EE in wheat was influenced by a trend of interaction between method and adaptation duration (p = 0.074). The ATTD of ADF and EE in wheat was influenced by an interaction between evaluation method and wheat particle size such that there were linear equations (p<0.01) about ATTD of ADF and EE when determined by the direct method but quadratic equations (p = 0.073 and p = 0.088, respectively) about ATTD of ADF and EE when determined by the indirect method.
Conclusion
Decreasing particle size can improve the DE and ME contents of wheat; both of the direct and indirect methods of evaluation are suitable for evaluating the DE and ME contents of wheat with different particle sizes; and an adaptation duration of 7 d is sufficient to evaluate DE and ME contents of wheat in finishing pigs.
INTRODUCTION
Understanding the factors that affect the digestibility of feedstuffs and estimating their nutritional value are critically important for the swine industry [1]. Apparent total tract digestibility (ATTD) of nutrients is traditionally assessed by either the total collection method (TC) or indicator method (IM) [2], and the IM purportedly results in similar digestibility values as the TC method [3,4]. However, less research was done to compare the direct and indirect methods when evaluating the digestibility of feedstuffs. The digestibility of energy in a cereal grain with a high protein level can be determined by feeding it directly to animals along with a vitamin and amino acid premix (i.e. the direct method) [2]. However, wheat is conventionally used around 30% in diets fed to growing-finishing pigs [5]. Therefore, the difference method (i.e. the indirect method) may be more applicable to evaluate the digestible energy (DE) and metabolizable energy (ME) contents of wheat because it is closer to the production practice.
Reducing the particle size of cereal grains has been shown to be beneficial in improving the feed efficiency of grains for pigs. Although grinding would not impact the chemical composition of the feed, changes in its particle size would affect physical characteristics and thus, the feeding values of grains. It could be explained that finely ground grain increases particle surface, therefore, nutrients are more accessible for digestive enzymes [6]. Moreover, gastric emptying rates were significantly faster when fed finely ground grains compared with coarsely ground one [7]. Thus, feeding finely ground diets for a prolonged duration also raised the risk for development of gastric ulcers [8].
When pigs are fed a new diet consisting of different feedstuff or different nutrients because either of entering into a new growth stage or meeting some special experimental requirement, it will lead to changes in fermentation activity of the cecal microbiota and in composition of the microbiota over time, which will also change the digestive enzymes that break down feed [9]. Moreover, because the palatability of wheat is less than a corn-soybean meal diet, and wheat mucedin might damage the gastrointestinal health, the intake of wheat over a long time is likely to influence the energy and nutrients digestibility. Therefore, adaptation of intestinal microflora associated with the prolongation of the adaptation duration is another factor that might affect diet digestion.
The objective of this study was to investigate the influence of particle size and the duration of the adaptation duration on the digestibility of various chemical constituents in wheat fed to finishing pigs as determined with the direct or indirect methods. The hypotheses tested in this experiment were: i) DE, ME and the digestibility of the chemical constituents in wheat would be higher when determined by the direct method because of the higher components contribution providing by wheat and lower acid detergent fiber (ADF) contents in diets; ii) DE, ME and digestibility of nutrients will be improved by decreasing particle size; iii) DE, ME, and digestibility of wheat was similar after a 26 d adaptation compared with 7 d of adaptation, because of the positive effect of digestive enzymes and the contrary effect of wheat mucedin.
MATERIALS AND METHODS
Animal care
The experimental protocol used in this study was approved by the Institutional Animal Care and Use Committee of China Agricultural University (Beijing, China). This study was conducted in the Metabolism Laboratory of the Fengning Pig Experimental Base (Hebei Province, China). Wheat was sourced from the Henan province of China during the 2012 through 2013 harvest season and stored for 9 months in a warehouse located at the Fengning Pig Experimental Base and exposed to normal ambient season temperature variations before being used in the experiment.
Experimental design and animals
This experiment was conducted as a 3×2×2 factorial design to examine the effects of particle size (mean particle size of 331, 640, or 862 μm), evaluation method (direct vs indirect method) and adaptation duration (7 or 26 days) on the DE and ME contents and the ATTD of various chemical components in wheat when fed to finishing pigs. The wheat was ground by a hammer mill (FAMSUN SFSP 56×40, Jiangsu, China) using a 1.5, 2.5, or 4.0 mm screen, resulting in a geometric mean particle size of 331, 640, or 862 μm respectively (Table 1). Table 1 shows the particle size and chemical composition of the wheat.
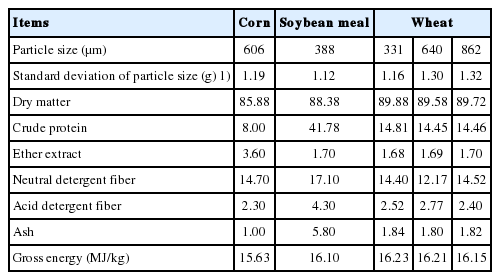
Chemical analysis of ingredients (%, as-fed)
Forty-two barrows (Duroc×Landrace×Yorkshire) with an initial body weight of 63.0±0.8 kg were individually placed in metabolic cages and randomly allotted to 1 of 7 treatments with 6 replications per treatment. In the indirect method, the pigs were fed either a basal diet based on corn-soybean meal or diets in which 38.94% of the basal diet was substituted by wheat of the different particle sizes. In the direct method, the diets contained 97.34% wheat with the different particle sizes. The ingredient composition and chemical analysis of the experimental diets are presented in Table 2. For both the direct and indirect methods, the pigs were adapted to their diets for either 7 or 26 days. After a 7-d adaptation duration, a 5-d total collection of feces and urine was conducted. Then pigs were fed the same diets for another 14 d, and subsequently another 5-d total collection of feces and urine was conducted. That made 7 and 26 d adaptation duration respectively and the two samples were analyze independently.

Ingredient and analyzed chemical composition and particle size of the experimental diets (%, as-fed)
The pigs were individually housed in stainless steel metabolic crates (1.4×0.7×0.6 m3) and feeders were located at the front of each metabolic crate with a nipple waterer located at the side of the crate to provide ad libitum access to water. The room temperature was maintained at 20°C±1°C. Pigs were fed at 3% of their initial body weight determined 1 day before the beginning of the trial. The daily feed allotment was divided into two equal meals p ovided at 8:00 and 15:00 h. All diets were fed in mash form. Vitamins and minerals were added to meet or exceed the requirement estimates for finishing pigs (NRC [10]). Pigs were fed experiment diets starting from 15:00 on d 1.
Sample collection
Feed refusals and feed spillages were collected, dried and weighed to calculate feed intake. After 7-d and 26-d adaptation duration, feces and urine were collected from 17:00 of d 8 to 17:00 of d 13 and from 17:00 of d 27 to 17:00 of d 32 respectively. Feces were collected immediately as they appeared in the metabolic crates, placed in plastic bags and stored at −20°C. Urine was collected in a bucket placed under the metabolic crates. The bucket contained 10 mL of 6 N HCl for every 1,000 mL of urine to avoid the loss of N. Each day, the total urine volume was measured, then a 10% aliquot of urine was filtered through gauze and pooled together per pig, and 50 mL of the mixed urine samples were transferred into a screw-capped tube and stored at −20°C. At the end of the collection period, the sampled feces and urine were pooled for each pig and diet, and sub-samples were collected for chemical analysis. Fecal samples were dried for 72 h at 65°C and ground through a 1-mm screen for laboratory analysis. Each 4-mL urine sample was absorbed by the filter paper in the crucible and dried for 8 h at 65°C for energy analysis [11].
Chemical analysis
All chemical analyses were conducted in duplicate. Samples of wheat, diets, and feces were analyzed for dry matter (DM; method 930.15, AOAC [12]), ether extract (EE; Thiex et al [13]), crude protein (CP; method 984.13, AOAC [12]), ash (method 942.05, AOAC [12]), calcium (method 927.02, AOAC [12]), and total phosphorus (method 984.27, AOAC [12]). Moreover, organic matter (OM) (%) wye as analyzed as 100 minus the content of ash and water. The neutral detergent fiber (NDF) and ADF were determined using fiber filter bags and fiber analyzer equipment (Fiber Analyzer, Ankom Technology, Macedon, NY, USA) following the procedure described by Van Soest et al [14]. Samples of wheat, diets, feces, and urine were analyzed for gross energy (GE) via an Isoperibol Oxygen Bomb Calorimeter (Parr 6400 Calorimeter, Moline, IL, USA).
Calculations
Energy values determined from the excretion of GE in the feces and urine were subtracted from the intake of GE to calculate DE and ME for each diet [2,15]. The digestibility of the chemical constituents were calculated using the following equation: Digestibility (%) = (Cinput–Coutput)/Cinput×100, where Cinput and Coutput are the amount of component ingested and voided via the feces, respectively [16]. In the direct method, the DE and ME contents in the wheat diets were divided by 0.9734 to calculate the DE and ME of the wheat itself. In the indirect method, the ATTD of chemical components in wheat were calculated by the difference method according to Adeola [2].
Statistical analysis
Data were analyzed using PROC MIXED (SAS Version 9.2, Cary, NC, USA) as a split plot with the main unit in a completely randomized design with a 3×2×2 factorial arrangement of treatments. The experiment unit was the pig. The initial linear models included effects of particle size (fixed), method of evaluation (fixed), particle size×method interaction (fixed), pig nested in particle size and method of evaluation (random, main unit error), time of adaptation (fixed), time×particle size (fixed), time×method (fixed), time×particle size×method (fixed) and a random residual error. Linear models were reduced according to standard model reduction conventions. Generally, time of adaptation effects and associated interactions were not important and removed from the final models. Digestibility estimates were regressed on particle size using initial linear models including both linear and quadratic components. Heterogeneity of regression was tested where interactions of particle size and method of evaluation occurred in the analyses fitting particle size as a classification variable. The level of significance adopted was p<0.05 while 0.05≤p<0.10 was considered as indicative of a trend.
RESULTS
Effects of particle size and adaptation duration on the coefficient of apparent total tract digestibility and the energy contents of wheat
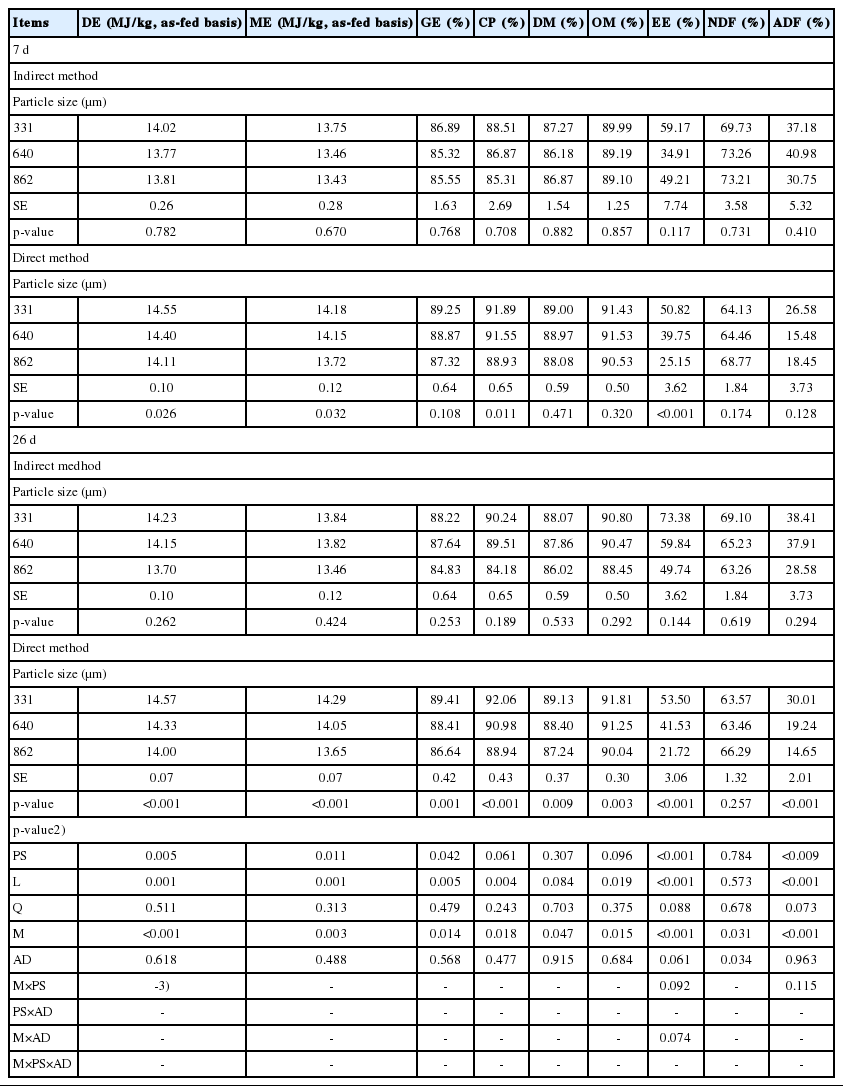
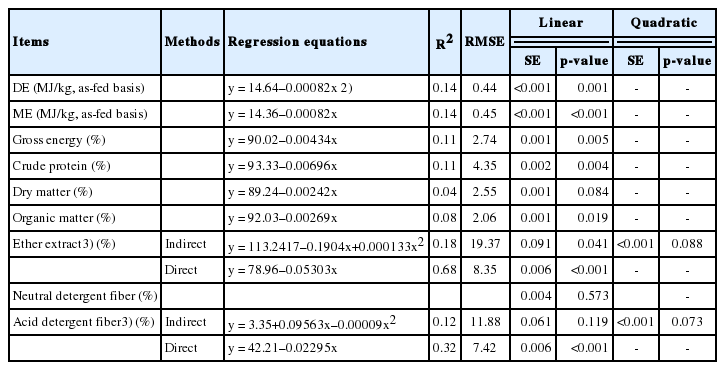
Grinding changed the particle size of wheat (Table 1) but had no influence on its chemical composition. Reducing particle size from 862 to 331 μm linearly increased DE and ME as well as the ATTD of GE, CP, OM, EE, and ADF (p<0.05) and had a trend to increase ATTD of DM (p = 0.084; Table 3). The prolongation of the adaptation duration decreased the ATTD of NDF (p<0.05) and had a trend to increase the ATTD of EE (p = 0.061). There were no interactions between particle size and adaptation duration. The regression equations of DE, ME and chemical components digestibility of wheat for finishing pigs on different particle size are shown in Table 4. The linear slopes of DE, ME, and ATTD of GE, CP, OM, EE, and ADF (in direct method) regression equations of wheat were significant (p<0.05).
Effects of evaluation method on the coefficient of apparent total tract digestibility and energy contents of wheat
The DE and ME as well as the ATTD of GE, CP, DM, and OM of wheat determined by the direct method were higher (p<0.05) than those determined using the indirect method (Table 3). The ATTD of EE, ADF, and NDF of wheat determined by the direct method were lower (p<0.05) than those determined with the indirect method. The ATTD of EE in wheat was influenced by a trend of interaction between method and adaptation duration (p = 0.074). The ATTD of ADF and EE in wheat was influenced by an interaction between wheat particle size and method (Table 4), such that there were linear equations (p<0.01) about ATTD of ADF and EE when determined by the direct method but quadratic equations (p = 0.073 and p = 0.088, respectively) when determined by the indirect method. The direct method and corresponding regression equations are more appropriate for predicting the digestibility of EE and ADF because of higher R2 and lower root mean square errors compared with indirect method.
DISCUSSION
Effects of particle size
A reduction in particle size increased the DE and ME as well as the ATTD of various chemical constituents in wheat in this experiment. These results are in agreement with former reports [17,18], suggesting that the feeding value of wheat-based diets can be improved as the particle size of the diet decreased. Sao et al [19] reported that as the particle size of wheat reduced from 670 to 330 μm, the in vitro digestibility of DM and CP increased linearly, but as the experiment in growing pigs demonstrated, as particle size reduced, apparent digestibility of N increased first and then decreased. DeJong et al [20] reported that decreasing wheat particle size (730, 580, or 330 μm) resulted in a quadratic improvement in caloric efficiency and a linear improvement in ATTD of DM and GE of diets in finishing pigs. Likewise, a reduction of particle size of wheat-based diets from 600 to 400 μm increased digestibility of DM and N in finishing pigs [8]. The relationships of DE, ME, and ATTD of various chemical constituents in wheat with small particle size might be due to the disruption of the aleurone layer, which consists of pentosans and cannot be broken down by monogastric animals, thus making inaccessible nutrients available for digestion [8,21]. Moreover, another explanation was that the small particle size could provide a greater surface area exposed to enzymatic attack [22]. Wondra et al [18] reported that reducing particle size of corn in corn-soybean meal-based diets from 1,000 to 400 μm increased ATTD of GE by 7%, and improved nutrient digestibility in finishing pigs. In consequence, as the particle size reduced appropriately, the energy contents and digestibility of nutrients increased.
Effects of adaptation duration
Prolongation of adaptation duration had no influence on DE, ME, and the ATTD of nutrients except NDF. It could be concluded that 7 d is enough for finishing pigs to adapt a new diet. The reason why prolonged adaptation duration decreased NDF digestibility might need more research. These results are not consistent with Kim et al [23], who reported that a 21-d adaptation can increase the digestibility of CP in a wheat diet fed to weaning pigs compared with a 7-d adaptation. It could be concluded that the older pigs need less adaptation duration compared with the younger pigs when they are fed to a new feed. In addition, Li et al [24] reported that lower apparent ileal digestibility (AID) of CP and amino acids were observed in adapted birds (7 to 21 d) compared to unadapted birds (19 to 21 d) which were affected by dietary factors, including Ca and non-phytate P. Changing the diet of pigs requires time for the microflora and gastrointestinal tract itself to adapt to the new substrates and the new absorbable products. When an adaptation duration is sufficient for fecal inocula of pigs to reach a stable microbial composition, the digestibility of nutrients tends to be stable as well. Cunningham et al [25] reported that growing pigs fed solka-floc for 15 weeks were not better adapted to digest the fiber source than pigs that received it for 1 week. The duration in which the gastrointestinal processes in growing pigs completely adapt to a new diet is usually longer for a high fiber diet than for a low fiber diet [26]. In this study, there was no significant difference between DE, ME, and digestibility of GE, CP, DM, OM, EE, and ADF after 7 d or 26 d, so the length of adaptation duration (7 or 26 d) does not appear to have effect on energy value of wheat and it meant that an adaptation of 7 d is sufficient to evaluate the DE and ME contents and digestibility of various chemical constituents of wheat in finishing pigs.
Effects of evaluation method
The DE, ME contents and digestibility of wheat was significantly different when determined with the direct than the indirect method in this experiment. Nevertheless, the deviation between them was less than 3%. Therefore, it could be considered that different methods had little effect on DE and ME contents and digestibility of nutrients when it was applied in practical production. A basic assumption in the use of the indirect method is that there is no interaction between the basal diet and the test ingredient [27]. To estimate DE accurately, a substitution rate more than 20% must be used because the higher substitution rate resulted in the lower standard error of the ingredient energy value [28]. Villamide et al [29]compared different evaluation methods for grape pulp fed to rabbits and found the energy value obtained by the direct method was significantly higher than by substitution method (the substitution rates were 10%, 20%, and 30%), but the digestible CP was not significantly different between those two methods. Conversely, Bolarinwa and Adeola [30] reported that values obtained for DE and ME of wheat using the direct method (96.9% wheat) did not differ from those obtained using the indirect method (the substitution rates were 30% and 60%). This might be attributed to the fact that the DM and energy digestibility of wheat were similar to that of the basal diet. Similarly, Liu et al [31] found there were no significant differences in DE, ME, and NE of corn fed to growing pigs determined using the direct and indirect methods. However, the content of corn in the experiment of Liu et al [31] was similar in the two evaluation methods (97.34% direct method vs 82.50% indirect method). Fan and Sauer [32] reported a greater AID of CP and some amino acids for barley determined by indirect method (the substitution rate was 67.5%) compared with direct method (90%), but there were no difference between direct (42.7%) and indirect (the substitution rate was 36.6%) method when canola meal were determined. It seemed that the reliability of the determination of AID values of CP and amino acids with the difference method is dependent on the contributions of amino acids in the assay feedstuff to their dietary contents, In our experiment, the content of wheat was 97.34% in direct method and 38.94% in indirect method, which indicated that diets used for indirect method contained a greater amino acids contents but there was a lower amino acids contribution provided by wheat compared with that of direct method. Moreover, in indirect method, diets contained a higher ADF, which might result in an increase in the endogenous losses of the amino acids [33] and induce to the descent of nutrients digestibility. That might be the reason that the DE, ME, and ATTD of CP as well as other majority nutrients of wheat determined by direct method were greater than that of indirect method. Furthermore, there were large decreases in the standard errors of DE and ME and ATTD of various nutrients by direct method compared with indirect method. In addition, the CP content of wheat is between barley and canola meal, so different feedstuffs have different nutritional digest characteristics which might be another reason to explain this phenomenon. Overall, in present research, there were little difference between the direct and indirect methods on the DE and ME contents of wheat. Therefore, the indirect method could be used, especially in situations when the direct method is not suitable.
ACKNOWLEDGMENTS
This research was financially supported by the Special Public Sector Fund in Agriculture (200903006) and the 111 Project (B16044).
Notes
CONFLICT OF INTEREST
We certify that there is no conflict of interest with any financial organization regarding the material discussed in the manuscript.