Growth Performance and Carcass Characteristics of Korean Native Ducks Fed Diets with Varying Levels of Limiting Amino Acids
Article information
Abstract
There are multiple experiments conducted with male Korean native ducks (KND) to evaluate the optimal levels of limiting amino acids (AA). In Exp. 1, a total of 450 one-d-old male KNDs were divided into five groups with six replicates and fed experimental diets with varying levels of lysine, total sulfur amino acids (TSAA) and threonine (T1, 0.90/0.74/0.70%; T2, 1.00/0.82/0.77%; T3, 1.10/0.90/0.85%; T4, 1.20/0.98/0.93%; T5, 1.30/1.07/1.01%) to 21 d of age. In Exp. 2, one-d-old male KND were received and fed commercial starter diet from hatching to 21 d of age, and then divided into five groups with six replicates and fed one of five diets varying levels of lysine, TSAA, and threonine (T1, 0.73/0.62/0.54%; T2, 0.80/0.68/0.60%; T3, 0.87/0.74/0.65%; T4, 0.94/0.80/0.70%; T5, 1.01/0.86/0.75%) during 22 to 56 d of age, respectively. The BW gain was linearly increased as dietary limiting AA levels increased to 1.20% lysine, 0.98% TSAA and 0.93% threonine. There were no significant differences in feed intake, gain:feed and uniformity among groups. In Exp. 2, the BW gain and gain:feed were not affected by dietary limiting AA levels. There were no significant differences in carcass characteristics and meat quality among groups. The growth performance and carcass characteristics did not show the significant response to increasing dietary limiting AA levels in KND during 22 to 56 d of age. In conclusion, the levels of lysine, TSAA and threonine necessary to maximize growth for starter phase were at least 1.20%, 0.98%, and 0.93%, respectively. On the other hands, KND require relatively low levels of limiting AA for late growth and carcass yield. The dietary levels of 0.73% lysine, 0.62% TSAA and 0.54% threonine appear to be adequate during growing phase.
INTRODUCTION
Korean native ducks (KND, Anas platyrhynchos) have colored-feathers and unique meat flavor and texture with better fatty acid profiles (Muhlisin et al., 2013). But they show relatively slow-growth with poor feed conversion rate (Hong et al., 2012) and are reared more longer period (8 wk) as compared to imported commercial breeds (Kim et al., 2012). The commercial breeds are one of the fastest growing and capable of a feed efficiency of 45 g of BW gain per 100 g feed consumption with 3,100 g BW at 42-d old (Adeola, 2003). This suggests the possible differences in energy and nutrients needs between KND and commercial breeds from foreign breeding companies.
Methionine, lysine and threonine are considered to be most limiting amino acids (AA) in fast growing commercial ducks fed practical corn-soybean meal based diets (Adeola, 2006). To support the maximum growth and meat yield of ducks, adequate levels of these AA should be provided (Elkin, 1987). The BW and breast meat yield showed significant response to increasing dietary methionine contents in White Pekin ducks from 21 to 49 d of age (Xie et al., 2006). With increasing dietary lysine levels, growth performance and meat yield in growing male Pekin ducking were also significantly increased (Bons et al., 2002). Several experiments on the responses of commercial ducks to dietary AA have been conducted, but only limited information is available on the dietary most limiting AA needs in KND. These studies were conducted to exam the optimal levels of dietary limiting AA for growth and carcass characteristics during starter and grower periods as an initial nutrient study in KND.
MATERIALS AND METHODS
Animals, diets, and management
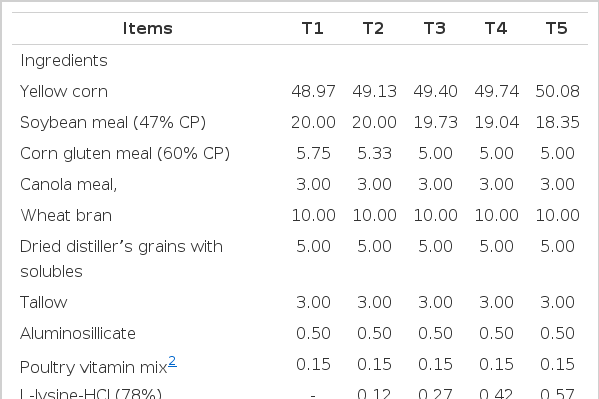
The male Korean native ducklings were received on the day of hatch from a local hatchery, individually weighed and randomly assigned into five dietary treated groups. A total of 450 ducklings were assigned into five groups with six replicates and fed one of five diets varying levels of lysine, total sulfur amino acids (TSAA) and threonine with consistent balance (T1: 0.90%, 0.74%, and 0.70%; T2: 1.00%, 0.82%, and 0.77%; T3: 1.10%, 0.90%, and 0.85%; T4: 1.20%, 0.98%, and 0.93%; T5: 1.30%, 1.07%, and 1.01%), for 21 d as shown in Table 1. The experimental diets were formulated to meet and exceed the nutrients requirements of NRC (1994) and Korean feeding standard for poultry (2012) and processed as crumble form. The diets and water were provided for ad libitum intake. The ducklings were initially reared at 33°C, and the room temperature was gradually decreased by 4°C weekly until a final temperature of 22°C was reached. Lighting was kept at 23/1 light/dark cycle throughout the experimental period. The BW and feed intake on a pen basis were recorded weekly and gain:feed was calculated.
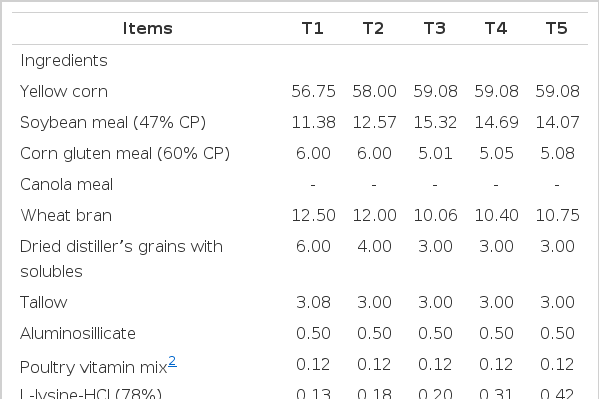
In Exp. 2, one-d-old male Korean native ducklings were received and fed commercial starter diet (21% CP, 3,000 kcal of TMEn/kg) from hatching to 21 d of age. All ducklings were weighed individually and randomly assigned into five dietary treated groups with six replicates. A total of 450 21-d-old ducklings were fed one of five diets with varying levels of lysine, TSAA and threonine with consistent balance (T1: 0.73%, 0.62%, and 0.54%; T2: 0.80%, 0.68%, and 0.60%; T3: 0.87%, 0.74%, and 0.65%; T4: 0.94%, 0.80%, and 0.70%; T5: 1.01%, 0.86%, and 0.75%), for 35 d (Table 2). The experimental diets were formulated to meet and exceed the nutrients requirements of NRC (1994) and Korean feeding standard for poultry (2012) and processed as pellet form. The diets and water were provided for ad libitum intake. The BW and feed intake on a pen basis were recorded weekly and gain:feed was also calculated.
Sampling and measurements
At the end of the experimental period, eight ducks per each treatment were selected and weighed individually. The ducks selected were sacrificed by neck cut, scalded with hot water (60°C for 3 min), and removed the feathers mechanically. Carcasses were eviscerated manually and portioned into commercial cuts such as neck, breast, leg and wing. The breasts were immediately chilled for 30 min in ice water and transferred to icebox and then prepared separately for further analyses. All animal care procedures were approved by Institutional Animal Care and Use Committee in Konkuk University.
The instrumental color of fresh meat, including lightness (L*), redness (a*) and yellowness (b*), were measured using a chromameter (CR 210, Minolta, Japan). The pH values of breast meats were estimated in triplicate with a pH meter (340 Mettler-Toledo, Switzerland). Briefly, 1 g of breast meat was cut into small pieces and homogenized with 9 mL of distilled water for 1 min in an Ultra-Turrax (Model No. T25, Janken and Kunkel, Germany). To determine the cooking loss, 60 g of breast meat was boiled individually in polyethylene bags immersed in 80°C water bath for 30 min and cooled at room temperature for 30 min. The cooking loss was calculated from the weights of uncooked and cooked meats. The water holding capacity (WHC) was estimated according to filter paper pressed method (Grau and Hamm, 1953). Breast meat (0.3 g) was weighed on a Whatman filter paper (No. 2, UK). The samples were pressed between two plexiglass plates for 3 min. The areas of pressed sample and water were measured using planimeter (Super Planix α, Tayama Technic Inc., Japan).
RESULTS AND DISCUSSION
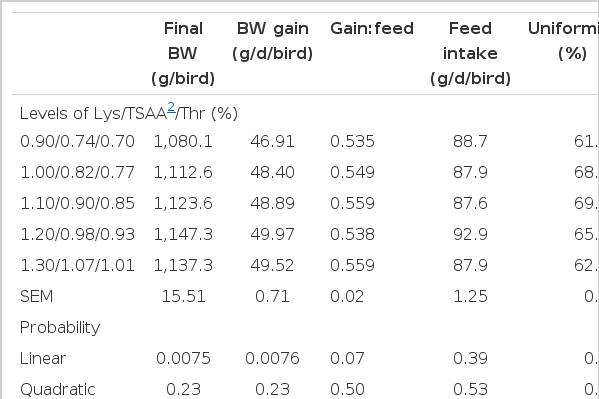
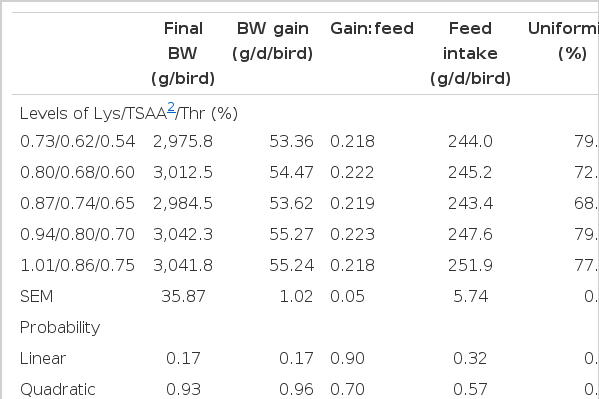
Growth performance and uniformity of KND fed diets with varying levels of limiting AA during starter phase are presented in Table 3. Ducklings fed diet with higher levels of limiting AA grew faster than the lowest limiting AA group (p<0.05). There were no significant differences in gain:feed, feed intake and uniformity among groups. Table 4 shows the growth performance and uniformity of KND fed diets with varying levels of limiting AA during 22 to 56 d of age. There were no significant linear and quadratic trends of dietary limiting AA levels affecting final BW and BW gain. The gain:feed, feed intake and uniformity were not affected by dietary levels of limiting AA. The optimal dietary levels of lysine, TSAA and threonine for grower phase of KND were 0.73%, 0.62%, and 0.54%, respectively.
In duck diets formulated with corn and soybean meal, methionine, lysine and threonine are likely to be the most limiting AA (Elkin, 1987). The commercial ducks are one of the fastest growing and to support the maximum growth and meat yield of ducks, adequate levels of these AA should be provided (Adeola, 2003). It was reported that the growth of commercial meat-type ducks was significantly improved with increasing levels of dietary lysine (Bons et al., 2002) and methionine (Xie et al., 2006). In this study, a significant linear trend for final BW and daily BW gain was determined with increasing dietary limiting AA levels during starter phase. But, the late growth of KND was not affected by dietary levels of lysine, TSAA and threonine. It is assumed that there is considerable difference in growth response, especially late growth, according to dietary limiting AA levels between KND and commercial breeds.
In this study, the levels of lysine, TSAA and threonine necessary to maximize growth were at least 1.20%, 0.98%, and 0.93%, respectively for starter phase. The dietary levels of 0.73% lysine, 0.62% TSAA and 0.54% threonine appear to be adequate during growing phase. These are lower than corresponding values suggested by breeding company for commercial meat-type ducks (Grimaud Fréres Selection, 1995). The duck industry continues to feed more limiting AA intake because of concern of underfeeding for maximal growth and optimal feed conversion rate. During late growing stage, the levels of dietary lysine, TSAA and threonine for commercial ducks in the industry ranges from 0.87%, 0.74%, and 0.65% to 1.01%, 0.86%, and 0.75%, respectively and is clearly above the levels suggested by NRC (1994) and Korea feeding standard (2012). Dietary protein and AA are a major cost and optimal level is important for lowering feed cost per unit of duck product. In present study, KND require relatively low levels of most limiting AA for late growth and carcass yield due to low daily weight gain. This information on limiting AA need will enable more accurate and economic diet formulation and great control on dietary nutritional quality for KND.
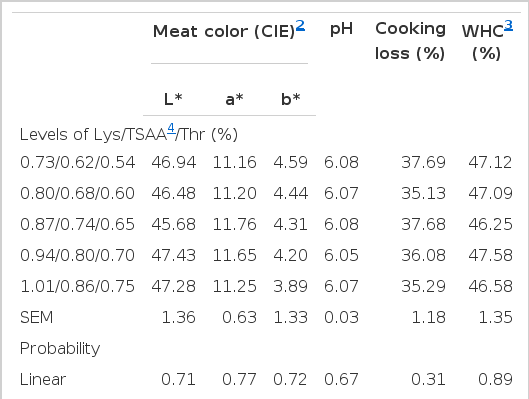
Mean yield of carcass and major component parts of KND fed diets with varying levels of limiting AA are presented in Table 5. The carcass yield and relative weights of various organs were not affected by dietary levels of limiting AA, except for breast yield. There were no significant linear and quadratic trends of dietary limiting AA levels affecting color and pH of breast meats. The cooking loss and WHC were not also affected by dietary levels of limiting AA (Table 6).
The WHC of breast meat in KND was ranged from 46.25% to 47.58%, which agreed with our previous result (Muhlisin et al., 2013). There is increasing preference for indigenous breeds called quality poultry meat over the fast-growing breeds developed from commercial breeding companies. The taste attributes of the cooked breast from KND scored higher than corresponding part from commercial meat-type ducks, according to the sensory evaluation by panels (Muhlisin et al., 2013). In order to diversify duck meats to take account of consumer’s demands, it is necessary to clarify the nutritional values of KND meats.
In conclusion, a significant linear trend for daily BW gain was determined with increasing dietary limiting AA levels during starter phase. But, KND require relatively low levels of most limiting AA for late growth stage due to slow-growth characteristics.
ACKNOWLEDGEMENT
This research was supported by a grant from National Institute of Animal Science, RDA.
