Standardized Total Tract Digestibility of Phosphorus in Copra Expellers, Palm Kernel Expellers, and Cassava Root Fed to Growing Pigs
Article information
Abstract
An experiment was conducted to determine the apparent total tract digestibility (ATTD) and standardized total tract digestibility (STTD) of phosphorus (P) in copra expellers (CE), palm kernel expellers (PKE), and cassava root (CR). Eight barrows (initial BW of 40.0 kg, SD = 4.5) were individually housed in metabolism crates. A replicated 4×3 incomplete Latin square design was employed involving 4 dietary treatments, 3 periods, and 8 animals. Three experimental diets contained 40% CE, PKE or CR as the only source of P. A P-free diet mainly based on corn starch, sucrose, and gelatin was also prepared to estimate the basal endogenous loss of P. The marker-to-marker method was used for fecal collection. Values for the ATTD of P in the CE and PKE were greater than in the CR (46.0 and 39.7 vs −14.0%; p<0.05). However, the STTD of P did not differ greatly among the test ingredients (56.5, 49.0, and 43.2% in the CE, PKE, and CR, respectively). In conclusion, the ATTD of P values in CE and PKE were greater than that in CR, but the STTD of P did not differ greatly among CE, PKE, and CR.
INTRODUCTION
Phosphorus (P) is a material that, with calcium (Ca), mainly composes the bone. To maintain a normal skeleton, animals must be supplied with P. Phosphorus also exists in cell membranes throughout the body in a phospholipid form, and is involved in energy metabolism (Crenshaw, 2001). For these reasons, a sufficient supply of P is essential.
The digestibility of P is generally expressed as the apparent total tract digestibility (ATTD) and standardized total tract digestibility (STTD) values (Almeida and Stein, 2010; Kim et al., 2012). The ATTD of P is calculated based on the P content in the diet and feces. Because the P in the feces includes P originating from the body as well as P derived from the diet, the ATTD of P is less than the real P digestibility. The major issue in the use of ATTD of P is that the values may not be always additive in mixed diets (NRC, 2012). The STTD of P takes into account the basal endogenous loss (BEL) of P originating from the body (Almeida and Stein, 2010Almeida and Stein, 2011; Kim et al., 2012). In a recently released publication of NRC (2012), P requirement and available P content in the ingredients are presented as STTD-based P which are assumed to be additive in mixed diets.
The prices of conventional feed ingredients such as corn and soybean meal have sharply increased in recent years, and thus, efforts to identify alternative feed ingredients have become very important. Because copra expellers (CE), palm kernel expellers (PKE), and cassava root with hulls (CR) are relatively cheap and good sources of nutrients, the increased use of these ingredients is expected (Kim et al., 2001; Son et al., 2012). The CE and PKE were produced by crew-press extraction of oils from coconuts and palm kernels, respectively. The NRC (2012) has reported the values for the STTD of P in CE, PKE, and CR, but these values were derived from a very limited number of studies. Therefore, the objective of this study was to determine the STTD of P in CE, PKE, and CR fed to growing pigs.
MATERIALS AND METHODS
Animal care
The experimental procedure was approved by the Institutional Animal Care and Use Committee at Konkuk University.
Animals, diet and feeding
Eight barrows with a mean initial BW of 40.0 kg (SD = 4.5) were used to determine the ATTD and STTD of P in the CE, PKE, and CR (Table 1). The pigs were individually placed in metabolism cages, and allotted to 4 dietary treatments and 3 periods in a replicated 4×3 incomplete Latin square design. Potential carryover effects were balanced using a spreadsheet-based program (Kim and Kim, 2010).
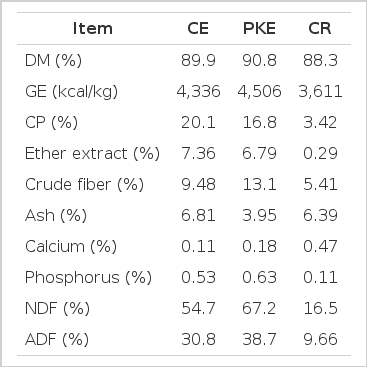
Energy and nutrient composition of copra expellers (CE), palm kernel expellers (PKE), and cassava root (CR), as-is basis
The amount of feed provided daily per pig was calculated as approximately 2.7 times the estimated energy requirement for maintenance (i.e., 106 kcal of ME per kg of BW0.75; NRC, 1998). Daily feed allowance was divided into 2 equal meals and fed to the pigs at 0900 and 1700. Water was available at all times.
Three experimental diets contained 40% of CE, PKE or CR as the sole source of P (Tables 2 and 3). A P-free diet mainly based on corn starch, sucrose, and gelatin was also prepared to estimate the BEL of P. Vitamins and minerals were adequate to meet requirement estimates of NRC (1998).

Ingredient composition of experimental diets, as-fed basis

Analyzed chemical composition of experimental diets, as-fed basis
Sample collection
An experimental period consisted of 3-d adaptation and 4-d collection periods. Total feces were collected according to the marker-to-marker procedure (Adeola, 2001). The total quantity of feces was immediately stored at −20°C after collection. At the end of each period, the BW was measured to determine the amount of feed allowance.
Chemical analysis
Fecal samples were dried in a forced-air drying oven at 55°C and ground before analysis. To analyze DM in the ingredients, diets, and feces, all samples were dried in the forced-air drying oven at 135°C for 2 h (method 930.15; AOAC, 2005). The ingredients and diets were analyzed for GE (Model C2000, IKA, Germany), CP (method 990.03; AOAC, 2005), ether extract (method 920.39; AOAC, 2005), and crude fiber (method 978.10; AOAC, 2005) content. Samples of ingredients and diets were also analyzed for ash (method 942.05; AOAC, 2005), NDF (Goering and Van Soest, 1970), and ADF (method 973.18; AOAC, 2005) content. The Ca concentrations in the ingredients, diets, and feces were analyzed using an atomic absorption spectrophotometer (method 978.02; AOAC, 2005; Perkin Elmer 3300, Perkin Elmer, USA). The P concentrations in the ingredients, diets, and feces were analyzed using a spectrophotometer (method 946.06; AOAC, 2005; Optizen 2120UV, Mecasys, Republic of Korea).
Calculations
Phosphorus digestibility was calculated based on the P intake and the amount of excreted P (Kim et al., 2012). Because the CE, PKE, and CR were the sole source of P in each experimental diet, values for the ATTD of P in each experimental diet represent values for the ATTD of P in the CE, PKE, and CR. The ATTD of P was calculated according to the following equation:
The BEL of P was calculated based on the DMI and excreted P from the pigs fed the P-free diet. The BEL of P was calculated according to the following equation:
The STTD of P was calculated according to the following equation:
Statistical analysis
Data were analyzed using the MIXED procedure of SAS (SAS Inst. Inc., Cary, NC, USA). Variation within treatment and outlier were tested using the UNIVARIATE procedure. The model included dietary treatment as the fixed variable and replication, animal within replication, and period within replication as random variables. Least squares means of each treatment were calculated and the differences between means were tested using the PDIFF option with Tukey’s adjustment. In this process, the output values were converted to letter groupings using a macro program (Saxton, 1998). The experimental unit was a pig, and the statistical significance was set at p-value<0.05. The prediction equation for the BEL of P (mg/kg of DMI) was developed by using PROC REG, and the equation used the initial BW (kg) as an independent variable.
RESULTS
Chemical composition
The contents of CP, ether extract, crude fiber, NDF, and ADF in CE and PKE were greater than those in CR (Table 1). The contents of Ca in CE and PKE were less than those in CR, but the contents of P in CE and PKE were greater than those in CR.
Phosphorus and calcium digestibility
The ATTD of p-values in CE and PKE were greater than that in CR (46.0 and 39.7 vs −14.0%; p<0.05; Table 4). The BEL of P was calculated at 252±15 mg/kg of DMI in pigs fed the P-free diet. Values for the STTD of P in CE, PKE, and CR did not differ greatly (56.5, 49.0, and 43.2%, respectively; p = 0.222).
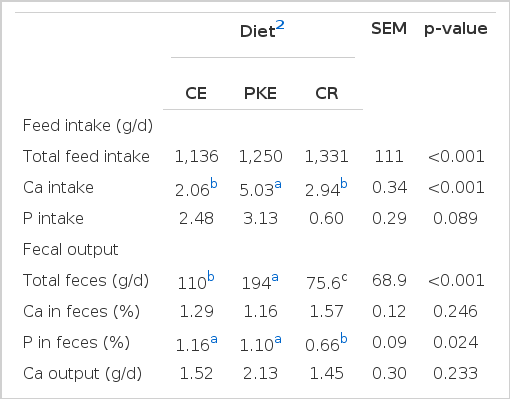
Calcium digestibility was calculated based on the Ca intake and the amount of excreted Ca (Table 4). The Ca intake of pigs fed the PKE diet was greater than that in the CE- or CR-fed group (p<0.05). The ATTD of Ca in PKE was greater than that in CE (58.6 vs 28.3%; p<0.05).
DISCUSSION
Chemical composition
The P contents in the CE and PKE used in this experiment were similar to the values reported previously (Sauvant et al., 2004; Almaguer et al., 2011; NRC, 2012). The P content in the CR used in this experiment was similar to the value (0.11 vs 0.12%) reported by the NRC (2012).
Phosphorus and calcium digestibility
The reason that the difference in digestibility was observed in ATTD but not in STTD is most likely due to the different P content in the experimental diets. The total P intake in pigs fed the CR diet was less than that in pigs fed the CE or PKE diet. When the P intake is small, the proportion of the BEL of P in the total quantity of excreted P increases (Kim et al., 2012). For this reason, the ATTD of P in the CR used in this experiment was a negative value.
The STTD of P in the CE used in this experiment was less than the value reported by Almaguer et al. (2011) and the NRC (2012). The value for the STTD of P in PKE in the present work was very similar to the values reported in the literature (Almaguer et al., 2011; NRC, 2012). The STTD of P in the CR in the present experiment was greater (43.2 vs 24.0%) than the value reported by the NRC (2012). However, values for the STTD of P in the CE, PKE, and CR reported by the NRC (2012) were based on only 1, 2, and 1 study, respectively. The P digestibility values in the CE, PKE, and CR were very limited; therefore, more studies are required to obtain P digestibility values of the CE, PKE, and CR that are more accurate.
The BEL of P estimated in this study (252 mg/kg of DMI; Table 4) was not far off, but was slightly greater than previously reported values (153 to 211 mg/kg of DMI). The relatively high BEL of P in the present study may be associated with the rather heavy BW (40 kg) of the pigs used in this experiment compared with the pigs in other studies (11.0 to 33.2 kg). The values for the BEL of P (mg/kg of DMI) was positively correlated with the initial BW of pigs in the literature (r2 = 0.669, p = 0.013; Figure 1). Furthermore, the concentration of the fiber source in the P-free diet was also greater in this experiment (10%, as-fed basis; Comprecel, Mingtai Chemical Co., Ltd., Taiwan) than that in previous studies (4%, as-fed basis; Solka-Floc, Fiber Sales and Development Corp., USA). It has been hypothesized that high fiber content in feed ingredients may increase the total endogenous losses of P (Petersen and Stein, 2006) because dietary fiber increases the turnover rate of intestinal cells (Jin et al., 1994). In the present work, thus, we included 10% of cellulose in the P-free diet that contained a similar ADF concentration to the CE, PKE, and CR diets.
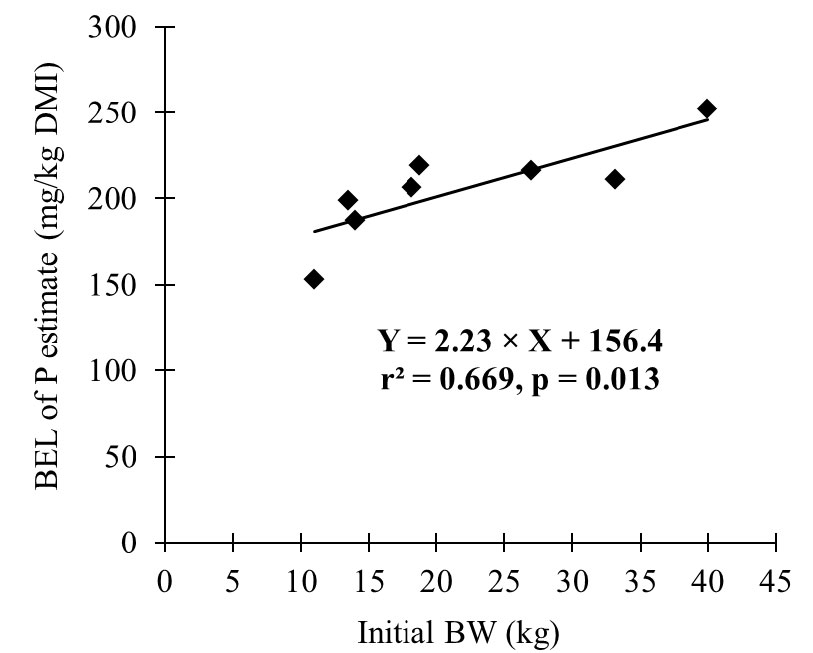
Relationship between basal endogenous loss (BEL) of phosphorus (P) and initial BW of pig (n = 8). Data are from Widmer et al. (2007), Almeida and Stein (2010, 2011, 2012), Almaguer et al. (2011), Kim et al. (2012), Rojas and Stein (2012), and the present study.
The less ATTD of Ca in the CE diet as compared with that in the PKE diet may be attributed to the less digestibility of Ca in CE, the less Ca intake in the CE group, or both. The ATTD of Ca has been reported to be positively correlated with Ca intake in pigs (González-Vega et al., 2013).
CONCLUSION
In conclusion, values for the ATTD of P in CE and PKE were greater than that in CR, but the STTD of P among CE, PKE, and CR did not differ greatly. The STTD is more accurate that the ATTD when expressing the digestibility of P, for low-P content ingredients.
Acknowledgements
This study was supported by Farm Story Dodram B&F (Seoul, Republic of Korea) and the National Institute of Animal Science (Suwon, Republic of Korea; PJ907038).