Tracing the breeding farm of domesticated pig using feature selection (Sus scrofa)
Article information
Abstract
Objective
Increasing food safety demands in the animal product market have created a need for a system to trace the food distribution process, from the manufacturer to the retailer, and genetic traceability is an effective method to trace the origin of animal products. In this study, we successfully achieved the farm tracing of 6,018 multi-breed pigs, using single nucleotide polymorphism (SNP) markers strictly selected through least absolute shrinkage and selection operator (LASSO) feature selection.
Methods
We performed farm tracing of domesticated pig (Sus scrofa) from SNP markers and selected the most relevant features for accurate prediction. Considering multi-breed composition of our data, we performed feature selection using LASSO penalization on 4,002 SNPs that are shared between breeds, which also includes 179 SNPs with small between-breed difference. The 100 highest-scored features were extracted from iterative simulations and then evaluated using machine-leaning based classifiers.
Results
We selected 1,341 SNPs from over 45,000 SNPs through iterative LASSO feature selection, to minimize between-breed differences. We subsequently selected 100 highest-scored SNPs from iterative scoring, and observed high statistical measures in classification of breeding farms by cross-validation only using these SNPs.
Conclusion
The study represents a successful application of LASSO feature selection on multi-breed pig SNP data to trace the farm information, which provides a valuable method and possibility for further researches on genetic traceability.
INTRODUCTION
In the present days, multiple diseases originated from livestock were reported, and some of them are directly and indirectly connected to human food, which includes fatal zoonoses such as bovine spongiform encephalopathy and avian influenza. Also, a number of food-borne diseases have been reported due to poor sanitation and contamination of toxic microbiome in the process [1]. Besides the food-related diseases, younger generation tends to lack trust on the market, and tries to be aware of what they eat and where the products came from [1]. Therefore, consumers’ demand for the food safety has been increasing recently, accompanied by the suspicion on food quality. Today, consumers demand well-established distributions as well as reliable food sources. To meet the demand, the tracking system of livestock product has gained attention since the early 2000s [1].
Traceability simply refers to the tracking system to identify animals from the manufacturer to the retailer, which provides a credibility of food origin [2]. Even though tracking of the animal product has been improving for years (i.e. an animal tag), it still depends on the uncertainty of information provided by the manufacturers. Genetic traceability is one of the various types of traceability determined based on DNA-level data, such as microsatellite and single nucleotide polymorphism (SNP) [1]. DNA molecules are constant and robust, and these traits make DNA remain unaffected regardless of the process from manufacture to distribution.
Based on the fact that genetic mutations occur and some of those mutations are fixed through generations, reflecting the evolutionary history, SNPs can be variable and represent from individual to population. For years, many SNP markers have been discovered and shared. Using the enormous DNA reference databases, it is possible to define genetic variants and to distinguish species and breeds. Furthermore, a set of SNPs called haplotype can be used to individualize samples and detect genetic diseases.
Selection is one of the driving forces of evolution, caused by extrinsic factors. In the meaning of evolution, different selection pressures can generate several different subsets of the parent population, called population differentiation. Artificial population differentiation within domesticated species such as pig is defined as breeding. As domesticated pig (Sus scrofa) breeds are strongly inbred to maximize economic efficiency, thus within-breed variation shows relatively transient signal than between-breed variation does [3–6]; this makes genetic traceability challenging under the existence of a variety of breeds. Therefore, researches about effective applications of genetic traceability account for a big part of livestock science, along with decreasing price of SNP microarrays and next-generation sequencing.
In the swine industry, breeding farms use purebreds such as Landrace, Duroc, and Yorkshire. Since the purebreds are highly inbred to be selectively developed in economical traits, their genetic diversities within breeds are lower than that of wild boar [4]. That is, the genome of each breed has distinct patterns of inbreeding signal, generally called a selective sweep [6–8]. It also implies that between-breed genetic differences in commercial pigs are relatively higher in some genomic regions related to the economic traits than conserved regions [4,5]. Considering the effect of between-breed variation, multi-breed prediction of the farm is harder than single-breed prediction. Nevertheless, the origin of pigs can be distinguished by SNP markers because the breeding farms use different selection indexes to orient their genomic selection, suggesting that various purebreds from one breeding farm can share farm-specific signals on their genomes [9,10]. It is necessary to build the prediction model based on SNPs which are shared by the farm, rather than the breed.
Feature selection is an important step of model construction to achieve the maximum parsimony [11]. It reduces the number of attributes that are less relevant to the model, leading to a lower risk of overfitting and better prediction through the model, which may uncover the underlying insights of data [11]. Least absolute shrinkage and selection operator (LASSO) is one of the regularization methods to optimize coefficients using a penalty [12]. While LASSO builds and optimizes the model, it performs feature selection by setting irrelevant coefficients to zero [12]. Since LASSO was reported to be effective in biomarker selection in the two-class problem and can be applied to logistic regression models, it has been extended to the multi-categorical variables such as farm tracing, which could be complicated in machine learning-based classification [12,13]. With that said, we performed LASSO to select powerful features and optimize the coefficients of a model for farm prediction.
In this study, multi-breed SNP chip data of 6,018 pigs over four breeding farms was used to demonstrate the farm tracing. Under the multi-breed conditions, we attempted to select features which offset the between-breed differences and distinguish their breeding farms. The main objective of the study is to maximize the performance of farm prediction using feature selection strategy. Therefore, we i) generated the additional set of breed-offsetting SNPs (boSNPs), ii) selected the best features through LASSO multinomial logistic regression, and iii) evaluated the highest-scored features using multiclass classifiers in the present study.
MATERIALS AND METHODS
Data collection and merging of pre-screened SNPs
Total 6,018 pigs including three commercial breeds (Duroc, Yorkshire, and Landrace) were collected using Illumina Porcine 60K v2 SNP beadchip data, from four of Korean major breeding farms (SJ, SCB, KB, and DB). All of 8 SNP chip data were summarized in Table 1. Each dataset was pre-screened to filter out genotyping errors and poor quality SNPs, using PLINK v1.0.7 (http://pngu.mgh.harvard.edu/purcell/plink/) [14] with following parameters: minor allele frequency (maf)<0.01, missing rates of genotypes (geno)>0.01, Hardy-Weinberg equilibrium test p-value (hwe)≤ 0.00001. After pre-screening, datasets were merged to extract SNP markers shared between samples, and the merged dataset was screened again by missing rates of genotypes (geno>0.01) to minimize N/A values of features. The whole process is summarized and displayed as a diagram in Figure 1.
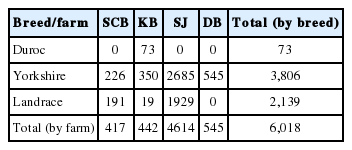
Summary of the samples
Workflow of the study. Processes used in the study is described by the partial diagrams. “SNP set extraction” represents the pre-screening and the extractions of breed-offsetting SNPs (boSNPs) and nullSNPs. “Comparison and integration of SNPs” includes the process of LASSO feature selection, the comparison of both SNPs and further integration of SNPs to find the best subset of features. “Assessment of the highest scored features” represents the assessment of highest-scored features by multiclass classifiers. SNPs, single nucleotide polymorphisms.
Extraction of null SNPs and breed-offsetting SNPs
In the selection of the best features for predict farm information of an individual, the dataset firstly created under no assumption was named as “null SNPs”. In addition, considering the between-breed differences in data structure, another SNP set was produced from the merged dataset called “boSNPs”.
To reduce the differences between breed and to priorly select farm-traceable features, boSNPs were collected. To generate the input datasets for boSNPs, phenotypes were assigned for samples which belongs to each breed: case (target breed) and control (other two remainder breeds). Therefore, a total of three datasets for three breeds were created respectively, and used for association analyses based on logistic model. After combining three results of logistic regression, SNPs which were significantly distinguished once or more in results (false discovery rate adjusted p-value≤0.01) were excluded to remove features showing between-breed differences.
Of 202 boSNPs and 14,670 nullSNPs, 179 boSNPs and 3,899 null SNPs were selected through linkage disequilibrium (LD) based pruning using PLINK v1.0.7 with following parameters: window size = 50, the number of SNPs to shift the window = 5, and r2≥0.5 between one SNPs and others. Total genotype rates of boSNPs and nullSNPs are 99.85% and 99.86%, respectively. For downstream analyses, missing values of genotypes were replaced by a median of genotype value of each SNP. The principal component analyses (PCA) for both SNP sets were performed using R 3.3.3 [15] with package SNPRelate [16] to overview the distribution of samples for breed and farm information (Figure 2). Ancestry population differentiation (K = 4) were inferred for both SNP sets using admixture 1.3.0 [17], and demonstrated in Supplementary Figure S1.

Scatter plots of the principal component analyses. Eigenvector 1 and 2 were calculated by PCA using SNPRelate [16]. Individual samples are depicted as points; different color coding scheme was used for (A) breed and (B) farm, and by types of SNPs (left, nullSNPs; right, boSNPs). The colors used in the plot are given in the legends. PCA, principal component analyses; SNPs, single nucleotide polymorphisms; boSNPs, breed-offsetting SNPs.
Comparing performances of SNPs using LASSO penalized regression
To select the optimal features to classify farm information, we used one of the embedded feature selection method, LASSO penalization, using R package glmnet 2.0–5 [18]. Considering farm information is a categorical variable with four levels, we implemented LASSO penalization based on multinomial logistic regression model using options as follows: α = 1, family = “multinomial”. Glmnet uses “forward” stepwise regression; it iteratively adds features to model from zero to the number that the percent of null deviance explained reaches a plateau, up to 100 iterations.
As two different SNP sets, boSNPs, and nullSNPs, were extracted, we simulated LASSO regression 100 times to find the optimal number of features for both datasets. To evaluate the model, each simulation is composed of 10-fold cross-validation (CV). Thus, total 100 of 10-fold sets were randomly sampled and continuously used in CV process of downstream analyses. When comparing the performances of two SNP sets, we implemented cv.glmnet to train the model and predict.glmnet to test the model. Since cv.glmnet internally conducts 10-fold CV and calculates CV error for each trial, it suggests the fittest lambda (λ) and the best number of features based on two criteria: lambda.min, lambda value with a minimum of the mean of CV error (CVM) and lambda.1se, the biggest lambda within one standard error of CVM. We used lambda.1se value for each trial to suggest the best number of features in both SNP sets. Accuracies of each trial were estimated gradually from zero to the number of features at lambda.min. The results of analyses were visualized in Figure 3.
Performance of LASSO feature selection. Colors indicate the types of SNPs: blue represents the performances using boSNPs, orange represents those using nullSNPs. “Density” (top) shows distributions of the best numbers of features determined by cv.glmnet using lambda.1se. “Accuracy (%)” (middle) and “Mean of CV error (CVM)” (bottom) show the smoothing lines of simulated accuracies and CVMs along with the number of features. The errorbar indicates the standard error of simulation and the colored dashed lines shows the mean of the best number of features corresponding lambda.1se. Lastly, the dotted line represents the crossing point of accuracies of two SNPs. LASSO, least absolute shrinkage and selection operator; SNPs, single nucleotide polymorphisms; boSNPs, breed-offsetting SNPs.
Construction and assessment of integrated feature sets
To estimate the improvement by the addition of boSNPs, we integrated 179 boSNPs and 3,899 nullSNPs into an integrated set of 4,002 SNPs and performed feature selection and CV using glmnet. Feature selection and model testing were performed with 100 simulations of 10-fold CV. The result of the simulation is described in Figure 4A, where its performance is compared to that of nullSNPs.

Summary of the integrated SNP set. (A) Accuracies of the model along with the number of features used. Colors indicate the types of SNPs. (B) The scaled distribution of the feature scores of integrated SNPs by quartiles (top) and that of top 100 highest-scored SNPs (bottom). Axes are differently scaled. (C) The proportion of SNPs by quartiles of feature score. Each color represents the type of SNPs included in the integrated SNP set. SNPs, single nucleotide polymorphisms.
Among 4,002 integrated SNPs, models were constructed with a limit of the number of features ranging from 60 to 120, and a total of 1,341 SNPs were selected in repetitive model construction through simulations. For each model construction, features used in the model were equally given the feature score of the reciprocal of the number of features with non-zero coefficients. As three exclusive subsets of integrated SNPs—boSNPs, nullSNPs, and commonSNPs—were compared regarding the distribution of the feature score (Figure 4B). The feature scores of 1,341 SNPs were displayed in quartiles by the type of SNPs to overview the distribution (Figure 4C).
Evaluation of LASSO based feature selection using multiclass classifiers
To further select the most distinguishable features from those 1,341 primarily selected features, top 100 highest-scored features from integrated SNP set were extracted to be evaluated through bottom-up machine-learning based multinomial classifiers. Using R package RWeka 0.4–33 [19], two of Weka classifiers (KNN, k-nearest neighbor and SVM, support vector machine) were used to evaluate the performance of highest-scored SNP set in terms of accuracy (equal to recall in multiclass prediction), precision and F-measure [20] (Figure 5A).
Assessment of the top 100 highest-scored features using multiclass classifiers. Three performance measures are evaluated along with the number of features and demonstrated in three separate plots: accuracy/recall (left), precision (middle), and F1-measure (right). (A) Weighted sum of measures using two classifiers, KNN and SVM, are shown. (B) and (C) Measures are calculated by farms using SVM and KNN, respectively. Each color indicates each farm. KNN, k-nearest neighbor; SVM, support vector machine.
Those measures were also used to demonstrate the performances by the farm (Figure 5B, 5C). Parameters are used in classifiers as follows: k = 1 in KNN (IBk), and Radial Basic Function Kernel (RBFkernel) in SVM (SMO).
RESULTS AND DISCUSSION
Farm traceability refers to a process of predictive model construction to track the origin among various pigs. In this study, we attempted to achieve the farm tracing of breeding farm in 6,018 pigs of three breeds (Yorkshire, Landrace, and Duroc) using SNP chip data from four Korean local breeding farms: SJ, SCB, KB, and DB (Table 1).
First, we filtered out genotyping errors from SNP chip data through pre-screening. After pre-screening, we pruned off SNPs with high collinearities using LD and attain 3,899 SNPs (null SNPs). Additionally, another set of 179 SNPs with reduced breed differences (boSNPs) were extracted to theoretically revise the breed variety of data (Table 2). Next, we simulated multinomial regression models to predict the farm information, and we selected the most relevant features upon constructed model using LASSO penalty. During simulations, we compared the performances of two SNP sets and combined them into integrated SNPs. Finally, we used integrated SNPs to obtain the accuracies of models and feature scores of selected SNPs. The top 100 of highest-scored SNPs were selected as representative features, and two multiclass classifiers were employed to evaluate these features. The workflow is described as a diagram in Figure 1.

Summary of the number of SNPs passing for processes
The data used in this study was produced by each farm individually. Before genotype pruning, the merged data has genotyping rates of 0.83. After filtering process to minimize the missing genotypes, 14,670 SNPs remained. Since our data was composed of three purebreds, it is required to select features presenting less between-breed difference; genome of purebred pig contains variants with strong breed-specificity because of inbreeding [3,6]. We assumed that the effect of breeding might obscure model construction because it is relatively bigger than that of breeding farms [5]. To solve the problem, we suggested extracting an additional set of SNPs with less between-breed gaps. PCA using 179 boSNPs showed reduced breed-specificity compared to the result using nullSNPs as shown in Figure 2A, suggesting that the breed difference was neutralized in boSNPs. This observation was also concordant with ancestry population differentiation analyses with K value of 4 (Supplementary Figure S1). Otherwise, farms were not distinguishable in both SNP sets, showing the necessity of further feature selection (Figure 2B).
Therefore, we simulated feature selection using LASSO multinomial logistic regression with boSNPs and nullSNPs, respectively. LASSO is a statistics-based feature selection method using penalization of regression coefficients, to simplify the model. As an embedded feature selection method, LASSO simultaneously constructs a model and selects features used in the model [12]. Because every single run of LASSO multinomial logistic regression possibly results in one distinctive set of features as a local optimum, we performed 100 simulations of 10-fold CV. The regularization parameter of LASSO, the lambda (λ), must be defined by the user from the list of iteratively generated lambdas. Hence, we used cv.glmnet, an internal function of glmnet which empirically suggests the best lambda value (lambda.1se) and the corresponding number of features, and the results for both SNP sets were depicted in Figure 3. Using the forward stepwise method, the test showed that model of boSNPs reached lower convergent accuracy (96%) than nullSNPs (99%). Notably, boSNPs showed higher accuracy below the feature count of 53. The CVM of both SNP sets also showed a similar pattern of accuracy. This similarity suggests that boSNPs may contain powerful features to distinguish farm, but the small number of boSNPs limits accurate prediction.
The result implied that both nullSNPs and boSNPs contain farm-segregating features with smaller between-breed differences (Figure 3). When there is a large number of relevant features that can be distinguished by the response variable, selecting the same number of features from subsets would not affect the convergent accuracies [21]. In other words, feature selection in subsets including different numbers of features may result in different numbers of relevant features to fit the model. Considering the significant difference in the sizes of subsets (3,899 and 179), different convergent values of accuracy and CVM between boSNPs and nullSNPs indicates that boSNPs was not sufficient to complete the farm prediction, which is largely due to the lack of feature variety. In addition, the density of feature counts corresponding to optimal lambda values (lambda.1se) differed between two SNP sets for 90 and 110, which also supports the insufficiency problem of boSNPs. On the other hand, the superior of the accuracy of boSNPs at a smaller number of features represents the stronger relevance of individual SNPs; this supports the efficacy of boSNPs in farm classification.
In order to improve the model, we decided to integrate boSNPs into nullSNPs. We then simulated LASSO on 4,002 integrated SNP set using “forward” method, and we measured the accuracy of prediction along with the number of features involved (Figure 4A). The model using integrated SNPs showed slightly better prediction compared to that of nullSNPs, and was similarly accurate where 100 features were included (98.5%). To understand the improvement in integrated SNP set, we divided the feature score results using integrated SNPs into three types of constituent: bo-exclusive SNP, null-exclusive SNP, and common SNP. Then we calculated the feature score on all models using 60 to 120 features and displayed them in a density plot (Figure 4B). A total of 1,341 features has non-zero scores ranging from 0.01 to 557 in 100 simulations (Supplementary Table S1), and the score distribution of features is positively skewed. The mean of features score is 37.60, and 75% of the features have feature scores less than 15. Scores in top 25% quartile (Q4) ranged from 15 to 557, showing the extreme bias of feature score. We also calculated densities of three types of the constituent for each quartile (Figure 4C, Table 3). The percent of bo-exclusive SNPs in Q4 quartile (29%) was larger than the expected ratio of 25% or that of null-exclusive SNPs (25%). Extreme bias of feature scores suggests the necessity of a second selection in terms of removal of low-impact SNPs and reaching the global optimum of LASSO regression. Considering the number of features corresponding to the optimal lambdas, a total of 100 highest-scored features were selected for further evaluation. Of the top 100 highest-scored SNPs, bo-exclusive SNPs showed higher scores than other two constituents (Figure 4B), supporting that the boSNP set contains powerful individual features.
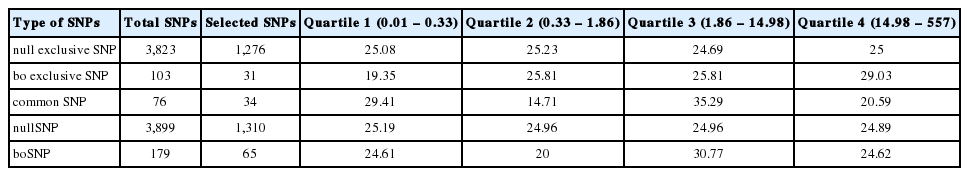
Proportions of SNPs for feature score quartiles
In order to assure the prediction performance, the highest-scored SNPs were evaluated by two machine-learning based multiclass classifiers, SVM and KNN. Since the recall, precision, and F1-measure had been considered useful in estimating performances of feature selection [20], we used those measures to evaluate the result. First, a weighted sum of measures by farm were estimated between two classifiers. KNN showed better performance than SVM, but evaluations using all 100 features showed values greater than 0.99 for all three measures in both classifiers (Figure 5A). Performance using all of 4,002 SNPs were measured to be compared; In the evaluation using SVM, values of measures using all SNPs are 0.78, 0.83, and 0.69 respectively for recall, precision, and F1-measure, whereas, KNN provides approximately 1 for all three measures. Considering that KNN with k = 1 could lead to overfitting, top 100 highest-scored SNPs showed substantial performance with less danger of overfitting. It is practical in the reduction of features, which simplifies the model, and by reducing time and cost in the perspective of industry and research. Performance measures were also characterized by farm using SVM and KNN (Figure 5B, 5C). Approximately 75% of base accuracy (zero feature included) can be explained by the unequal sample size of each farm, especially because large portion of samples was from SJ. Despite the imbalance between sample sizes, farm prediction was successful when performed as more features were included, which is also supported by PCA plot of top 100 features (Supplementary Figure S2).
As consumers’ demand for food safety increases, traceability of the origin of the animal product becomes more and more crucial. DNA markers actualized more reliable tracking concept called genetic traceability. To employ DNA markers for the farm prediction, variety of the population must be considered before selecting relevant features. In this study, we illustrated that LASSO regression greatly reduces the number of features down to 100 and demonstrates successful prediction under the existence of breed diversity. A successful application of LASSO in farm prediction can complement the existing food traceability, as it reduces the cost of traditional traceability system and delivers more accurate information to the consumers. In conclusion, our method presenting the maintenance of farm traceability with a smaller number of SNP markers provides valuable information to the swine industry and the researches with regard to the genetic traceability.
Supplementary Data
ACKNOWLEDGMENTS
This work was supported by a grant from the Next-Generation BioGreen 21 Program (Project No. PJ01111501), Rural Development Administration, Republic of Korea.
Notes
CONFLICT OF INTEREST
We certify that there is no conflict of interest with any financial organization regarding the material discussed in the manuscript.