Microsatellite Analysis of the Genetic Diversity and Population Structure in Dairy Goats in Thailand
Article information
Abstract
The genetic relationships between different populations and breeds of exotic dairy goats in Thailand were studied using 12 microsatellite markers. Blood samples were obtained from 211 goats from Department of Livestock Development breeding and research farms: 29 Anglonubian (AN), 21 Alpine (AP), 23 Jamunapari (JAM), 50 Saanen (SN), and 88 Toggenburg (TG). Five of the 12 microsatellite markers were found to be polymorphic. A mean of 7.40 alleles per locus was found, with a range from 5 (SPS115 and ETH225) to 11 (TGLA122). We found 24, 27, 19, 32, and 24 alleles in the AN, AP, JAM, SN, and TG breeds, respectively; 37 alleles were present in all breeds. The mean number of alleles in each population ranged from 3.2 (ETH225 locus) to 7.6 (TGLA122 locus). Genetic variability within the breeds was moderate as evidenced by the mean expected heterozygosity of 0.539. The average observed heterozygosity across the 5 markers in all breeds was 0.529 with the maximum observed at the BM1818 locus (0.772) and the minimum at the ETH225 locus (0.248). The observed and expected heterozygosity for all breeds for the 5 microsatellite markers ranged from 0.419 to 0.772 and 0.227 to 0.792, respectively. On the basis of their means, the TGLA122 and BM1818 loci were the most suitable markers for distinguishing genetic diversity among the goats. The estimated average Fis value for the breeds ranged from −0.044 (ETH225) to 0.180 (SPS115), while the estimated average Fst value ranged from 0.021 (SPS115) to 0.104 (ETH10). These results indicated that TGLA122 and BM1818 markers are suitable to be used for aiding conservation and breeding improvement strategies of dairy.
INTRODUCTION
Goats are the most widely spread domestic species across the world and play an important economic role in developing countries (Adriana et al., 2010). They are the smallest domesticated ruminants, have been domesticated for a long period, and are used for a variety of purposes; goats contribute substantially to rural economies as they can adapt to harsh environments. Goat and sheep milk is usually marketed as a mixture with cow or buffalo milk (Khan, 2008). Agronomically, the goat sector is well-established in developed countries such as Greece, Spain, France, Italy, and Australia for the production of cheeses or baby food products. Dairy goats also help to support millions of people in malnourished populations in the developing world. Moreover, goat milk consumption is used as a therapeutic food by diabetic patients (Nagura, 2004), and by those with peptic ulcers, allergy and various gastrointestinal disorders that develop from intolerance to cow milk (Haenlein, 2004). Thailand has imported Saanen goats as an exotic dairy breed since 1948. In 2013, the total population of goats in the country was 440,277, which were owned by 41,674 farmers; only 4.53% of the total goat population (19,923 head of 1,719 farmers) was dairy goats. The distribution of the goat population is related to the geographic rather than climate conditions, and they are particularly associated with the southernmost region and outskirts of Bangkok, areas where Thai Muslims live. The main exotic goat breeds in Thailand are Anglonubian (AN), Alpine (AP), Jamunapari (JAM), Saanen (SN), and Toggenburg (TG) and these are used by DLD in their breeding improvement plan.
Genetic characterization of goat breeds requires a basic understanding of the variation both within and between populations. Microsatellites are useful in conservation genetics because of the high degree of polymorphism, which makes them extremely informative and provides very high discriminating power (Glaubitz and Moran, 2000). These properties of microsatellites allow a thorough assessment of the genetic variation and structure within and among populations (Bruford et al., 1996). Genetic diversity is essential for the long-term survival of species and populations, because it provides the raw material for adaptation and evolution, especially when environmental conditions change. The genetic diversity of many goat breeds has been investigated using microsatellite markers: Korean goat, Chinese goat and Saanen using 5 bovine, 2 ovine, and 2 caprine microsatellite markers (Kim et al., 2002); nine breeds of Chinese cashmere goat using 14 and 11 microsatellites (Li et al., 2008; Di et al., 2011); 18 East Asian indigenous goat populations using 26 microsatellite markers (Nomura et al., 2012); 20 Indian goat breeds using 25 microsatellite markers (Dixit et al., 2012); 5 Southern Indian goat breeds using 25 microsatellite markers (Dixit et al., 2010); Jamunapari goats using 23 microsatellite markers (Gour et al., 2006); the Barbari goat using 21 microsatellite markers (Ramamoorthi et al., 2009); 6 Tibetan and other goat breeds using 10 microsatellite markers (Wang et al., 2011); Mongolian goats using 10 microsatellite markers (Takahashi et al., 2008); 11 indigenous South-East Asian goat breeds using 25 microsatellite markers (Barker et al., 2001); Saanen, Alpine and native Brazilian goat breeds using 11 microsatellite markers (Adriana et al., 2006). In order to improve milk production by the indigenous goat population in Thailand, the government initiated a breeding strategy. This study was undertaken to determine the genetic variability and estimate genetic distances among 5 exotic dairy goat breeds in Thailand, namely Saanen, Alpine, Toggenburg, Jamunapari, and Anglonubian.
MATERIALS AND METHODS
Sample collection, DNA extraction and quantification
Blood samples were collected from 211 randomly selected and unrelated animals of 5 exotic dairy goat breeds in Thailand. These samples included 29 AN, 21 AP, 23 JAM, 50 SN, and 88 TG goats. The animals were from herds on three breeding and research farms of the Department of Livestock Development, namely, Tae-Pa farm (Songkhla Province), Pangchong farm (Nakhon Rachasima Province), and Yala farm (Yala Province) and from farmers’ flocks in Bangkok, Pra Nakhon Si Ayutthaya, Suphanburi, Pathumthane, and Ratchaburi Provinces. The blood samples were taken from the jugular vein using vacutainer tubes with K2-EDTA (ethylenediaminetetraacetic acid) anticoagulant. They were then kept in an ice-box before transport to the laboratory where they were stored at −70°C until used for DNA extractions.
Genomic DNAs were prepared from blood samples according to the modified method described in the Kurabo handbook (ver. 3.1). In brief, cells were lysed by adding 200 μL of the blood sample to a 1.5-mL microtube containing 30-μL EDB (Proteinase K.) and 250-μL lysis buffer; the mixture was vortexed at maximum speed for 15 s, centrifuged for 1 to 3 min at 13,000 rpm, and incubated at 56°C for 20 min. The mixture was vortexed again for 15 s, re-incubated at 56°C for 10 min, vortexed at a maximum speed for 15 s, and 250 μL 99% ethanol added. The extraction steps were run on a QG-810 machine (Kurabo, Osaka, Japan). The lysate was added to 26-mL wash buffer and 9-mL elution buffer, then placed into a cartridge and the machine set to the DNA WHOLE BLOOD mode. After extraction, the genomic DNA was transferred to a microtube and quantitated by ND-1000 spectrophotometer (Thermo SCIENTIFIC, USA).
Microsatellite polymorphism detection
Studies have been undertaken to develop polymorphic DNA markers specific to this species. However, comparative genome studies have shown that microsatellite (MS) primer sequences are often conserved across related species and can be used for the development of markers in related species (Table 4). Therefore, we used 12 MS markers widely used in cattle (recommended by [International Society for Animal Genetics). Polymerase chain reaction (PCR) amplification and genotyping were performed at the Bioinformatic Center laboratory, Hankyong National University, Anseong, Korea. All 211 DNA samples were amplified using a GeneAmp PCR system 9700 (Applied Biosystems, Waltham, MA, USA). All the microsatellite markers were forwardly labeled with a capillary based dye, FAM (blue), VIC (green), or NED (yellow), to enable genotyping. The amplifications were carried out using 15 μL reaction mixtures containing 2-μL genomic DNA (20–100 ng/μL), 2 μL template genomic DNA (20 to 100 ng/μL, 0.5 μL of each primer, 0.6-μL hot start Taq DNA polymerase (Genetbio, Daejeon, Korea), 1.8 μL of 10× buffer, and 1.5 μL of deoxynucleotide triphosphate (dNTPs). The PCR amplification conditions were: pre-denaturation step, 15 min at 95°C, 60 s at 94°C, 75 s at 55°C, and 60 s at 72°C for 5 cycles; 60 s at 94°C, 75 s at 54°C and 60 s at 72°C for 10 cycles; 60 s at 94°C, 75 s at 55°C and 60 s at 72°C for 25 cycles. The final extension step was at 65°C for 30 min and then cooled to 8°C. The amplification products were initially electrophoresed on a 2% agarose gel treated with ethidium bromide for later visualization of DNA bands under ultraviolet light.

Primer sequences of the 12 microsatellites used in this study
Microsatellite marker genotyping
The amplified DNA was genotyped using an automated Genetic Analyzer 3130xl (Applied Biosystems, USA). The genotyping reaction contained 1 μL of PCR products, 8.9 μL of Hi-Di formamide and 0.1 μL of GeneScan-500LIZ size standard in 10-μL total volume. The genotyping results were obtained using GeneMapper V 4.1 (Applied Biosystems, USA).
Statistical analysis
The genotyped data was analyzed using Cervus V 3.0 program (Marshall et al., 1998) and Excel MS toolkit version 3.1 (Park, 2001) to calculate allele frequencies at each locus for each population, average number of allele per population and heterozygosity value (expected and observed). The amount of inbreeding-like effects within subpopulations (Fst), among subpopulations (Fis) and within the entire population (Fit) was analyzed by F-statistics (Wright, 1965). The Dispan program (Ota, 1993) was used to calculate DA genetic distances between populations. The neighbor joining method (Saitou and Nei, 1987) was used to construct a phylogenetic tree. Principal components analysis (PCA) was calculated for the 5 MS markers using GenAlEx 6.4 program.
RESULTS AND DISCUSSION
Genetic diversity and differentiation
Only 5 (TGLA122, BM1818, ETH10, ETH225, and SPS115) of the 12 microsatellite markers were polymorphic. In total, 37 alleles were identified at these 5 loci in the 211 individuals. A mean of 7.40 alleles per locus was found, with a range from 5 (SPS115 and ETH225) to 11 (TGLA122). In the study, the 5 exotic dairy goat breeds showed the most diverse to be SN, which had 32 alleles, while JAM showed the least diversity with a total of 19 alleles (Table 1).

Number of alleles of each polymorphic microsatellite in the different goat breeds
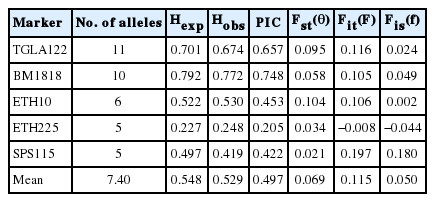
The heterozygosity (expected heterozygosity [Hexp] and observed heterozygosity [Hexp]) and polymorphic information content (PIC) value for the 5 dairy goat breeds in Thailand are summarized in Table 2. Hexp, Hobs, and PIC ranged from 0.180 (SN) to 0.792 (AP), 0.482 (TG) to 0.559 (AN), and 0.449 (JAM) to 0.531(SN), respectively. The mean values of Hexp, Hobs, and PIC for overall loci and breeds were 0.539, 0.529, and 0.497, respectively.

Hexp and Hobs, PIC for 5 microsatellite markers in the 5 goat breeds
PIC value across the 5 microsatellite markers ranged from 0.205 (ETH225) to 0.748 (BM1818). In general, the PIC values were indicative of the high polymorphic nature of the microsatellites analyzed. TGLA122 and BM1818 markers seem the most effective of those tested for analyzing polymorphism in the goat populations (Table 3). The observed heterozygosity per locus ranged from 0.248 (ETH225) to 0.772 (BM1818) with an average of 0.529. The high number of alleles at TGLA122 and BM1818 provided sufficient polymorphism for analysis and indicates the appropriateness of the selected loci for assessing genetic variation. In order to investigate genetic relationships and breed differentiation, highly polymorphic MS markers are selected (FAO, 2004; Seo et al., 2013). MS markers were previously used for estimation of genotypic diversity of heterozygosity and PIC value informativeness in animal breed selection (Berthouly et al., 2008). For the animal traceability, PIC>0.5 and Hexp>0.6 are the most reasonable informative loci for application in genetics (Botstein et al., 1980). The genetic analysis of 5 exotic dairy goat breeds in Thailand with 5 microsatellite markers showed moderate gene diversity. Among 5 microsatellite markers, TGLA122 and BM1818 were the most appropriate for analyzing diversity in these goat breeds as they showed a high allele number, Hexp, and PIC.
Hexp and Hobs, PIC and overall F-statistics for 5 microsatellite markers in the sampled population
According to Wright’s (1965), F-statistics were observed in fixation index as genetic differentiation (Fst), the global heterozygote deficit among five goat breeds (Fit) and the heterozygote deficit within line (Fis) among the 5 MS markers (Table 3). All of the loci, except ETH225, showed positive Fis values, with an average value of 0.050, indicating a deficiency of heterozygosity within the breeds. The cause of this deficiency might be inbreeding or the Wahlund effect. These high inbreeding values could be due to small population sizes, small numbers of breeding males or limited geographical dispersion. The average genetic differentiation between breeds (Fst) and total inbreeding (Fit) were 0.069 and 0.115, respectively.
Phylogenetic and structure analysis
The phylogenetic tree showed (Figure 1) the closest genetic distance was between AP and TG breeds and the most distance between AP and SN breeds. From the history of the breeds, AP is known to have originated in France, TG and SN in Switzerland, AN is a mixed blood breed from United Kingdom, Middle East, and North America, and JAM originated in India. When we match the genetic distance information from the phylogenetic tree with information on the origin of each breed, the SN breed seemed to counter expectations; possibly, this is because most SN goats in Thailand were imported from Australia and New Zealand.
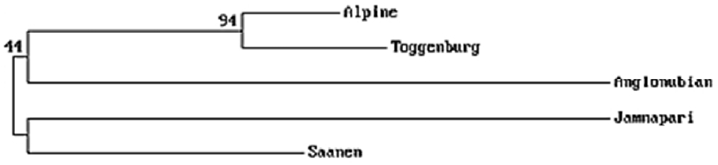
Phylogenetic tree showing the genetic divergence among the 5 goat breeds, using Nei’s DA genetic distance on the basis of allele frequencies from 5 microsatellite markers. The numbers on the branches indicate percentage occurrence in 1,000 bootstrap replicates.
A PCA based on allele frequencies is presented. It is clear that TG, AP, and SN formed one group. AN and JAM were located in a different separated single quadrate that was distinct from these 3 other breeds (projection of breeds on axes 1 and 2). In the projection of breeds on axes 1 and 3, AN, AP, and TG might form one group while SN and JAM were in a single quadrate with each other (Figure 2).
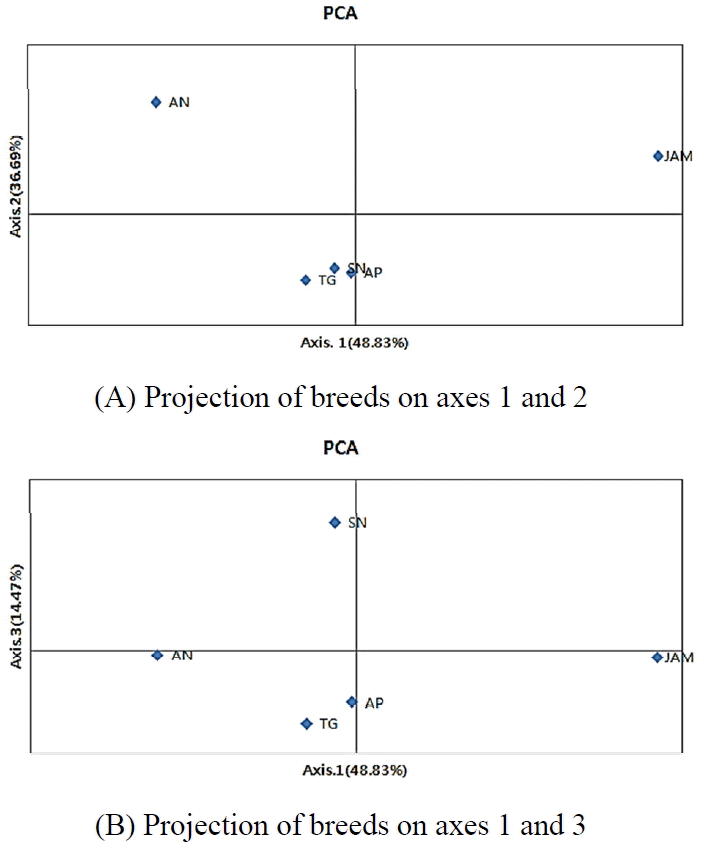
Principal components analysis (PCA) of allele frequencies of the 5 microsatellite markers typed in 5 dairy goat breeds using GenAlEx. (A) Projection of breeds on axes 1 and 2, (B) Projection of breeds on axes 1 and 3. AN, Anglonubian; AP, Alpine; JAM, Jamunapari; SN Saanen; TG, Toggenburg.
IMPLICATIONS
The present study showed that the exotic dairy goat populations in Thailand have high genetic diversity with medium heterozygosity. The results of the present study will be useful in planning strategies for the future genetic improvement program of dairy goats in Thailand.
ACKNOWLEDGMENTS
We wish to thank the staff of the Department of Livestock, Thailand, and Dr. Sansak Nakavisut and Dr. Suwit Anothaisinthawee of the Bureau of Animal Husbandry and Genetic Improvement for their support and information on Thai goat breeds. We are grateful to Mr. Tanongchai Chatchawan, head of the Taepa Farm, Mr. Chatchawan Wiriyasombat, head of the Yala farm, and all the staff of these farms, and to the dairy goat farmers in Central region for kindly helping during blood sample collection.
Notes
CONFLICT OF INTEREST
We certify that there is no conflict of interest with any financial organization regarding the material discussed in the manuscript.