Effects of Dietary Potential Acid Production Value on Productivity in Dairy Cows
Article information
Abstract
This study was conducted to estimate the potential acid production value (PAPV) of major diets and to determine the relationship between dietary PAPV and dairy production traits. Estimation of PAPV of major cattle feeds was based on an in vitro technique, which determined the degree of Ca dissociation from CaCO3. Data on feeds and production traits were collected on 744 multiparous lactating Holstein dairy cows from five different farms. Grains had high PAPV with variable protein sources and by-products. High PAPV feedstuffs had a higher total gas production and lower pH compared to those with low PAPV. Dietary PAPV had a positive correlation with intake of dry matter, NDF, ADF, milk yield and milk solid production but a negative correlation with milk protein and milk fat concentration. Current results indicate that dietary PAPV can be utilized in predicting dairy production traits.
INTRODUCTION
The high productivity of modern dairy farming requires excessive feeding of commercial concentrates and grains. However, the intake of large amounts of high energy feeds could decrease ruminal pH and disturb stable ruminal fermentation as grain contains easily fermentable carbohydrates (Dunlup, 1972; Russell et al., 2001; Choi et al., 2003). In addition, the type of concentrate is a determining factor for the occurrence of abnormal ruminal fermentation. Physically effective fiber is the fraction of feedstuffs that stimulates saliva secretion by chewing activity. The balance between the production of fermentation acid and bicarbonate and phosphate buffers in saliva neutralize acids and plays an important role in the regulation of ruminal pH. Allen (1997) indicated that low ruminal pH led to a decreased DMI, fiber digestibility and microbial yield and thus a reduction of milk production and increased feed costs. Diets should be formulated to maintain optimal ruminal pH, and ruminal pH should have minimal variation due to feeding management. Previous studies suggested that ruminal pH correlates closely with ruminal motility (Ash, 1959), microbial yield (Oliveira et al., 1997), methane production (Lee et al., 2003), dry matter intake (Dewhurst et al., 2001), milk yield (Wadhwa et al., 2001b) and fiber digestion (Smith et al., 1973; Fondevilla et al., 1994). Low ruminal pH has direct and negative effects on energy intake and absorption of protein, which is a primary factor limiting production of high producing dairy cows. Therefore, maintaining an optimal ruminal pH is essential for higher productivity, and estimation of acid production capability of feedstuffs is important in diet design to avoid excess acid accumulation in the rumen. Precise estimation of the potential acid production value of individual feedstuffs and mixed feeds would be optimal; however, it is not an easy task. In addition to traditional indicators of acid production values such as pH and lactic acid, acidogenicity based on Ca release after rumen incubation has been proposed as an alternative method (Wadhwa et al., 2001a). Various factors that might affect acidogenicity, which is noted as potential acid production value (PAPV), have been discussed previously (Song, 2005).
The objectives of this study were to measure the PAPVs of the major ingredients fed to dairy cows and to assess the relationships between PAPV and performance parameters of lactating cows under practical farm conditions.
MATERIALS AND METHODS
Experiment 1: Estimation of PAPV of major feedstuffs
Animal
A fistulated Holstein cow of 500 kg body weight was used as a donor of rumen fluid. Tall fescue and commercial concentrate (Purina®: crude-protein content, 12%) in the ratio of 3 to 2 were fed at 2% of body weight twice a day. Water and mineral-vitamin block were allowed ad libitum.
Rumen fluid
The rumen fluid was collected from the fistulated Holstein cow before morning feeding. Rumen samples were collected in a bottle, previously kept warm and filled with O2 free-CO2 gas, carried to the laboratory, and filtered through four layers of cheesecloth before mixing with buffer maintained at 39°C and under O2-free CO2 gas.
Feedstuffs
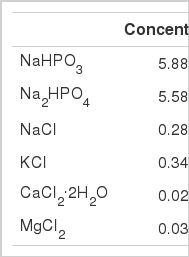
Feed ingredients were freeze-dried and ground through a 1-mm screen on a laboratory mill before being returned to the freeze-drier to remove any moisture produced during grinding. The buffer described by Wadhwa et al. (2001a, Table 1) was used as a medium. Cysteine hydrochloride monohydrate (0.025% wt/vol) was added just prior to incubation. One-gram (DM) samples were weighed directly from the freeze-drier (with samples held in a desiccator) and were incubated with 30 ml of buffered rumen sample comprised of 60% buffer and 40% rumen fluid. The bottles were sealed with butyl rubber stoppers and aluminum seals (Wheaton Scientific). The incubations were carried out in 60 ml serum bottles held in an incubator at 39°C for 24 h.
PAPV determination of feedstuffs
PAPV determination was based on in vitro incubation of concentrates with buffered rumen fluid. Ruminal acid production, which was the residual acidity after fermentation of concentrates, was evaluated by assessing the amount of Ca dissociated from insoluble CaCO3 powder (Sigma Chemical Co., St. Louis, MO, USA). Contents (2 ml) were withdrawn from each tube after 24 h incubation and transferred to 2 ml tubes containing 50 mg of CaCO3 powder (Sigma Chemical Co., St. Louis, MO, USA). The mixture was shaken manually for 5 s and then centrifuged at 10,000 rpm for 20 min before analysis of Ca content in the supernatant with a Ca reagent working solution (Table 2) that contained calcium buffer and calcium binding reagent. Control (without CaCO3 powder) and blanks (with no feed sample) were included in each run. Absorbance values of all tubes was measured using a Shimadzu® UV 1601 spectrophotometer at 575 nm within three minutes after the addition of the sample. PAPV was calculated by the following equation: Dietary PAPV (mg Ca/g feed DM) = treatment PAPV-control PAPV-blank PAPV.
Gas production
A detachable pressure transducer and a digital readout voltmeter (Laurel Electronics, Inc., CA, USA) were used to measure the headspace gas pressure of fermenting cultures. For total gas production measurement, the transducer was modified in such a way that it could be linked to the inlet of a disposable Luer-lock three-way stopcock (Theodorou et al., 1994). Bottles were warmed to 39°C, and the headspace gas pressure in each tube was adjusted to ambient pressure prior to and just after inoculation with the microbial suspension. Gas pressure in the headspace was read from the display unit after insertion of the hypodermic syringe needle through the butyl rubber stopper above the culture medium.
Experiment 2: Relationship between dietary PAPV and dairy performance
Experimental animals and diets
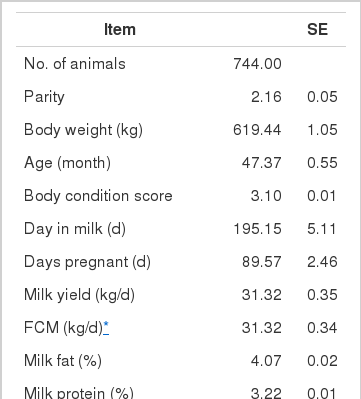
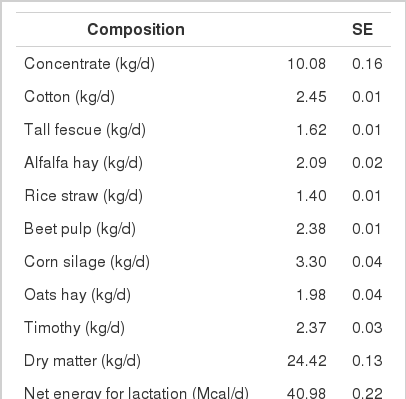
A total of 744 multiparous lactating Holstein cows (average BW 630 kg) from five different dairy farms were used to collect data on intake, feed composition and performance. The average performance of cows is shown in Table 4, and the average composition of feed ingredients is presented in Table 5.
Analysis of feeds and milk samples
Estimation of feed PAPV was conducted with the data obtained in experiment 1 and those previously determined in our laboratory. Feed samples were collected once a week for wet chemistry analysis and production data calculations. Chemical compositions (dry matter, crude protein and ether extract) of feeds were analyzed using the method of AOAC (1990). ADF, NDF and ADL were analyzed using the methods of Van Soest and Robertson (1985) and Van Soest (1991). A Cornell Net Carbohydrate and Protein System (CNCPS) was used for fractionation of carbohydrate and protein in diets. Milk production and nutrient intake were recorded every week in the dairy farm. Samples were collected to analyze the composition and yield of milk every ten days. Milk samples were collected twice a day at 6:00 and 18:00 for the analysis of milk composition (fat, protein, lactose and milk urea nitrogen) using a Milkoscan 5000 (Foss Electric Co.). Morning and evening milk samples were pooled together in equal proportion and subjected to composition analysis.
Statistical analysis
Data were analyzed using the general linear model (GLM) procedure of the Statistical Analysis System Institute, Inc. (SAS, 1995). Differences among means were tested for significance using Duncan’s multiple range test of SAS (1995). Pearson’s correlation coefficients between dietary PAPV and lactating performance parameters were evaluated.
RESULTS AND DISCUSSION
Experiment 1: Potential acid production value of major ingredients
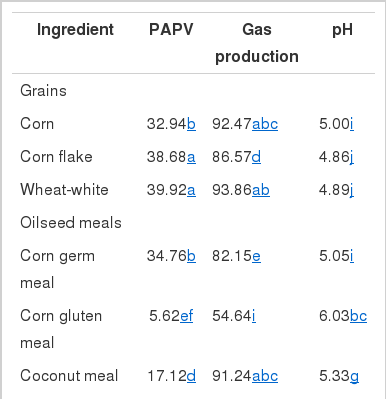
PAPV (mg Ca/g feed DM), pH and gas production by different feedstuffs after 24 h incubation are shown in Table 3. In general, feedstuffs having higher PAPV produced more total gas with lower pH, as expected. The relationship between PAPV and total gas production or pH has been observed in a previous study (Song, 2005) with a similar trend. Of the tested feedstuffs, the grains and corn germ meal showed the highest PAPVs. There was a large variation in PAPV among oilseed meal samples. Corn germ meal and coconut meal were high in PAPV, while corn gluten meal, palm oil meal and rapeseed meal had lower PAPV. Bran and hull samples were also variable in PAPV. Protein sources, except corn germ meal, had a much lower PAPV than the starch feeds, which is similar to the results of Wadhwa et al. (2001a). The low PAPV of protein sources can be explained by higher buffer capacity of dietary proteins. For instance, Jasaitis et al. (1987) reported a high pH and buffering capacity of protein feeds due to the buffering ability of amino groups, and Crawford et al. (1983) also showed that a smaller amount of base was required to maintain the pH in a continuous culture system when high protein feedstuffs were used. Buffering in the rumen is mainly due to ammonia from dietary proteins with plant proteins providing between 10 and 20% of the total buffering capacity (Playne et al., 1966). Although differences in PAPV among various feed ingredients seemed to reflect the fermentable and buffering components of the feeds, the values may not be used as an absolute value for determination of acid production capability. This method was very sensitive to variation in microbial activity between batches of rumen fluid, which resulted in high variation in PAPV (data not shown). Standardization of rumen fluid and inclusion of reference feeds may reduce variation among incubation batches. Before a more reliable method for accurate estimation, PAPV can be useful in ranking of feeds, rather than using them as absolute values, when test feeds are evaluated in several runs. Therefore, PAPVs of total feeds from dairy farms were estimated to determine the relationship between dietary PAPV and production traits of dairy cows in a subsequent experiment.
Experiment 2: Relationship between dietary PAPV and dairy performance
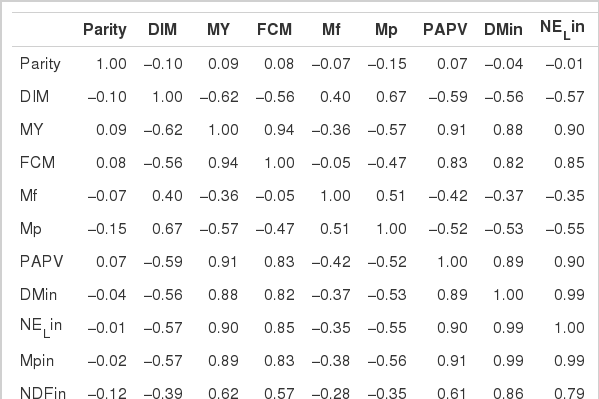
Highly fermentable carbohydrates are often necessary to meet the energy requirements of high producing dairy cows. However, this practice may cause a reduced rumen pH, low productivity and health problem like metabolic diseases. Generally, there is a close relationship among feeding, health and production; hence, metabolic disease like ruminal acidosis can be prevented by proper feeding management. In this experiment, the PAPV (mg Ca/g feed DM) of TMR diets at five dairy farms was estimated based on values determined in the previous in vitro experiment, and the relationship between dietary PAPV and production traits was evaluated by Pearson’s correlation. Field data were collected from 744 dairy cows, and the average performance is shown in Table 4, while the intake, dietary composition and nutrient concentration are presented in Table 5. Average body weight and milk yield in this in vivo experiment were approximately 620 kg and 31 kg, respectively. Milk fat and protein were 4% and 3.2%, respectively. As shown in Table 6, Pearson’s correlations between PAPV and milk yield and FCM yield showed a positive correlation. Dietary PAPV also had a positive correlation with nutrient intake of dairy cows. However, PAPV was negatively correlated with milk fat and protein concentrations. From data obtained in the present study, it is apparent that cows receiving high PAPV consumed more nutrients and produced more milk although the concentration of milk fat was reduced. This is somewhat different from previous results. For instance, increasing concentrate acidogenicity was negatively related to dry matter intake (Wadhwa et al., 2001b) and milk yield (Dewhurst et al., 2001), with variable effects on milk composition. The PAPV of TMR used in the experimental farms ranged from 5 to 15; therefore, the PAPV was not high enough to yield a negative impact on production traits. Welch et al. (1969) indicated that NDF is the nutritional component of roughage that is connected with chewing activity, which is now frequently suggested in the literature as minutes per kilogram of NDF intake. However, chemical benefits of fiber alone are not suitable for optimal diets of high producing dairy cows due to the variation of fiber effectiveness in stimulating chewing, resulting from differences in particle length. Nocek et al. (1988) reported that a proper ratio of non-structural carbohydrate to NDF be used to formulate diets to maximize milk yield. Poore et al. (1991) insisted that the optimal ratio of forage NDF to ruminally degraded starch be maintained ≥1:1 (wt/wt) to prevent a decrease in milk fat (%) when high NDF forage replaced low NDF forage. In general, structural NDF is important for cud chewing and good rumen health, and chemical NDF provides energy for milk and milk fat production. Some nutritional factors could be considered to influence fiber balance in dairy cow diets. Many nutritionists have used forage NDF as a guideline for optimal rumen health and DM intake. The NDF fraction, generally a low rate of digestion, is considered the primary dietary constituent related with rumen fill effect (NRC, 2001). Mertens (1994) reported that ruminal expansion limits DM intake due to the low flow capacity of undigested feed residues; forage NDF intake and fecal output are increased through pelleted high-fiber forages. Optimal forage NDF should be 20% to 21% of dry matter in diets. Total NDF should be increased when feeding less than 20% forage NDF. In this study, the level of forage NDF was about 13.7% in diets and lower than the optimal level. However, the level of total NDF intake in the diets was not low. The minimum level of structural fiber (NDF) was required to prevent acidosis and other metabolic upsets of the rumen connected with a lack of buffering capacity due to low structural fiber in diets. A negative correlation between dietary PAPV and milk protein was noticed, although the relation was not significant in the present study. Dewhurst et al. (2001) reported that milk protein concentration was not influenced by concentrate type when using corn silage as a roughage source but tended to be higher when high acid load concentrates were fed with grass silage. However, the relationship was not sound, which indicates that milk protein did not fluctuate to a great extent based on diet. Also, the present results showed a negative relationship between PAPV and milk fat content. Researchers (Clark et al., 1993; Depies et al., 1995; Armentano et al., 1997) suggested previously that milk fat response be used to determine NDF effectiveness for non-forage fiber sources as a method of uniting these complex interactions. However, there might be limited application for this technique because effectiveness values have not been repeatable across different types of diets (Clark et al., 1993). As milk yield increases, dietary PAPV also increased (Figure 1), which was reflected in an increased energy requirement for higher milk production. Our result also showed that PAPV for dairy TMR greater than 13.5 did not increase milk yield.
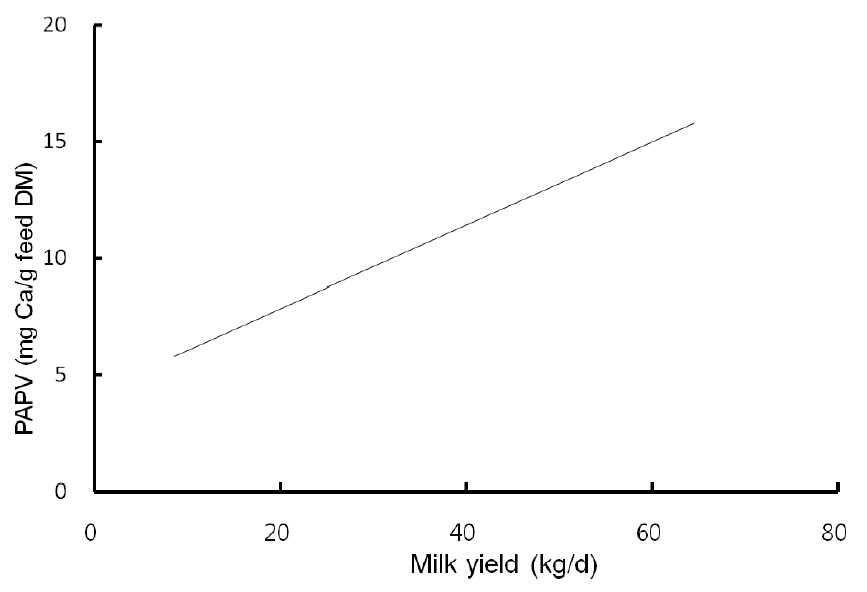
The relationship between dietary potential acid production value (mg Ca/g feed DM) and milk yield (kg/d) from 744 multiparous lactating Holstein cows.
In conclusion, PAPV, although variable, can provide information on acid production capacity of feedstuffs and may be applied to ration formulation for ruminant animals.
ACKNOWLEDGEMENTS
This work was financially supported by the Rural Development Administration, MAF, Korea. E. T. Kim was supported by a scholarship from the BK21 Program, the Ministry of Education, Science and Technology, Korea.
