Identification of Candidate Genes Associated with Beef Marbling Using QTL and Pathway Analysis in Hanwoo (Korean Cattle)
Article information
Abstract
Marbling from intramuscular fat is an important trait of meat quality and has an economic benefit for the beef industry. Quantitative trait loci (QTL) fine mapping was performed to identify the marbling trait in 266 Hanwoo steers using a 10K single nucleotide polymorphism panel with the combined linkage and linkage disequilibrium method. As a result, we found nine putative QTL regions for marbling: three on BTA6, two on BTA17, two on BTA22, and two on BTA29. We detected candidate genes for marbling within 1 cM of either side of the putative QTL regions. Additionally, to understand the functions of these candidate genes at the molecular level, we conducted a functional categorization using gene ontology and pathway analyses for those genes involved in lipid metabolism or fat deposition. In these putative QTL regions, we found 95 candidate genes for marbling. Using these candidate genes, we found five genes that had a direct interaction with the candidate genes. We also found SCARB1 as a putative candidate gene for marbling that involves fat deposition related to cholesterol transport.
INTRODUCTION
Progress in livestock breeding has greatly improved over the last few decades because of the development of molecular marker technology (Gao et al., 2007). Meat quality is an important trait for the economics of the farm (Gao et al., 2007). Its various characteristics (e.g., fat content and composition, tenderness, water-holding capacity, color, oxidation, and stability) have increased the economic return in beef cattle rearing. Meat quality is affected by complex factors, such as the breed of livestock, feeding, fasting, pre-slaughter handling, stunning, slaughter methods, chilling, and storage conditions (Rosenvold and Andersen, 2003; Gao et al., 2007). In Korea, beef marbling (that is, the intramuscular deposition of fat) is an important trait that determines the grade of meat quality. Fat is an important component of meat quality, as is the appearance, texture, flavor, firmness, caloric value, and shelf life of meat (Dodson et al., 2010).
The development of marbling consists of three phases: i) growth increases hot carcass weight that is not high in intramuscular fat; ii) the first finishing period in which kidney, pelvic, and heart fat content increases; and iii) the second finishing period during which intramuscular fat content appears to reach a maximum level (Pethick et al., 2004).
QTL fine mapping studies identify narrow chromosomal regions associated with quantitative traits using molecular markers or genes (Gao et al., 2007). Recently, many methods have been developed using genetic resources from domestic animals, including DNA sequencing data or genotype data (e.g., single nucleotide polymorphisms (SNPs), microsatellites), based on linkage analysis (LA) and linkage disequilibrium (LD) relationships between genetic markers and QTL. However, LA is used within generations but has limitations when studying complex traits, as it does not consider the effects of other genes or of the environment that can affect phenotype. LD mapping can detect population levels but is restricted by the density of markers (Meuwissen et al., 2002).
Meuwissen et al. (2002) proposed a QTL fine mapping method for LDLA that uses a maximum likelihood estimation of variance components (Meuwissen et al., 2002; Hernandez-Sanchez et al., 2010). Using this method, both family level LA and population level LD can be obtained to determine the twinning rate (Hernandez-Sanchez et al., 2010). Some studies have shown that LDLA is highly accurate for QTL mapping and it shows a high significance of unique narrow QTL regions compared with LA (Druet et al., 2008). Uleberg et al. (2007) also performed QTL fine mapping of intramuscular fat on SSC6 using LDLA of 8.7 cM with a highly significant interval (Uleberg and Meuwissen, 2007).
Pathway studies are useful for understanding phenotypic interactions between molecules (Kitano, 2002). Several studies have used such methods to examine the genetic networks between marbling traits and those involved in fat composition (Dodson et al., 2010; Lee et al., 2010) and mature adipocytes (Graugnard et al., 2009) with known pathways, or candidate genes in QTL regions (Fortes et al., 2011).
In this study, we identified several candidate genes by QTL fine mapping using LDLA and a Bovine 10K SNP chip array (Affymetrix Inc., 2006) to detect QTL regions containing the marbling trait in 266 Hanwoo steers. We also performed pathway analysis of these candidate genes to identify potential roles in lipid metabolism.
MATERIALS AND METHODS
Animals, phenotypic data, and genotype assays
Carcass data and DNA samples were obtained from 266 Hanwoo steers born of 66 sires and unrelated dams (2–10 progeny per sire) at two National Institute Animal Science experimental stations (i.e., Dae-Kwan-Ryoung and Namwon). The steers received an ad libitum total mixed diet of concentrate and rice straw. Table 1 presents the ratio of concentrate and rice straw and percent of crude protein and total digestible nutrients for steer intake at each growth stage.
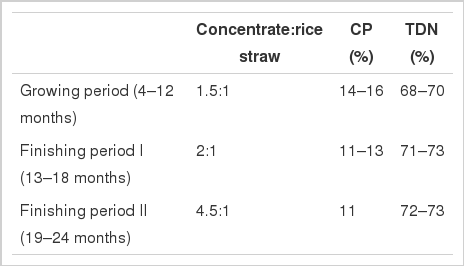
Description for composition of intake for steers of each growth stage
Marbling scores from phenotypic data were measured at the 12th to 13th rib junction after a 24-h chill. Marbling score was assessed as a one to seven grade based on the Korean Beef Marbling Standard from the Animal Product Grading Service in Korea (APGS, 1995). The average grade of the marbling trait for 266 animals was 2.19, and the standard deviation was 1.31.
Genotype assays and general statistics of SNPs
Blood samples were used for extracting genomic DNA, and genotyping was performed in SeoLin Bioscience (Seoul, Korea) using the Affymetrix MegAllele GeneChip Bovine Mapping 10K SNP array (Affymetrix Inc., 2006). Of 300 steers, 266 were successfully genotyped, but the DNA samples from 34 steers were contaminated by phenol and chloroform. In total, 8,344 SNPs were generated and all were mapped to the bovine genome sequence (build 3.1).
Obtained SNPs were tested for Hardy-Weinberg equilibrium (HWE) to identify possible typing errors using the chi-square test in R package 1.8 (R Development Core Team). SNPs were removed that were not in HWE (p value <0.05); monomorphic SNPs and minor allele frequencies were less than 1% in this study.
LDLA analysis for QTL fine mapping
The phenotypic data, used to determine the marbling scores, were fitted to fixed effects of year-season, location, and age at slaughter in linear model using ASReml (Gilmour et al., 2006) to calculate the residuals of the phenotypic data. These residuals are used for the LDLA method; the Merlin program was used (Abecasis et al., 2002) to construct haplotypes from SNP markers on each chromosome.
QTL fine mapping was performed using LDLA as described by Meuwissen et al. (2002). We used markers and known pedigree information (Meuwissen et al., 2002) to estimate identity by descent probabilities (IBD) of haplotypes. The estimated identity by descent probabilities were used to construct a genotype relationship matrix at each putative QTL region (Gp). The additive genetic matrix (A) was constructed based on the knowledge of the sires of the steers genotyped, with sires and dams assumed to be unrelated. The matrices Gp and A were used to define the covariance structure in a mixed linear model to estimate random QTL and polygenic effects with residual maximum likelihood. The statistical model for single QTL analysis was written as:
where y is a vector of N observed marbling trait score, μ is the overall mean, h is a vector of N random QTL effects, u is a vector of Np random polygenic effects for Np animals in the pedigree, Z1 and Z2 are incidence matrices linking observations to QTL (h) and polygenic effect (u), and e is a vector with residuals. The random effects are dispersed as var(h) = Gpσ2h, var(u) = Aσ2u, and var(e) = Iσ2e.
For testing the significance of putative QTL regions, a likelihood ratio (LR) test was used to compare models with and without the QTL effect (LR = 2(log LQTL-log Lno QTL)). Chi square test statistics were also performed to determine the significance of LR (X2df = 1, 0.05 = 3.84). The computation of the p value was performed using the CHIDIST function of Microsoft EXCEL. A false discovery rate test was also performed to adjust for type 1 errors.
Functional annotation and pathway analysis
Candidate genes were selected inside a 1-Mb interval spanning the position of each SNP marker. To annotate the candidate genes, the gene ontology (GO) terms from the Database for Annotation Visualization and Integrated Discovery (http://david.abcc.ncifcrf.gov/) were used. GO terms are used to categorize candidate genes in terms of their functions. The candidate genes were analyzed and associated with their GO terms for all categories, biological processes, molecular functions, and cellular components. Selected candidate genes associated with the marbling trait related to lipid metabolism or adipogenesis were subjected to pathway analysis using the Pathway Studio 7.0 program (Ariadne Genomics, Inc.). Pathway Studio is used to conduct pathway analysis and visualize results based on the “RasNet” database.
RESULTS
General statistics of SNP arrays
Using several methods for quality control, 4,525 SNPs were retained from 8,344 SNPs of the bovine 10K SNP chip panel. From these 8,344 SNPs, some bovine SNPs were not mappable (912 SNPs), some SNPs did not have significant levels (5%) of HWE from chi-square tests (885 SNPs), some SNPs were monomorphic (1,873 SNPs), and some mapped to X chromosomes (149 SNPs) and were all subsequently removed. The remaining 4,525 SNPs were used for QTL mapping of the marbling trait using LDLA analysis. The SNP positions are based on the whole genome sequence. Table 2 shows the number of each SNP and its density on each chromosome. The range of SNPs was from 76 on BTA 28 to 296 on BTA1. The density range of the SNPs on each chromosome was from 0.46 on BTA13 to 1.06 on BTA21.
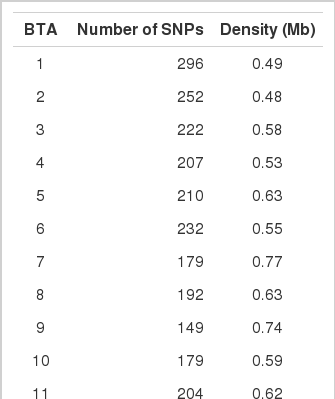
Summary for distribution of SNPs and density on each chromosome
Putative QTL for the marbling trait
Through fine mapping using LDLA method, we detected putative QTL mapping regions for the marbling trait in the Hanwoo population. The position information for the method used the central position of between markers.
Figure 1 shows the distribution of Likelihood ratio (LR) for detected putative marbling QTL. Significant LR values over that 3.84 and each chromosomes are showed over that 3.84 of LR values from LR test. Statistics for these regions were performed with a Chi square test for the LR value, and a FDR test was performed for the adjusted type I error. Table 3 describes the information on the significant QTL regions. Position information from this table is in relation to the central position between markers. We identified nine QTL regions for the marbling trait: three on BTA6 at 51 to 52 cM, two on BTA17 at 46 cM, two on BTA22 at 39 to 40 cM, and two on BTA29 at 14 and 44 cM (p value<0.05). Seven of the nine QTLs are already known regions of marbling in the Animal QTL database (http://www.animalgenome.org/ for marbling trait).
The putative QTL region for marbling.
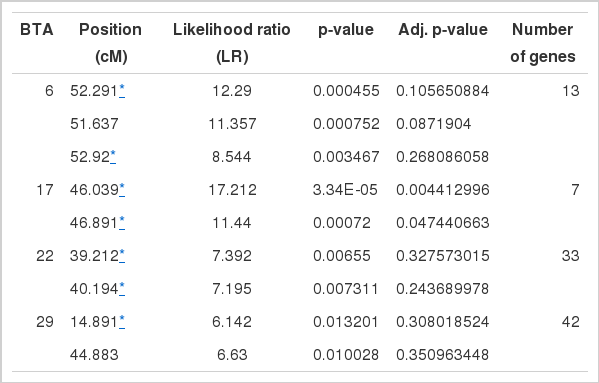
The putative QTL information for marbling
Functional annotation of candidate genes
We found 95 candidate genes within a 1-Mb region of each SNP that contribute to the marbling trait. In Table 3 the number of genes column shows the number of genes found in the putative region of each chromosome. Using all candidate genes, a functional annotation was performed using DAVID. We found 12 GO terms from three categories (i.e. five of biological processes, two of cellular components and five of molecular functions). Table 4 shows the significant eight GO terms, including the name of genes in each term. Several terms are in annotated association with lipid metabolism but it is not significant. The terms involving lipid metabolism were as follows: GO:0010883 (regulation of lipid storage) including genes PNPLA2 and SCARB1, GO:0016042 (lipid catabolic process) including genes ACOX2, PNPLA2, and SCARB1 in the biological processes term. PNAPLA2 and SCARB1 seems to be related to the lipid metabolism terms.

Functional annotation of candidate genes within putative marbling QTL
Pathway analysis of candidate genes
We performed pathway analysis for all candidate genes using Pathway Studio. The pathway search examined direct interactions between all candidate genes. Only five of 95 genes had direct interactions between them. Figure 2(A) shows direct interactions between candidate genes, regulatory genes for candidate genes, and functional categories. By pathway analysis, we found that SCARB1 has an association with the marbling trait and plays a role in lipid metabolism, lipid export, and lipid transport. Additional pathway analysis was performed, yielding up- and downstream regulators of SCARB1. Figure 2(B) shows that SCARB1 is regulated by 17 genes, including insulin, peroxisome proliferator-activated receptors (PPARs), APOA1 and FABP1. SCARB1 was found to be involved in lipid catabolism and regulation of lipid storage.
Pathway analysis of the candidate genes. (A) Direct interactions between candidate genes and their regulatory relationships. Blue highlight marked genes indicates candidate genes for from QTL analysis. (B) The SCARB1’s under up- and down-stream levels of the SCARB1.
DISCUSSION
QTL fine mapping for marbling
We conducted QTL fine mapping of 266 Hanwoo steers using the Bovine 10K SNP chip panel and LDLA for the marbling trait. As a result we found nine significant regions at the chromosome level: three on chromosome 6, two on chromosome 17, two on chromosome 22, and two on chromosome 29.
Previous studies have used fine mapping to indentify some of regions associated with the marbling trait. Yeo et al. using microsatellite markers on chromosome 6 (Yeo et al., 2004) reported a significant region for the marbling trait in Hanwoo cattle that includes the region we identified. Also, Kim et al. (2011a) presented another region in BTA6 at 42.94 cM (Kim et al., 2011a) in Hanwoo steers. Other studies have reported regions of 6.0 to 26.7 cM in a Charolais×Holstein cross population (Gutierrez-Gil et al., 2010), 68 to 89 cM (Mizoguchi et al., 2006), and 94 cM in Japanese black cattle (Sugimoto et al., 2007). Another study reported QTL mapping for nine carcass traits, including marbling, body weight, and fat depth in a Belgian Blue× MARC III population. The QTL region for marbling mapped at 21 cM on chromosome 17 (Casas et al., 2000). The mapping region on BTA22 was reported in a Charolais ×Holstein population (Gutierrez-Gil et al., 2009). The other studies reported that a significant region mapped for the fat component trait at 19.5 to 32 cM on BTA22 in a Charolais ×Holstein cross population (Gutierrez-Gil et al., 2010). BTA29 was suggested as a region with a marbling score at 42 and 48 cM in a Hereford×CGC cross breed population (MacNeil and Grosz, 2002).
Functional analysis of candidate genes
The results from QTL fine mapping using LDLA yielded 95 candidate genes. We also performed functional annotation using GO terms. Table 4 shows significant GO terms that involving carbohydrates (Kobayashi et al., 2010) and amines (Selman et al., 2006) metabolism. Particularly, carbohydrates are known to participate in lipid metabolism. Especially, concentrations of glucose in feed affect the production of fatty acids in liver and the content of cholesterol or lipid in blood (O’Dea et al., 1989).
Pathway analysis was performed using Pathway Studio of the candidate genes. We found genes that had direct interactions with each other (e.g., TLR1, TLR6, TRL10, PAK1, and SCARB1).
The Toll-like receptor (TLR) family (TRL1 to TLR10) is known to be involved in the initiation of immune responses against pathogens by activating pro-inflammatory signaling pathways (Kim et al., 2011b). TRL families that play a role as receptors have different ligands, Tri-acyl lipopeptides of bacteria or mycobacteria are ligands for TLR 1 and Di-acyle lipopeptides of mycoplasma are ligands for TLR 6, but it is not clear what is the ligand for TLR10 (Takeda et al., 2003). In particularly, TLR1 and TLR6 are recognized along with TLR2 as being involved with the release of IL-6 and NF-κB in adipocytes (Schaffler and Scholmerich, 2010). The role of TLR10 in adipocytes is not clearly explained. However, it is expressed in adipose tissue and it is suggested that TLR10 is restricted to nonadipocyte cells of the adipose tissue (Kopp et al., 2009). These activated genes (IL-6 and NF-κB) in adipose tissue are known to be related to insulin resistance (Anderson et al., 2007). Also, these TLR families are known to be involved in insulin resistance in peripheral tissues through regulation of production of various adipocytokines (e.g. adiponectin, resistin, and leptin) and proinflammatory cytokines (e.g. TNFα, IL-6, and iL-1) (Caesar et al., 2010; Kim et al., 2011b).
The p21-activated kinase-1 (PAK1) plays a role in blocking Scavenger receptor class B, type I (SCARB1) by down-regulating activities that promote SCARB1 in the lipopolysaccharide-activated PAK1 pathway (Hullinger et al., 2001; Miquel et al., 2003). In this pathway, the down-regulation of SCARB1 occurs by reducing the transcription factor binding to the myeloid zinc finger protein 1-like element in the SCARB1 promoter (Hullinger et al., 2001; Miquel et al., 2003). Other studies have reported that SCARB1 has been found in macrophage-derived, lipid-loaded cells (Ji et al., 1997; Hirano et al., 1999; Staels et al., 2000; Miquel et al., 2003), suggesting that SCARB1 is involved in lipid deposition.
The role of SCARB1 in intramuscular fat content
SCARB1 is involved lipid catabolism and regulation of lipid storage according to the functional analysis. It is a receptor for efflux or endocytosis of HDL (high density lipoproteins) located in the membranes of the RCT (reverse cholesterol transport) pathway (Rigotti et al., 1997; Daniels et al., 2010).
The RCT pathway is known to be involved in cholesterol homeostasis by delivering cholesterol from the periphery of cells to the liver and affecting on fat phenotypes in humans and model animals (Fielding and Fielding, 1995; Rader et al., 2009). Also, the RCT pathway was reported to be associated with fat composition (kidney, pelvic, and heart fat percentage and subcutaneous fat depth) and muscle growth (rib-eye muscle area) in cattle (Daniels et al., 2010). Several up- and downstream genes in our pathway analysis results were shown to involve the RCT pathway, where PPARs and APOA1 participate in the regulation of SCARB1 activation (Barbier et al., 2002). Figure 2(B) shows the regulation of SCARB1 by PPARs, known to be involved in lipid metabolism, cellular differentiation, inflammation (Staels et al., 2000), and deposition of intramuscular fat in cattle (Lee et al., 2008; Wang et al., 2009). FABP1 is also related to the RCT pathway and plays a role in lipid transport across the cellular membrane (Fielding and Fielding, 1995). Also, PPARs and FABP1 as well as known involving fat deposition and contents of marbling.
This study suggests that SCARB1 participates in the RCT pathway and positively associates with PPARs and FABP1, affecting intramuscular fat deposition (marbling) in Hanwoo cattle.
ACKNOWLEDGEMENT
This study was supported by the next generation Biogreen 21 project (PJ008188) and the Agenda project of Rural development administration (RDA) in Korea.