Effect of Dietary Concentrate:forage Ratios and Undegraded Dietary Protein on Nitrogen Balance and Urinary Excretion of Purine Derivatives in Dorper×thin-tailed Han Crossbred Lambs
Article information
Abstract
This study aimed to investigate dietary concentrate: forage ratios (C:F) and undegraded dietary protein (UDP) on nitrogen balance and urinary excretion of purine derivatives (PD) in lambs. Four Dorper×thin-tailed Han crossbred castrated lambs with 62.3±1.9 kg body weight at 10 months of age were randomly assigned to four dietary treatments in a 2×2 factorial arrangement of two levels of C:F (40:60 and 60:40) and two levels of UDP (35% and 50% of CP), according to a complete 4×4 Latin-square design. Each experimental period lasted for 19 d. After a 7-d adaptation period, lambs were moved into individual metabolism crates for 12 d including 7 d of adaption and 5 d of metabolism trial. During the metabolism trial, total urine was collected for 24 h and spot urine samples were also collected at different times. Urinary PD was measured using a colorimetric method and creatinine was measured using an automated analyzer. Intake of dry matter (DM) (p<0.01) and organic matter (OM) (p<0.01) increased as the level of UDP decreased. Fecal N was not affected by dietary treatment (p>0.05) while urinary N increased as the level of UDP decreased (p<0.05), but decreased as dietary C:F increased (p<0.05). Nitrogen retention increased as dietary C:F increased (p<0.05). As dietary C:F increased, urinary excretion of PD increased (p<0.05), but was not affected by dietary UDP (p>0.05) or interaction between dietary treatments (p>0.05). Daily excretion of creatinine was not affected by dietary treatments (p<0.05), with an average value of 0.334±0.005 mmol/kg BW0.75. A linear correlation was found between total PD excretion and PDC index (R2 = 0.93). Concentrations of creatinine and PDC index in spot urine were unaffected by sampling time (p>0.05) and a good correlation was found between the PDC index (average value of three times) of spot urine and daily excretion of PD (R2 = 0.88). These results suggest that for animals fed ad libitum, the PDC index in spot urine is effective to predict daily excretion of PD. In order to improve the accuracy of the spot sampling technique, an appropriate lag phase between the time of feeding and sampling should be determined so that the sampling time can coincide with the peak concentration of PD in the urine.
INTRODUCTION
Metabolizable protein (MP) consisting of digestible undegraded dietary protein (UDP) and microbial protein has been used to evaluate protein requirements of ruminants in modern nutritional systems (AFRC, 1998; CSIRO, 2007; NRC, 2007). Microbial protein accounted for more than 50% of the amino acids absorbed in the small intestine (AFRC, 1992) and its synthesis directly indicated the synchronization of supply of dietary carbohydrates and protein (Tamminga, 1996). Various marker systems for evaluating microbial nitrogen (MN) in the rumen were developed, such as purine bases (PB) and nitrogen isotope (15N) (Pérez et al., 1996; Carro and Miller et al., 2002; Reynal et al., 2005). However, applying those markers requires surgical operations on animals, thus the number of This is an open-access article distributed under the terms of the Creative Commons Attribution Non-Commercial License (http://creativecommons.org/licenses/by-nc/3.0/), which permits unrestricted non-commercial use, distribution, and reproduction in any medium, provided the original work is properly cited. experimental animals is often limited due to high cost in maintaining cannulated animals (Ma et al., 2013). Alternatively, use of urinary purine derivatives (PD) to predict MN synthesis in the rumen is non-invasive and relatively accurate (Tas and Susenbeth, 2007).
On the other hand, control of N excretion from livestock to environment has gained great concern in recent years. One of the main concerns is the asynchrony between the rate at which carbohydrates and proteins are degraded in the rumen and contribute to N losses in urine (Stern et al., 1994). Thus it is of great importance to ensure efficient utilization of dietary carbohydrates and protein by ruminants to optimize microbial protein synthesis and reduce N output. Nonstructural and structural carbohydrates as well as protein are dietary components that can potentially be manipulated to optimize ruminal fermentation and to increase synthesis of MN in the rumen (Clark et al., 1992). However, previous studies focused mainly on the effects of dietary carbohydrate and protein degradability in dairy cows (Pina et al., 2009) or beef heifers (Duarte et al., 2011), but not on sheep or goats.
Dorper breed sheep, which are famous for their hardiness, early maturity, and rapid growth (Cloete et al., 2000), have recently been imported into China as a meat sire breed to improve growth performance and the carcass traits of the thin-tailed Han sheep, a Chinese indigenous sheep breed well- known for its precociousness and prolificacy (Cheng, 1984). Thus Dorper×thin-tailed Han crossbred lamb is now becoming one of the dominant sources for lamb meat production in China. This study was therefore conducted to evaluate the effect of dietary concentrate:forage ratios (C:F) and UDP levels on nitrogen balance and urinary excretion of PD in Dorper×thin-tailed Han crossbred lambs. Additionally, a spot sampling technique was also applied to evaluate its accuracy in predicting daily PD excretion.
MATERIALS AND METHODS
Animals and dietary treatments
This study was conducted from July 2012 to September 2012 at the Experimental Station of the Chinese Academy of Agricultural Sciences (CAAS) in Nankou, Beijing, China. The animals were kept in an enclosed facility equipped with heating radiators, and the mean temperature recorded inside the facility during the experimental period was 25.0°C (22.5°C to 28.0°C). The experimental procedures were approved by the Animal Ethics Committee of CAAS, and humane animal care and handling procedures were followed throughout the experiment.
Four 10-month-old Dorper×thin-tailed Han crossbred castrated lambs (62.3±1.9 kg body weight) were ruminally cannulated and used in this study 4 months after the surgery. In a 4×4 Latin-square experimental design, the lambs were randomly assigned to 4 dietary treatments in a 2×2 factorial arrangement: two levels of concentrate:forage (C:F, 40:60 and 60:40), and two levels of undegraded dietary protein (UDP, 35% and 50% of CP). The ingredients and chemical composition of the experimental diets are presented in Table 1. Lambs were fed twice daily at 08:00 h and 16:00 h for ad libitum intake, allowing for approximate 10% refusals. Clean water was available at all times. Each experimental period lasted for 19 d: The first 7 d were used for adaptation to dietary treatment. Lambs were then moved into individual crates for 12 d including 7 d of adaption and 5 d of a metabolism trial. All lambs were weighed at the beginning and end of the trial in each period.

Ingredient and chemical composition of experimental diets (% of DM)
Measurements and sample collection
In the metabolism trial, samples of feed were collected daily, combined, dried at 65°C for 72 h, and ground through a 1-mm sieve. Feed refusals were weighed, sampled, dried, ground, and combined for each lamb before analysis. Faeces were weighed daily, and then a sample of 10% was collected. The samples were pooled for each animal, dried at 65°C, and then ground through a 1-mm sieve before analysis. Urine from each lamb was also collected daily in a bucket containing 100 mL of 7.2 N H2SO4. The volume was measured and then diluted to 5 L with tap water, and a sample of 20 mL was collected, pooled for each animal, and stored at −20°C for analyzing total N and PD. Urinary spot samples were collected between 8:00 h and 9:30 h, 14:00 h and 15:30 h and 20:00 h and 21:30 h during the collection period. After collection of a urinary spot sample, 10 mL was sub-sampled, acidified with 1 mL of 10% H2SO4 and diluted four times with tap water. The whole of the diluted sub-sample was placed in a plastic bottle and kept at −20°C. Subsequent sub-samples were added into the same collection bottle. Urinary spot samples taken at different times from each animal were stored in separate bottles, thus three bottles were designated for the collection of urinary spot samples for each animal. The remaining urine was poured back into the collection bucket after taking a spot sample.
Chemical analysis
Dry matter was determined by drying samples in a forced-air oven at 135°C for 2 h (method 930.15; AOAC, 1990); Organic matter was measured as the difference between DM and the ash content (method 938.08; AOAC, 1990). Gross energy was measured using a bomb calorimeter (C200, IKA Works Inc., Staufen, Germany). Nitrogen was determined by the Kjeldahl method, using Se as a catalyst, and crude protein was calculated as 6.25×N. Dietary content of RDP was estimated using the in situ method by incubating samples in the rumen for 72 h. Feed preparation, nylon bags, rumen incubation program, and washing and drying procedures were completed as described by Volden and Harstad (1995). Ether extract (EE) was measured by weight loss of the dry matter on extraction with diethyl ether in Soxhlet extraction apparatuses for 8 h (method 920.85; AOAC, 1990). Neutral-detergent fibre (NDF) and acid-detergent fibre (ADF) were determined according to Van Soest et al. (1991) and Goering and Van Soest (1970), respectively. Urinary PD including allantoin, uric acid, xanthine, and hypoxanthine were quantified separately by the colorimetric method of Chen and Gomes (1995). Creatinine was measured by commercial kits (C011 Creatinine Kit, Jiancheng Bioengineering Institute, Nanjing, China) using an automated analyzer (ZY-310, Kehua Enterprise Development Co., Ltd, Shanghai, China).
Calculations and statistical analysis
The amount of microbial purines absorbed (X, mmol/d) corresponding to urinary PD (Y, mmol/d) was calculated based on the relationship derived by Chen and Gomes (1995), as
The supply of microbial N in gram per day was estimated as follows:
Where 0.83 is the digestibility of microbial purine, 70 is the N content of purines (mg N/mmol), 0.116 is the ratio of purine-N:total N in mixed rumen microbes.
Data for intake, nitrogen balance, urinary PD, creatinine, and PDC index in urine collected during 24 h were analyzed as an 4×4 Latin square using the MIXED procedure of SAS (version 9.1; SAS Institute, Inc., Cary, USA). The effect of dietary treatments (C:F and UDP) and period were considered as fixed effect and lamb was considered as random effect. Observations of urinary PD, creatinine, and PDC index calculated from spot urine samples were analyzed as repeated measures. The statistical model used included C:F, UDP, C:F×UDP, period, time, C:F×time, UDP ×time, and C:F×UDP×time as fixed effects, and lamb as a random effect. Data for each variable were analyzed using compound symmetry, unstructured, and autoregressive covariance structures, and the one that produced the minimum Akaike’s information criterion was chosen. Statistical significance was accepted when p<0.05.
RESULTS AND DISCUSSIONS
Feed intake
The DM and OM intakes (Table 2) were not affected by dietary C:F (p>0.05), but increased with decreasing level of UDP (p<0.01). The DM intake in our study ranged from 1.4 to 1.7 kg/d. These observations were in accordance with those of Kiran and Mutsvangwa (2007) who found an increasing dietary RDP level from 60% of CP to 70% of CP increased DM intake in growing lambs (ranging from 1.3 to 1.6 kg/d). Feed intake is affected by factors including palatability, feeding frequency, and nutrient levels. The impact of supplementation of RDP on forage intake is likely related to improvements in fiber digestion and, subsequently, rate of passage (Arroquy et al., 2004). It is also possible that RDP supplementation affected passage rate and intake by impacting gastrointestinal motility (Egan and Moir, 1965). Similar to our results, Cantalapiedra et al. (2008) and Ramos et al. (2009) found no effect of dietary C:F (30:70 and 70:30) on DM or OM intake in goats and sheep fed diets beyond maintenance level, respectively.

Nutrient intakes and nitrogen balance in lambs fed diets differing in C:F and level of UDP
Nitrogen balance
All lambs maintained a positive nitrogen balance in the current study (Table 2). Nitrogen intake was not affected by dietary C:F (p>0.05), but increased as level of UDP decreased (p<0.05). As the diets used in the present study were iso-nitrogenous, N intake followed the same pattern as DM intake.
Fecal N was not affected by dietary treatments (p>0.05). However, Urinary N was reduced (p<0.05) with increasing dietary C:F, but increased as UDP level decreased (p<0.05). Nitrogen in feces is the sum of undigested dietary N, microbial fecal N, and endogenous N, while urinary N excretion was a combined consequence of the absorption of ammonia N from the rumen and recycling of that N back into the gut, which was in turn related to the composition of the diet and the ruminal utilization efficiency of dietary N (Moorby et al., 2006). In the current study, fecal N was stable for all groups and took approximate 42% of N intake while the proportion of urinary N to N intake decreased from 45% to 27% as dietary C:F increased, and this proportion increased by approximate 7% as level of UDP decreased.
A significant change in urinary N rather than fecal N in the present study indicated that the main route for output of dietary N in excess of animal requirements was via the urine. As the experimental diets were designed as iso-caloric and iso-nitrogenous, the main dietary factor contributing to the difference in urinary N between lamb fed diets differing in C:F could be the structure of the carbohydrates. Diets higher in NFC can provide more available energy to rumen microbes than diets higher in NDF, which in turn can better utilize degraded protein and reduce the N output in urine. On the other hand, it was reported (Reynal and Broderick, 2005) that protein degradability had a limited effect on fecal N output but had a major effect on urine N output because of the excess N in the rumen from diets with a higher proportion of RDP. The imbalance of N availability and N capture by microbes in diets with excessive degradable protein contents resulted in surplus N in the rumen which was converted to urea and excreted via the urine (Kebreab et al., 2002).
Purine derivatives, creatinine in total urine and microbial N
Excretion of PD and creatinine in total urine, PDC index, and microbial N (MN) are shown in Table 3. In the current study, allantoin was the dominant PD, then followed by uric acid and xanthine plus hypoxanthine. Similar patterns were also reported by Lindberg (1989) and Belenguer et al. (2002) in goats. Urinary excretion of allantoin and total PD increased (p<0.01) as dietary C:F increased, while uric acid and xanthine plus hypoxanthine was not affected by dietary treatments (p>0.05). This could be partly explained by the relatively lower concentrations of uric acid (averaged 8.8%) and xanthine plus hypoxanthine (averaged 6.3%) than allantoin (averaged 84.8%) in urine.

Urinary purine derivatives, creatinine, and PDC index in total urine and microbial N in lambs
Creatinine is an indicator of body protein turnover and creatinine in urine is excreted in proportion to live weight (Brody, 1964). As body weight of lambs in our study was similar, a relatively constant urinary creatinine output was observed (0.33±0.02 mmol/kg BW0.75). This value is higher than that reported by Balcells et al. (1991) in ewes (0.29 mmol/kg BW0.75) but lower than that reported by Chen et al. (1995) also in ewes (0.47 mmol/kg BW0.75). It is conceivable that between breed/species differences in musculature and variations in body weight could account for these discrepancies (George et al., 2006). The ratio of PD:C was corrected for metabolic body weight to facilitate comparison between animals of different body weight, and this W0.75-corrected PD:C ratio is referred to as ‘PDC index’ (Guerouali et al., 2004). Dietary effects on PDC index in the current study followed the same pattern as urinary PD, and a linear correlation existed between total PD excretion and PDC index (R2 = 0.93; Figure 1).

Correlation between PD excretion (Y, mmol/d) and PDC index (X) in total urine of lambs fed diets differing in C:F and level of UDP: Y = 0.30X+1.21, R2 = 0.93.
Microbial N was higher for lambs fed 60:40, C:F diet comparing with those fed 40:60 diet (p<0.05), but no effect of UDP level was observed (p>0.05). This result was in accordance with that reported by Pina et al. (2009) in beef heifers. Microbial protein produced in the rumen was found to always be higher when the diet contained higher proportion of nonstructural carbohydrates in DM (Hoover and Stokes, 1991). It is likely that N supply for microbial growth was not limiting under current dietary regime, thus UDP level did not affect MN synthesis estimated using urinary PD excretion. Previous studies in goats (Cantalapiedra et al., 2008) and sheep (Ramos et al., 2009) have shown that increasing the proportion of concentrate in diet could result in a higher microbial yield. The higher MN synthesis could be the result of the higher availability of rumen fermentable carbohydrates, as the rate and extent of carbohydrate fermentation are two of the major factors controlling energy available for microbial growth (Russell et al., 1992). However, Russell et al. (1992) reported that at a NDF content lower than 200 g/kg DM, the MN yield was reduced by 2.5% to 3.0% per unit decrease of NDF. All the diets used in the current study were above the limit of this NDF level.
Purine derivatives and creatinine concentration in spot urine
Concentrations of urinary PD, creatinine, and PDC index in spot urine are shown in Table 4. Allantoin accounted for 84% of total PD then followed uric acid (14%) and xanthine plus hypoxanthine (2%). Concentrations of total PD (p<0.05), allantoin (p<0.05), uric acid (p<0.05), and PDC index increased (p<0.05) with increasing level of dietary C:F, but were not affected by sampling time (p>0.05). Concentration of creatinine was also unaffected by sampling time (p>0.05). All above entries were not affected by level of UDP (p>0.05). These results indicate that when a given feed is offered ad libitum to animals with varying body weights, the PD concentration and PDC index in urinary spot samples may vary within narrow bounds despite intake varying quite widely. Similarly to Chen et al. (1992), who reported that insignificant diurnal fluctuations in the plasma allantoin concentration and urinary PD/C ratio occurred in steers fed twice daily.
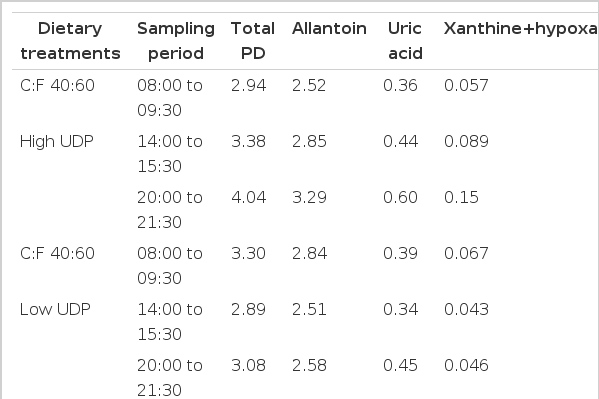
Urinary purine derivatives, creatinine concentrations, and PDC index in spot urine of lambs
A linear correlation existed between the daily PD excretion and PDC index in each sampling period (R2 = 0.63, 0.83, and 0.80 for 08:00 to 09:30, 14:00 to 15:30, and 20:00 to 21:30 h, respectively). When the PDC index from three spot urine samples were averaged, an overall correlation was established between daily PD excretion and averaged PDC index for spot urine (R2 = 0.88; Figure 2). A similar correlation was also found in sheep (R2 = 0.81) when spot urine was collected hourly (Chen et al., 1995). Chen et al. (2004) reviewed that the coefficient of variation (CV) for the PD/creatinine ratio from a single spot sample was 11% to 16% and if the mean of four samples was used, the CV would be reduced to about 4%. Thus multiple samples are required to obtain a measurement representative of the dietary regime. However, it is inconvenient to collect spot urine samples intensively (e.g. every hour) under practical circumstances otherwise; the advantage of using spot samples would be compromised. From the current study, we observed a weaker relationship between daily PD excretion and PDC index calculated from spot urine collected between 08:00 to 09:30 compared with that between 14:00 to 15:30 h or 20:00 to 21:30 h. Similarly, Fujihara et al. (2005) found that when feed was given ad libitum and spot urine were collected hourly, the highest correlation between daily total PD excretion and PD concentration occurred in spot urine collected 7 to 8 h after morning feeding in sheep fed twice daily (09:00 and 17:00). For animals fed ad libitum, the supply of microbial protein at the post-ruminal gut will have peak periods depending on meal periods, and the size of each peak should be proportional to the meal size (Nsahlai et al., 2000). Low sensitivity in predicting total PD excretion from spot urine collected between 08:00 to 09:30 h may indicate that this time span fell, or partly fell in the lag phase for the hydration and colonization of feed particles by rumen microbes during which time the supply of MN as well as microbial purine bases cannot be properly reflected by the concentration of PD in spot urine. Thus the collection of spot urine should be avoided immediately after feeding because when feed is given ad libitum, animals do not eat continuously (Sauvant et al., 1996), but tend to consume feed in large meals, as we observed in current study. Therefore, an appropriate lag phase between the time of feeding and sampling should be determined so that the sampling time can coincides with the peak concentration of PD in the spot urine.

Correlation between PD excretion (Y, mmol/d) and PDC index (X) in three periods of spot urine samples: Y = 0.22X+3.55, R2 = 0.88.
CONCLUSIONS
Current study showed that increasing dietary UDP level decreased intake of DM, OM. Urinary N output decreased with either increasing dietary UDP or C:F. Both Nitrogen retention and urinary PD increased as dietary C:F increased, but were not affected by dietary UDP or interaction between treatments. The PDC index in spot urine is effective in predicting daily excretion of PD with a linear correlation found between the PDC index (average value of three times) of spot urine and daily excretion of PD (R2 = 0.88). Further studies are needed to determine an appropriate lag phase between the time of feeding and sampling so that the sampling time can coincides with the peak concentration of PD in the spot urine.
ACKNOWLEDGEMENTS
This study was supported by the earmarked fund for Modern Agro-industry Technology Research System- nycytx-39 and the authors are thankful to the Ministry of Agriculture of the People’s Republic of China for providing financial assistance.