Variance Components and Genetic Parameters for Milk Production and Lactation Pattern in an Ethiopian Multibreed Dairy Cattle Population
Article information
Abstract
The objective of this study was to estimate variance components and genetic parameters for lactation milk yield (LY), lactation length (LL), average milk yield per day (YD), initial milk yield (IY), peak milk yield (PY), days to peak (DP) and parameters (ln(a) and c) of the modified incomplete gamma function (MIG) in an Ethiopian multibreed dairy cattle population. The dataset was composed of 5,507 lactation records collected from 1,639 cows in three locations (Bako, Debre Zeit and Holetta) in Ethiopia from 1977 to 2010. Parameters for MIG were obtained from regression analysis of monthly test-day milk data on days in milk. The cows were purebred (Bos indicus) Boran (B) and Horro (H) and their crosses with different fractions of Friesian (F), Jersey (J) and Simmental (S). There were 23 breed groups (B, H, and their crossbreds with F, J, and S) in the population. Fixed and mixed models were used to analyse the data. The fixed model considered herd-year-season, parity and breed group as fixed effects, and residual as random. The single and two-traits mixed animal repeatability models, considered the fixed effects of herd-year-season and parity subclasses, breed as a function of cow H, F, J, and S breed fractions and general heterosis as a function of heterozygosity, and the random additive animal, permanent environment, and residual effects. For the analysis of LY, LL was added as a fixed covariate to all models. Variance components and genetic parameters were estimated using average information restricted maximum likelihood procedures. The results indicated that all traits were affected (p<0.001) by the considered fixed effects. High grade B×F cows (3/16B 13/16F) had the highest least squares means (LSM) for LY (2,490±178.9 kg), IY (10.5±0.8 kg), PY (12.7±0.9 kg), YD (7.6±0.55 kg) and LL (361.4±31.2 d), while B cows had the lowest LSM values for these traits. The LSM of LY, IY, YD, and PY tended to increase from the first to the fifth parity. Single-trait analyses yielded low heritability (0.03±0.03 and 0.08±0.02) and repeatability (0.14±0.01 to 0.24±0.02) estimates for LL, DP and parameter c. Medium heritability (0.21±0.03 to 0.33±0.04) and repeatability (0.27±0.02 to 0.53±0.01) estimates were obtained for LY, IY, PY, YD and ln(a). Genetic correlations between LY, IY, PY, YD, ln(a), and LL ranged from 0.59 to 0.99. Spearman’s rank correlations between sire estimated breeding values for LY, LL, IY, PY, YD, ln(a) and c were positive (0.67 to 0.99, p<0.001). These results suggested that selection for IY, PY, YD, or LY would genetically improve lactation milk yield in this Ethiopian dairy cattle population.
INTRODUCTION
The majority of Ethiopian cattle (e.g., Boran and Horro) are low producers of milk with high individual variability (Yohannes et al., 2002) which is attributed to natural selection to the tropical environment and management. Milk yield could be increased through within and between breed selection and crossbreeding with cattle from improved dairy breeds. The strategy currently employed in Ethiopia to increase milk yield is by crossbreeding locally adapted Bos indicus breeds capable of withstanding heat stress, diseases, low feed supply and low management level with Bos taurus dairy breeds of high genetic ability for milk yield. This mating scheme has resulted in a variety of crossbred groups with different levels of additive and non-additive genetic abilities.
Variance components and genetic parameters are needed for genetic improvement programs to predict the breeding values of candidates for genetic selection, to choose among mating plans and to predict selection response (Montaldo et al., 2012). Knowledge of the type and amount of genetic variation and distribution of animals for traits considered for selection in the population can help design optimum breeding programs (Willham and Pollak, 1985). Additive genetic variation has been instrumental for the genetic improvement of traits of economic importance in dairy cattle populations (Willham and Pollak, 1985).
Numerous estimates of genetic parameters for production traits have been reported (Kahi et al., 2000; Demeke et al., 2004; Espinoza et al., 2007). These parameter estimates are specific to particular populations. Estimates of genetic parameters could change due to selection, migration of genes from one population to another, or changing environmental conditions (Van Der Werf and De Boer, 1989). Parameter estimates for one population or breed may not be appropriate for use in another population. Limited research has been done to estimate variance components and genetic parameters for lactation pattern and milk production traits and parameters of a lactation curve function in Ethiopian dairy cattle populations. Thus, the objective of this study was to estimate variance components and genetic parameters (i.e., heritability, repeatability, genetic and phenotypic correlations) for lactation pattern and milk production traits and parameters of a lactation curve function in a multibreed Ethiopian dairy cattle population.
MATERIALS AND METHODS
Description of the study area, animals and data
The study was based on dairy cattle milk data from Bako, Debre Zeit and Holetta Research Centers, Ethiopia. The Bako Agricultural Research Center is located 250 km West of Addis Ababa at an altitude of 1,650 m above sea level. The area receives a mean annual rainfall of 1,200 mm in a bimodal distribution, 80% of which falls from May to September. In this area, the average relative humidity is 59%, and the average minimum and maximum temperatures are 13.5°C and 27°C, respectively (Gebreyohannes et al., 2013).
The Debre Zeit Research Station of the International Livestock Research Institute (ILRI) is located approximately 50 km south East of Addis Ababa, in the Ethiopian highlands (9°N and 39°E), at an altitude of approximately 1,850 metres above sea level. The average annual rainfall in the Debre Zeit area is approximately 866 mm. The annual average temperature is 18.7°C and the average monthly relative humidity is 52.4% (Haile et al., 2011).
The Holetta Agricultural Research Centre is located 45 km west of Addis Ababa at 38.5°E longitude and 9.8°N latitude, and elevation of 2,400 metres above sea level. It is situated in the central highlands of Ethiopia. Average annual rainfall is approximately 1,200 mm. The annual average temperature is 18°C and the average monthly relative humidity is 60% (Demeke et al., 2004; Haile et al., 2011).
The herds in these three centers were genetically linked by the use of common sires supplied from the National Artificial Insemination Centre (NAIC). All of them used at least one common indigenous breed as dams of the replacement cows. Mating took place throughout the year using both artificial insemination and natural service. The bulls for natural services were those selected from the available males in the herd by visual appraisal. The Boran (B) and Horro (H) cattle (Bos indicus) used as a foundation stock for crossbreeding were bought from farmers in the Southern and Western Ethiopia, respectively. The herd from Debre Zeit research center was B and their crosses with Friesian (F).
Animals in this population were purebred B and H (Alberro and Hailemariam, 1982), and their crosses with F, Jersey (J) and Simmental (S) recorded by the Bako and Holetta research centers, and B and F×B crosses in Debre Zeit research station. This mating strategy generated 23 straightbred and crossbred groups (Table 1).
Lactation curve function and parameters
The modified incomplete gamma function (MIG; Papajcsik and Bodero, 1988) was chosen to be used in this study for its goodness of fit to the monthly test-day milk data and predictive ability of lactation milk yields (Gebreyohannes et al., 2013). The incomplete gamma (IG) is represented by yt = atbe−ct where t is the length of time since calving. The MIG assumes the parameter b of the IG function to be equal to one, i.e., yt = ate−ct. Here, the log-transformed linear form of MIG ((ln(yt/t) = ln(a)+(−ct)) was used to fit to the monthly test-day milk data using the regression procedure (SAS, 2003). The yt is milk yield (kg) at time t (d) after calving, and a, b and c are parameters of the functions. The parameter a is a scaling factor associated with the average yield, b is related to pre-peak curvature and c is related to post-peak curvature. Parameters of the MIG function were obtained as an output from the regression analysis fitting the MIG function to each lactation of each cow. Cows with lactation lengths shorter than 90 d (three monthly test-day records) were excluded from the analysis and longer lactations were truncated to 305-d lactation length. A total of 59,413 monthly test-day milk records were used to estimate the parameters of the MIG function.
Data analysis
The data covered a period from 1977 to 2010 for Bako and Holetta, and 1989 to 2006 for Debre Zeit research center. The analysis used 5,507 lactation milk records of 1,639 cows from 283 sires. The traits considered were lactation milk yield (LY, kg), initial milk yield (IY, kg), peak milk yield (PY, kg), average daily milk yield (YD, milk yield per day of lactation, kg), days to peak (DP, d), lactation length (LL, d), and parameters of the MIG function (i.e., ln(a) and c). Phenotypic means by breed group and parity were compared using least squares means (LSM). The model used to compute LSM included the effects of herd-year-season of calving, parity and breed group subclasses for all traits (LY, IY, PY, YD, DP, LL, ln(a) and c). In addition, the model for LY included LL as a covariate to account for LL differences among cows. Computations were done with the GLM procedure of the Statistical Analysis System (SAS, 2003). The model for IY, PY, YD, DP, LL, ln(a) and c was:
Where
Yijkl = Observation on lth cow that calved in ith herd-year-season of calving, jth parity, kth breed group subclasses,
μ = Overall mean,
HYSi = ith calving herd-year-season subclasses (i = 1 to 325),
Pj = jth parity (j = 1, 2, 3, 4, 5, 6 and ≥7),
BGk= kth breed group (k = 1 to 23; Table 1), and
eijkl = residual associated with yijkl.
In addition to all the effects in the model above, the model for LY included the covariate term b LLijkl, where b = regression coefficient of LY on LL, and LLijkl = lactation length of the lth cow that calved in ith herd-yr-season of calving, jth parity, and from kth breed group. The LSM for breed groups and parities were compared using Bonferroni t-tests (SAS, 2003).
Estimation of variance components and genetic parameters
Variance components were estimated using an Average Information Restricted Maximum Likelihood (AI-REML) procedure with the ASREML software (Gilmour et al., 2009). Single and two-trait animal repeatability models composed of fixed (i.e., herd-year-season, parity and regressions on cow H, F, J, and S breed fraction and general heterosis) and random (i.e., animal additive genetic, permanent environment and residual) effects were used to estimate variance components and to predict breeding values. Lactation length was considered as a covariate only for LY analysis. The general heterosis of cow involved interbreed interactions between alleles of any two different breeds among the 5 breeds (H, B, F, J, and S) present in the population. The H, F, J, and S breed effects were computed as a deviation from the Boran. Eight single-trait (LY, IY, PY, YD, DP, LL, ln(a) and c) analyses were performed to estimate variances, heritability and repeatability, and predict breeding values. The single trait animal repeatability model in matrix notation could be described as:
y = the vector of observations (i.e., LY, IY, PY, YD, DP, LL, ln(a) and c),
b = vector of fixed effects of herd-year-season and parity subclasses, and LL covariate for LY only,
g = vector of fixed breed effects,
a = vector of random animal additive genetic effects,
pe = vector of random permanent environmental effects,
e = vector of random residual effects,
X = incidence matrices relating records to fixed herd-year-season and parity, and LL covariate for LY only,
Q = matrix relating observations to breed effect (through H, F, J, and S breed fractions) and general heterosis (through heterozygosity fraction),
Z = incidence matrices relating records to animal additive genetic effects, and
W = incidence matrices relating records to permanent environmental effects.
The model assumed an expected value of y to be Xb+ Qg. The vector of direct animal additive genetic effects was assumed to have a normal distribution with mean zero and variance
where yi is vector of observation for the ith trait; bi is vector of fixed effects (i.e., HYS, parity, and LL covariate for LY only), gi is vector of cow breed and general heterosis effects for the ith trait; ai is vector of animal direct genetic effects for the ith trait; Xi, Zi, and Wi are incidence matrices that relate fixed (herd-year-season and parity subclasses and covariate), animal direct genetic and permanent environmental effects to observations for the ith trait, respectively and Qi is matrix relating observations to breed effect (through H, F, J, and S breed fractions) and general heterosis (through heterozygosity fraction). The model assumed the expected value for trait i (yi) to be Xibi+Qigi. The vectors of direct animal additive genetic effects, permanent environment and residual effects for each trait were assumed to be normally distributed with mean zero. The variance-covariance structure of the random effects for a bivariate animal repeatability model could be described as:
where
Estimation of breeding values and sire rank correlations
Sire estimated breeding values (EBV) were computed from the Best Linear Unbiased Prediction (BLUP) solutions obtained from ASREML (Gilmour et al., 2009). The EBV for an animal was calculated as the sum of the generalized least squares (GLS) estimate of the difference between its breed group and B plus its predicted random additive genetic value. In matrix notation the EBV for each animal could be computed as:
Where û is the EBV of an individual for a particular trait, ĝ is a vector of GLS estimates of differences between breeds H, F, J, and S and breed B, p' is the transpose of the vector of fractions of H, F, J, and S breeds in an individual, and â is the predicted random animal additive genetic value (i.e., from p' ĝ ; Elzo and Famula, 1985; Arnold et al., 1992; Koonawootrittriron et al., 2002). The ranks of the sires EBV for each trait were tested using Spearman’s Rank correlations for significant association between the ranks of the sires for pairs of traits using the CORR procedure of the SAS (SAS, 2003). Genetic trends across years were evaluated using a regression analysis of mean yearly EBV for each trait calculated from solutions for each herd-year-season contemporary group and regressed on year. The year data collection started, i.e., 1977, was considered as the base year.
RESULTS AND DISCUSSION
Factors affecting the lactation pattern and milk production traits
Herd-year-season, parity and breed group subclasses were important factors (p<0.001) for all traits (LY, IY, PY, YD, DP, LL, ln(a) and c). Crossbred cows had higher least squares means (LSM) for LY, IY, PY, and YD, and longer LSM for LL than B and H breeds (Table 2). The 13/16F 3/16B crossbred cows had the highest LSM for LY (2,490±178.9 kg), IY (10.5±0.8 kg), PY (12.7±0.9 kg) and YD (7.6±0.55 kg) and the longest LL (361.4±31.2 days). Upgrading crossbred F×B or F×H from 50% to 87.5% F showed no significant increase in LSM for LY, IY, PY, and YD. However, the H cows yielded higher LSM for LY (1,210±37.9 kg vs 947±42.3 kg), IY (3.9±0.2 kg vs 1.0±0.2 kg), PY (5.5±0.2 kg vs 3.5±0.2 kg) and YD (2.8±0.12 kg vs 1.8±0.13 kg) and milked longer (234.9±6.5 kg vs 211.1±7.2 kg) than B cows. These differences among breed groups agreed with previous reports (Kahi et al., 2000; Demeke et al., 2004; Wolf et al., 2005) suggesting that biological differences among indigenous (B and H) and exotic parental populations (F, J, and S) may help explain differences in additive and non-additive genetic effects among breed groups in this study.
Upgrading from 50% to higher F fractions for both F×B and F×H crosses showed no significant differences for milk yields (Table 2). This outcome was different from Koonawootrittriron et al. (2012), who found that the LSM for milk yield tended to increase as Holstein fraction increased from less than 0.625 (4,075±109 kg) to 0.875 (4,285±47 kg) and then it decreased towards purebred Holstein (4,120±76 kg). This difference may be attributed to limitations in the provision of the necessary management that high percentage F cows require, and differences in adaptation to the tropical environment and feed availability. In addition, the preferential treatment given to improved breed groups relative to low milk yield indigenous cows may also have contributed to the higher performance observed in crossbred cows than that of B and H cows. The milk yield and lactation length for B and H cows reported in this study were higher than values reported for the same breeds by Demeke et al. (2004). This could be due to inclusion of cows with lactation lengths above 90 d in the present study compared to the 60 d considered in the previous study (Demeke et al., 2004). Among the three exotic sire breeds (F, J, and S), the F were superior followed by S and J for the considered traits.
First parity cows had longer DP (39.6±1.1 d) and LL (322.6±4.2 d) compared to the second and later (≥3) parity cows (p<0.001; Table 3) while LSM for LY, IY, PY, and YD were lower for the first parity cows followed by cows in the second parity compared to cows in later parity (≥3). Other authors have observed increased daily milk yields with parity number (Epaphras et al., 2004). The difference among parities could be associated with the maturity of the cows, high feed intake of mature cows than heifers, differences in partitioning of more feed to maintenance and growth at the expense of milk production in heifers than mature cows and early culling of cow with lower milk yield (Gradiz et al., 2009). Longer DP and LL observed in first parity cows compared to later parities could be associated to the better persistency of first lactation cows (Stanton et al., 1992).
Covariance component and genetic parameter estimates
Variance component estimates (Table 4) from single-trait analysis for LY, IY, PY, YD, DP, LL, ln(a), and c produced low heritability (0.03±0.03 to 0.08±0.02) estimates for LL, DP, and parameter c of MIG. Heritability estimates for LY, IY, PY, YD, LL, and ln(a) were medium (0.21±0.03 to 0.33±0.04). Repeatability estimates ranged from 0.21±0.02 to 0.53±0.01 for LY, IY, PY, YD, LL, ln(a), and c, and 0.14±0.01 for DP (Table 4).
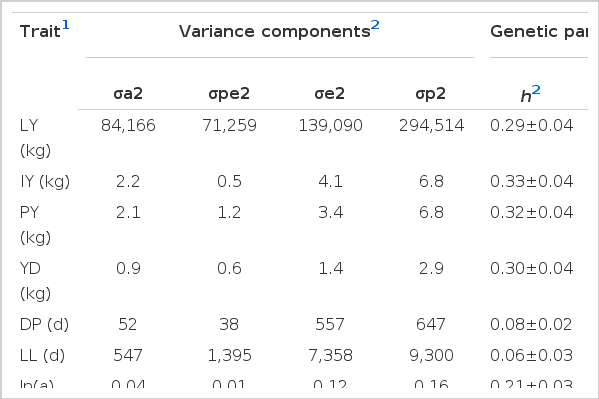
Variance component and genetic parameter estimates for lactation pattern and milk production traits and lactation curve parameters
The heritability estimate for LY found here was comparable to values reported by Albuquerque et al. (1996) and Mashhadi et al. (2008) for Holstein cows, but higher than estimates (0.24±0.04) from Demeke et al. (2004) for B and F×B crosses, Yilmaz et al. (2011) for Brown Swiss cattle (0.25) and Ayied et al. (2011) for Holstein cattle (range 0.05 to 0.21). However, it was lower than values obtained in a Thai multibreed dairy population (0.43±0.24; Seangjun et al., 2009) and in a Dutch Black and White dairy cattle population (0.48; Hoekstra et al., 1994). Further, the heritabilities estimated in this study were higher for IY and PY, but lower for LL and DP than the values reported for a multibreed Thai dairy population (0.23±0.18 for IY; 0.20± 0.18 for PY and 0.52±0.28 for DP; Seangjun et al., 2009). Heritability estimates are specific to a particular population (Van Der Werf and De Boer, 1989). Heritability estimates vary with lactation (Albuquerque et al., 1996; Cilek and Sahin, 2009). Cilek and Sahin (2009) attributed the lower heritability for all lactation milk yields than the heritabilities of first and second lactations to culling and selection that may have reduced the phenotypic variance of older cows compared to first-lactation cows. Hoekstra et al. (1994), for instance, attributed the high heritability estimate in their study to the high milk production. Ayied et al. (2011) compared heritability estimates for milk yield and lactation length using four methods of estimation (MINQUE, ANOVA, ML, and REML) and reported heritability estimates ranging from 0.07 (REML) to 0.21 (MINQUE) for milk yield and 0.02 to 0.09 for lactation length. Espinoza et al. (2007) compared heritability estimated for the first, second, third and fourth parities lactation milk yield using univariate analysis with animal repeatability model and reported lower heritability values (ranged 0.10 to 0.15) from the univariate analysis than from the animal repeatability model (0.16).
The heritability estimate for YD (0.33±0.04, Table 4) was comparable to the heritability estimate of 0.28 reported by Lopez-Villalobos and Spelman (2010). Atili and Khattab (2005) reported lower heritability estimates for lactation milk yield and lactation length for Holstein Friesian cows using animal repeatability model compared to heritability estimated from sire model. In general, moderate heritability estimates indicate sufficient additive genetic variance that would allow selection within the population. Thus, considering heritability estimates, LY, IY, PY, YD, and ln(a) could be improved through selection of either one or a combination of these traits in this dairy cattle population. The low heritability and repeatability estimates for LL, DP, and c indicate that these traits were largely affected by environmental factors, perhaps largely related to the management and feeding of the animals. The medium repeatability obtained for LY, IY, PY, and YD (0.39 to 0.53) in this study suggested that information from the first parity could be used for early prediction of EBV and cow selection. These early EBV would later be updated as data from later lactations became available.
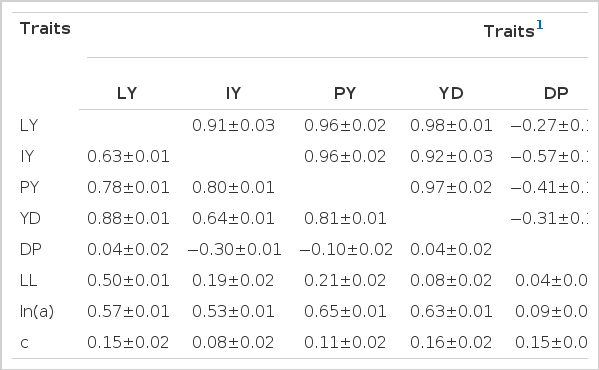
The genetic correlations between LY, IY, PY, YD, LL, and ln(a) were high (range 0.59±0.15 to 0.99±0.03) and positive (Table 5). Conversely, the genetic correlations coefficients between DP and LY (−0.27±0.15), IY (−0.57± 0.12), PY (−0.41±0.15), YD (−0.31±0.16), ln(a)(−0.42±0.16) were negative. Cows with higher IY and PY tended to reach their peak yield earlier than cows with lower IY and PY. The high and positive genetic correlations obtained here between LY, IY, PY, YD, ln(a), and LL indicated that cows with high genetic potential for milk production traits (LY, IY, PY, YD, and ln(a)) tended to show longer LL. Thus, selection for longer LL would tend to improve lactation milk yield in this Ethiopian population. To improve LY in this Ethiopian population, selection should consider sires and dams with higher IY, PY, and YD and longer LL. Similar correlations were also reported in different studies (Batra et al., 1987; Varona et al., 1998; Tekerli et al., 2000; Gradiz et al., 2009). Cows producing at higher levels in the beginning of lactation tended to have the highest peak yield and consequently the highest 305-d yield (Ali and Schaeffer, 1987; Tekerli et al., 2000).
Estimated breeding values and genetic trends
Estimates for general heterosis were 489±44.9 kg for LY, 2.6±0.2 kg for IY, 3.0±0.2 kg for PY, 1.7±0.1 kg for YD, −4.7±1.7 d for DP, 50.9±6.8 d for LL, 0.33±0.03 kg for ln(a), and 0.002±0.0003 kg/d for c. Table 6 show estimates of breed differences between H, F, J, and S relative to Boran. These values were used to estimate breeding values. The estimates of breed effects for F, S, and J relative to B were large and influenced the ranking of sires across breed groups for all traits. Differences between F, S, and J breeds and B were positive for all traits, except for DP that were negative. Sire EBV ranged from −392.5 to 1,962 kg for LY, −2.9 to 10.9 kg for IY, −2.5 to 10.6 kg for PY, −1.8 to 7.4 kg for YD, −26.3 to 139.4 d for LL, −28.7 to 10.1 d for DP, −0.495 to 1.301 kg for ln(a), and −0.002 to 0.01 kg/d for c, respectively (Table 7). Comparison of EBV across sire breed groups showed that the highest EBV were observed for straightbred exotic sires (Friesian, Jersey and Simmental) for LY, IY, PY, YD, LL, and ln(a). Spearman’s rank correlations between sire EBV were significant for all pairs of traits (p<0.001) except for the correlation between DP and parameter c (Table 8). The rank correlation for pairs of traits involving LY, LL, IY, PY, YD, ln(a), and c, were positive and significant which indicated that sires with higher EBV for LY would likely also have higher EBV for the other positively correlated traits. Conversely, the rank correlation between DP with LY, IY, PY, and YD was negative which could be explained by the low negative genetic correlation (range −0.27±0.15 to −0.57±0.12) observed in this study (Table 5).
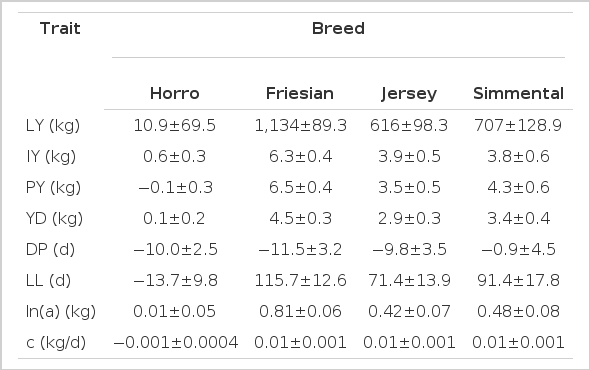
Estimates (±standard errors) for breed differences from Boran for lactation pattern and milk production traits
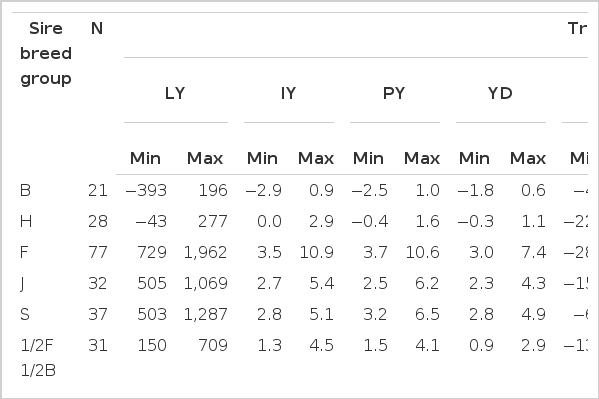
Number of sires (N) and ranges (minimum and maximum) of estimated breeding values of sires for lactation pattern and milk production traits across different sire breed groups

Spearman’s Rank Correlation coefficients of sires estimated breeding values for lactation pattern and milk production traits and lactation curve function parameters
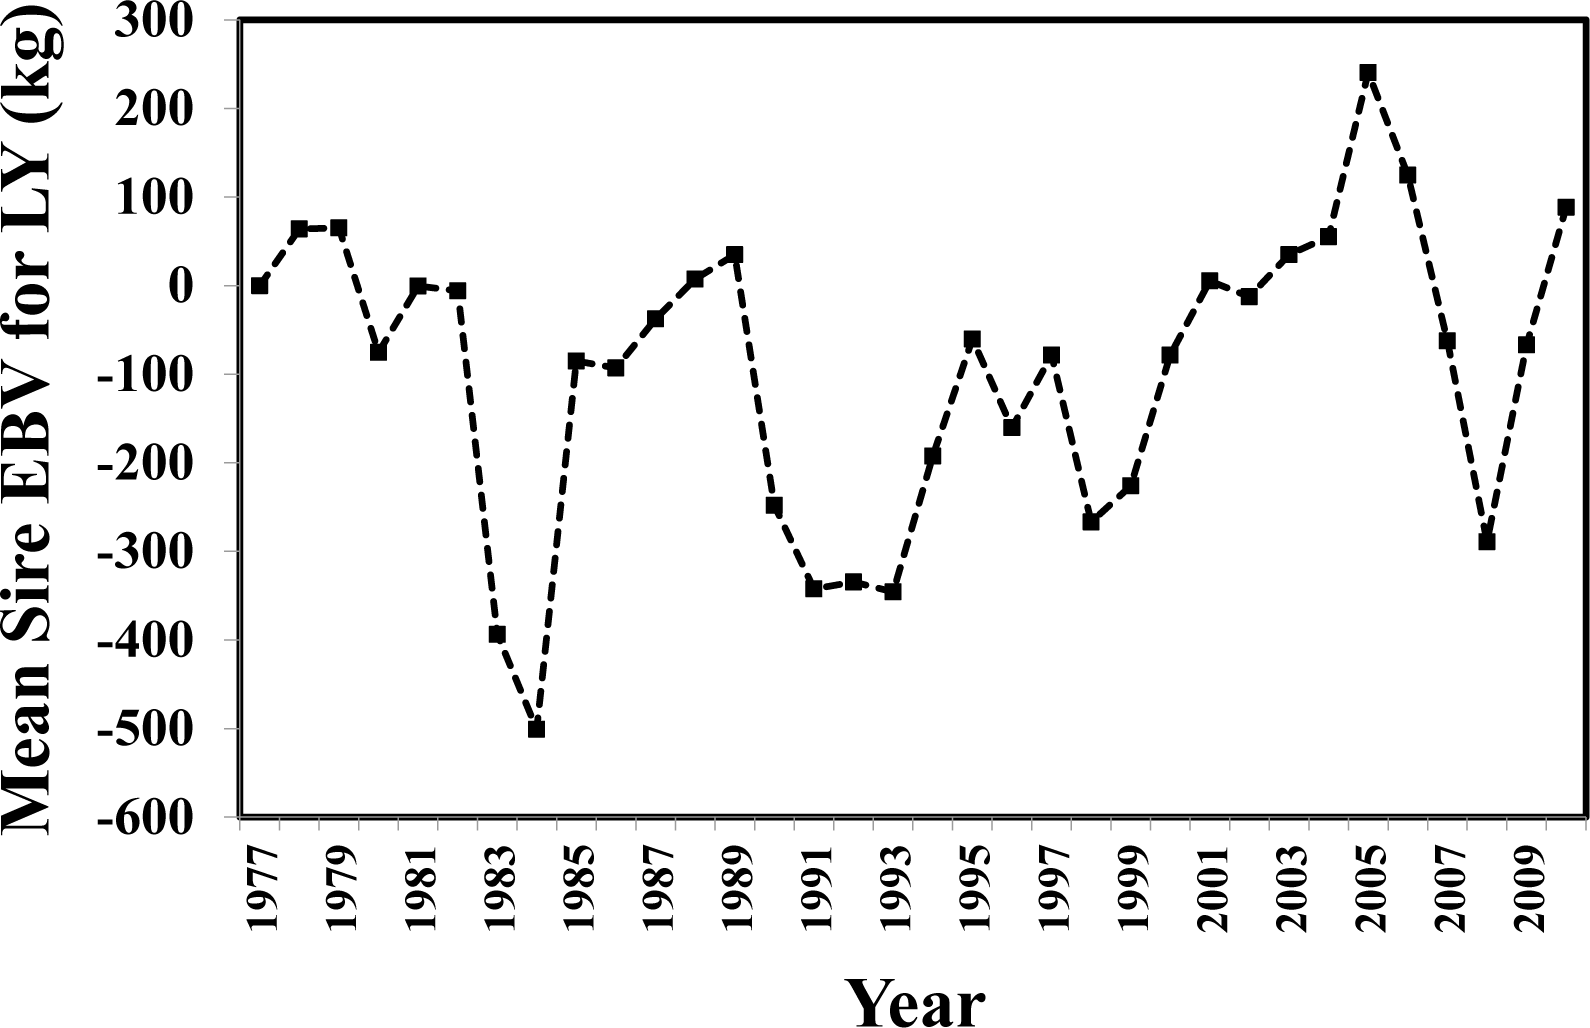
The only trait with a significant regression of EBV on calving year was LL. The EBV for LL declined across calving years (b = −0.91; p = 0.02). In contrast, the EBV for LY (corrected for LL) across years was highly variable (Figure 1) perhaps preventing the upward trend of EBV yearly means becoming significant. The high degree of variation of EBV for LY across years may have been influenced by genetic variability among sires used across years and by management variability across years within and across the three locations involved in this study.
IMPLICATIONS
Crossbreeding and upgrading could help increase milk production in this Ethiopian dairy population. The high additive genetic variance, heritability and repeatability estimates obtained here suggested the possibility of improving LY, IY, PY, and YD by genetic selection. High genetic and phenotypic correlation estimates among the traits (LY, IY, PY, and YD) also suggested that genetic improvement in one of these traits would result in improvement of other genetic correlated traits. The medium to high repeatability estimates suggested that first lactations could be used for early prediction of animal genetic abilities in this population. These early predictions will later be updated as information from later lactations becomes available.
Acknowledgements
The authors would like to acknowledge the Rural Capacity Building Project of the Ethiopian Ministry of Agriculture and Rural Development for the financial support and the Tigray Agricultural Research Institute for the study leave offered to the first author. The study is based on data collected in the Holetta Research Center of the Ethiopian Institute of Agriculture Research, Bako research center of the Oromia Agricultural Research Institute and Debre Zeit research station of the International Livestock Research Institute (ILRI). The authors are grateful to all institutions.


