A SNP Harvester Analysis to Better Detect SNPs of CCDC158 Gene That Are Associated with Carcass Quality Traits in Hanwoo
Article information
Abstract
The purpose of this study was to investigate interaction effects of genes using a Harvester method. A sample of Korean cattle, Hanwoo (n = 476) was chosen from the National Livestock Research Institute of Korea that were sired by 50 Korean proven bulls. The steers were born between the spring of 1998 and the autumn of 2002 and reared under a progeny-testing program at the Daekwanryeong and Namwon branches of NLRI. The steers were slaughtered at approximately 24 months of age and carcass quality traits were measured. A SNP Harvester method was applied with a support vector machine (SVM) to detect significant SNPs in the CCDC158 gene and interaction effects between the SNPs that were associated with average daily gains, cold carcass weight, longissimus dorsi muscle area, and marbling scores. The statistical significance of the major SNP combinations was evaluated with x2-statistics. The genotype combinations of three SNPs, g.34425+102 A>T(AA), g.4102636T>G(GT), and g.11614+19G>T(GG) had a greater effect than the rest of SNP combinations, e.g. 0.82 vs. 0.75 kg, 343 vs. 314 kg, 80.4 vs 74.7 cm2, and 7.35 vs. 5.01, for the four respective traits (p<0.001). Also, the estimates were greater compared with single SNPs analyzed (the greatest estimates were 0.76 kg, 320 kg, 75.5 cm2, and 5.31, respectively). This result suggests that the SNP Harvester method is a good option when multiple SNPs and interaction effects are tested. The significant SNPs could be applied to improve meat quality of Hanwoo via marker-assisted selection.
INTRODUCTION
Detection of genes or single nucleotide polymorphism (SNP) for economically important traits has been extensively performed in farm animals, and so far 5,920 quantitative trait loci (QTL) in cattle were reported from 315 publications (www.animalgenome.org). Most important traits in farm animals are multi-factorial, i.e. influenced by interaction of multiple genes and environmental factors. Recently, an advanced SNP genotyping technology such as high throughput SNP chips are available, e.g. the bovine Illumina 770k or Affymetrix 640k SNP arrays. To evaluate whether any SNP is associated with a trait of interest, a large amount of SNPs need to be considered simultaneously, e.g. by fitting the SNPs into the conventional Animal model, which may yield over-parameterization problems.
To handle high-order dimensional data, a multifactor dimensionality reduction method was proposed to efficiently detect multiple genes and interactions effects between the genes (Ritchie et al., 2001; Cho et al., 2004; Su et al., 2012). The method was designed to address high-dimensional data and to uncover complex relationships without relying on the models that fit multiple gene interactions in a parametric fashion (Bastone et al., 2004). Yang et al. (2009) developed a new genetic interaction approach, a SNPHarvester method, to reveal gene interactions and interaction-interaction relationships between a large pool of genes. However, the method was applied only to binary data in a case-control study.
Previously, association studies between CCDC158 gene and growth and carcass traits in Korean cattle, Hanwoo, were performed under linear models, in which a single SNP or haplotype (additive) effects were fitted (Lee et al., 2008; Lee and Lee, 2009; Lee et al., 2010). In this study, a SNPHarvester method with a support vector machine was applied to detect significant SNPs in the CCDC158 gene and interaction effects between the SNPs that were associated with growth and carcass quality traits in Hanwoo.
MATERIAL AND METHODS
Animals and phenotypes
A sample of Hanwoo steers (n = 476) was chosen from the National Livestock Research Institute (NLRI) of Korea. The steers that were sired by 50 Korean proven bulls were born between the spring of 1998 and the autumn of 2002 and reared under a progeny-testing program. All steers were fed under a tightly controlled feeding program at the Daekwanryeong and Namwon branches of NLRI. The steers were castrated at six months of age and each set of four individuals were raised in a pen (4 m×8 m). After six months of age, they were fed with concentrates consisting of 15% crude protein (CP)/71% totally digestible nutrients (TDN) for a period of 60 to 90 d; 15% CP/71% TDN for a period of 180 days; and 13% CP/72% TDN for a period of 90 to 120 days of self-feeding. Roughage was offered ad libitum, and steers had free access to fresh water throughout the entire period. After two years, the steers were slaughtered. Average daily gain (ADG) was measured between 6 and 24 months of age. After slaughter, the carcass was chilled for 24 h and cold carcass weight (CWT) was measured. Also, longissimus dorsi muscle area (LMA) and marbling score (MS) were measured according to the standards of the Korean Animal Product Grading Service. The means and standard deviations of ADG, CWT, LMA, and MS were 0.752±0.089 kg, 316.8±34.5 kg, 75.3±8.1 cm2, and 5.61±4.18, respectively.
SNP genotyping
Genomic DNA was extracted from white blood cells using the phenol-chloroform method (Sambrook and Russell, 2001). A total of 19 polymorphic SNPs of the coiled-coil domain containing 158 (CCDC158: Gene ID 534614) were obtained according to Lee et al. (2010). For the SNP genotyping, primers for the amplification and extension were designed for the single-base extension (Vreeland et al., 2002). Primer extension reactions were conducted using the SNaPshot ddNTP Primer Extension Kit (Applied Biosystems, Foster City, CA, USA). For the cleanup of the primer extension reaction, one unit of SAP (shrimp alkaline phosphatase) was added to the reaction mixture, and this mixture was incubated for 1 h at 37°C, followed by 15 min at 72°C for enzyme inactivation. DNA samples containing extension products and the Genescan 120 LIZ size standard solution were added to HiDi formamide (Applied Biosystems, Foster City, CA, USA) in accordance with the manufacturer’s recommendations. The mixture was incubated for 5 min at 95°C, followed by 5 min on ice, after which electrophoresis was conducted using the ABI PRISM 3130XL Genetic Analyzer. The results were analyzed using GeneMapper v4.0 (Applied Bio-systems, Foster City, CA, USA).
SNP Harvester method with a support vector machine
A support vector machine (SVM), a statistical algorithm, has an advantage of solving the problem of nonlinear regression by restructuring high-dimensional spatial data into linear regression functions (Vapnik, 1998). A Soft-margin technique adopting slack variables was applied (Figure 1), which allowed for hyper-plane with minimal misclassification and soft margins (Tan et al., 2006). In the SVM model, a Kernel function of the RBF (radial basis function) was used, for which RBF Gamma 0.1 was set as a default parameter from Modeler 14 (IBM-SPSS, ex-Clementine) and ten was set as a regularization parameter.

Soft-margin technique with slack variables. (*) ξi: slack variable, w, b: parameters.
In the SNP Harvester method that enables to sort out major genotype combinations between genes, several SNPs were selected among a number of SNPs by grouping and exchanging SNPs within a group (Yang et al., 2009). The process was repeated to increase test statistics values. The x2 statistic, classification accuracy, and B-statistic values were used as score functions. The x2 statistic value was determined with degree of freedom 3k-1, in which k indicates number of SNP groups, e.g. two or three in this study. To identify statistically significant groups, α was set at 0.001 level. The SNPHarvester procedure is summarized as follows (Figure 2):
Step 1. Randomly select k number of groups in the entire SNP groups and assign group name, e.g. group A. Set the rest of SNPs as SNPi.
Step 2. Exchange SNPi that do not belong to group A with group A elements on a one-by-one basis to calculate scores.
Step 3. Set the greatest value from Step 2 as A*.
Step 4. If A* has a greater score than A, then replace A with A*.
Step 5. If the score of the A* is greater than a threshold value, then A* is classified as a significant group.
Step 6. For SNPi+1 that do not belong to group A, repeat Steps 2–5.
Step 7. If A* is not replaced with any other SNPi+1, then stop the process and A* is determined as the final SNP combination set.
SNP Harvester procedure with a support vector machine.
By repeating the above steps, SNP combinations influencing the test traits were selected. Because the SNPHarvester method was designed to analyze interaction effects for binary traits, the measures of the four traits in this study were converted into binary values under a multi-trait model. The SVM technique was employed by taking the four continuous variables as input variables and the binary value as a dependent variable, and two- or three-way interaction models were applied to determine ten significant SNP combinations.
RESULTS
Table 1 shows the most significant SNP combinations that were related to the four economic traits in Hanwoo. Among the two or three SNP combinations, the set of g.34425+102A>T, g.4102+36T>G, and g.11614+19G>T SNPs yielded the lowest p-value. However, the subsets of the genotypes for the three SNP combinations could not be identified using the SNP Harvester method. Instead, the genotype within the g.34425+102A>T, g.4102+36T>G, and g.11614+19G>T combination was investigated in detail by using the CART algorithm (Table 2). Table 2 shows the best SNP combinations for the four economic traits between superior genotypes and others (not presented here). The AAGTGG genotype combination for the three respective SNPs had the best performance, i.e. the greatest t-values and the lowest p-values (<0.001) for the four economic traits. Mean and standard deviations for the AAGTGG genotype group were 0.82±0.09 kg for ADG, 342.6±23.6 kg for CWT, 80.4±5.9 cm2 for LMA, and 7.35±4.75 for MS, respectively. These estimates were significantly greater than for the rest of the genotype groups, i.e. 0.75±0.09 kg, 314.2±34.0 kg, 74.7±7.8 cm2, and 5.01±3.97 for ADG, CWT, LMA, and MS, respectively (Table 2).
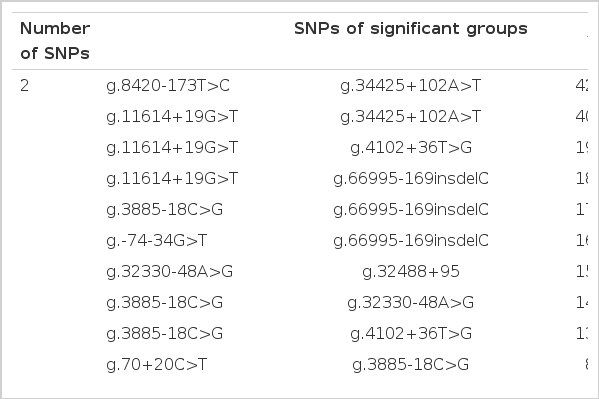
The most significant sets of SNP combinations among the 19 SNPs of CCDC158 by the SNP Harvester analysis for the four economic traits in Hanwoo
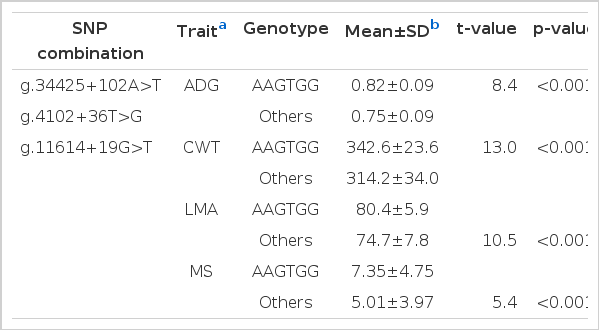
t-test statistics of the four economic traits between the best genotype and other genotypes of the most significant SNP combination
For the genotypes of the three SNPs that had the best combination with the greatest performance for the economic traits, i.e. AA, GG, and GT for g.34425+102A>T, g.11614+19G>T, and g.4102+36T>G, respectively, least-squares means were obtained for the genotype and the rest of genotypes when each SNP was analyzed for each trait (Table 3). The results show that when the three SNPs were combined, the estimates were greater than when each SNP was considered (Tables 2 and Table 3). For example, the individuals with AAGTGG combination had an average value of 0.82 kg for ADG, while those with GG genotype for g.11614+19G>T had 0.76 kg, which was the greatest value when single SNPs were analyzed. Also, for CWT, LMA and MS, the estimates of the genotype combination of the three SNPs were 342.6 kg, 80.4 cm2 and 7.35, while the greatest estimates from single SNP analyses were 319.9 kg, 75.5 cm2 and 5.31, respectively (Tables 2 and 3).
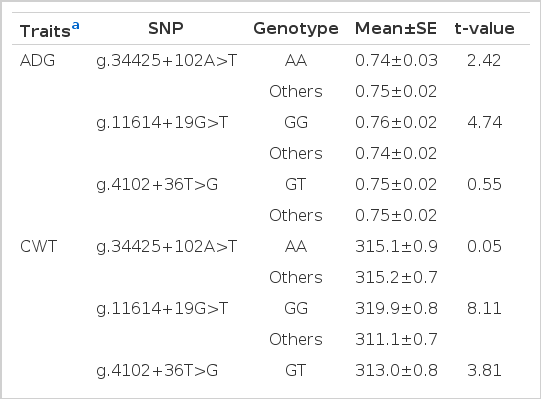
Least squares means and standard errors between the best genotype and other genotypes for each of the three SNPs, with which the most significant SNP combination was obtained by the SNPHarvester analysis for the four economic traits in Hanwoo
DISCUSSION
In this study, the bootstrap sampling method (Efron and Tibshirani, 1993) was used to generate 3,830 samples that were based on the 476 steers in Lee et al. (2010), and the top ten SNP combinations of two- and three-way SNP interaction for four economic traits of Hanwoo were selected using the SNPHarvester with SVM method (Table 1). Although multifactor dimensionality reduction (MDR) to detect gene-gene interactions worked well when the number of genes were moderate, in genome-wide association (GWA) studies, direct application of thousands of SNPs is computationally limited (Yang et al., 2009). Further, MDR is computationally intensive, especially when more than 10 polymorphisms are evaluated (Ritchie et al., 2001).
Lee et al. (2010) reported that the single SNPs of g.34425+102 A>T(AA), g.11614+19G>T(GG), and g.4102+36T>G(GT) within CCDC158 gene were associated with body weight and cold carcass weight in Hanwoo. However, they did not report interaction effects between the SNPs. In this study, by applying the SNPHarvester method, the three SNP combinations, i.e. g.34425+102 A>T(AA), g.11614+19G>T(GG), and g.4102+36TM>G(GT), had the greatest test statistics, x2 value as 560 (Table 1). Also, the estimates of the best genotype combinations for the three SNPs were much greater than the estimates from single SNP analyses, and the differences between the single and combination effects of the three SNPs were 0.06 kg, 22.7 kg, 4.9 cm2 and 2.04 for ADG, CWT, LMA and MS, respectively (Table 2 and Table 3). This result suggests that interaction effects need to be taken into account when multiple SNPs are tested simultaneously to detect significant SNPs for economically important traits in Hanwoo.
In conclusion, the application of SNPHarvester with SVM method could be a good option for multiple SNP analyses, especially to characterize interaction effects between SNPs, and the significant SNPs may be applied via marker-assisted selection to the Hanwoo industry for genetic improvement of the economically important traits.
Acknowledgements
Jea-Young Lee’s work was supported by the Yeungnam University Research Grant 2010.