Chemical composition of barley and co-products from barley, corn, and wheat produced in South-East Asia or Australia

Article information

Anim Biosci. 2024;37(1):105-115
Publication date (electronic) : 2023 August 24
doi : https://doi.org/10.5713/ab.23.0201
1Department of Animal Sciences, University of Illinois, Urbana IL 61801, USA
2DSM Nutritional Products, Mapletree Business City 117440, Singapore
*Corresponding Author: Hans H. Stein, Tel: +1-217-333-0013, Fax: +1-217-333-7088, E-mail: hstein@illinois.edu
aThese authors contributed equally to this work.
Received 2023 May 25; Revised 2023 June 9; Accepted 2023 July 21.

Abstract

Objective

A study was conducted to determine the chemical composition of barley and co-products from barley, corn, and wheat produced in South-East Asia or Australia, and to test the hypothesis that production area or production methods can impact the chemical composition of wheat co-products.

Methods

Samples included seven barley grains, two malt barley rootlets, one corn gluten feed, one corn gluten meal, one corn bran, eight wheat brans, one wheat mill mix, and four wheat pollards. All samples were analyzed for dry matter, gross energy, nitrogen, amino acids (AA), acid hydrolyzed ether extract, ash, minerals, starch, and insoluble dietary fiber and soluble dietary fiber. Malt barley rootlets and wheat co-products were also analyzed for sugars.

Results

Chemical composition of barley, malt barley rootlets, and corn co-products were in general similar across countries. Wheat pollard had greater (p<0.05) concentrations of tryptophan, magnesium, and potassium compared with wheat bran, whereas wheat bran had greater (p<0.05) concentration of copper than wheat pollard. There were no differences in chemical composition between wheat bran produced in Australia and wheat bran produced in Thailand.

Conclusion

Intact barley contains more starch, but fewer AA, than grain co-products. There were only few differences in the composition of wheat bran and wheat pollard, indicating that the two ingredients are similar, but with different names. However, corn gluten meal contains more protein and less fiber than corn bran.

INTRODUCTION

Demand for feed grain for livestock has increased in Australia and animal feed accounts for the consumption of two-thirds of all domestic Australian crop production [1]. Feeding is also one of the most challenging aspects of livestock farming in Asia, which is dependent on the availability of feed ingredients [2]. Animal production in this region is primarily focused on crop-animal systems, which provides a variety of grain co-products that can be used as feed ingredients in animal diets [2]. Processing of grain and grain co-products involves harvesting, cleaning, milling or grinding, and separating the different components to obtain desired end products such as flour, bran, and germ, but the left-over co-products are often used as feed for livestock [2].

Barley is a major cereal grain mostly produced in the European Union, Russia, Canada, and Australia [3]. It is used in animal diets and for human consumption, as well as for distilling and brewing. Nutrient composition of barley depends on factors including variety, environment, and yield [4]. Malt barley rootlets, a co-product obtained at the final stage of the barley malting process, consist of the dried shoots and rootlets of the sprouted grain [5], and can provide protein in diets for livestock. Co-products from the corn milling industry such as corn bran, corn gluten meal, and corn gluten feed are also available [6]. Corn bran is the pericarp-enriched fraction derived from the dry- or wet-milling industry, whereas corn gluten feed and corn gluten meal are co-products from the wet-milling industry [6]. Corn gluten feed is the remaining part of the corn grain after extraction of most of the starch, gluten, and germ, whereas corn gluten meal is the dried residue that is left after manufacture of starch and germ [7].

Wheat is also an important agricultural crop in some Australian and South-East Asian regions [8]. Wheat co-products from dry milling of wheat include wheat bran, which is the primary pericarp layer of wheat grain [8], and wheat pollard (hard or soft) known as fine bran [9]. Mill mix, also known as mill run, is another wheat co-product from the flour milling process that is a combination of bran and shorts fractions [10].

Despite the importance of grain and grain co-products in the nutrition of livestock and poultry, there is limited information about the chemical composition of grain and grain co-products produced in South-East Asia and Australia. In addition, most studies regarding chemical composition have focused only on a few ingredients from specific locations. Likewise, in the analysis of feed ingredients, components usually do not add up to 100% because not all nutrients are analyzed. Therefore, determining the complete chemical composition of feed ingredients from South-East Asia or Australia is important for livestock nutrition because this will aid in formulation of balanced diets that meet the nutritional needs of the animals. Therefore, the objectives of this study were to determine the chemical composition of barley and co-products from barley, corn, and wheat from South-East Asia or Australia, and to test the hypothesis that there are differences among grain co-products produced in different countries.

MATERIALS AND METHODS

Description of samples

Barley and co-products from barley, corn, and wheat (between 100 and 300 grams of each ingredient) were collected from suppliers in South-East Asia or Australia and delivered to DSM Nutritional Products, Singapore. Samples were labelled and then shipped to the University of Illinois, Urbana, IL, USA, where most of the chemical analyses were conducted. Samples included seven sources of barley from Australia and Indonesia, two sources of malt barley rootlets from Australia and Indonesia, one sample of corn gluten feed from Indonesia, one sample of corn gluten meal and a sample of corn bran from the Philippines, eight sources of wheat bran from Australia, Indonesia, the Philippines, Thailand, and Vietnam, one sample of wheat mill mix from Australia, and four sources of wheat pollards from the Philippines.

Chemical analysis

Samples of all ingredients were finely ground and analyzed for dry matter (Method 930.15) and ash (Method 942.05) [11]. Gross energy was analyzed using an isoperibol bomb calorimeter (Model 6400, Parr Instruments, Moline, IL, USA). Samples were analyzed for amino acids (AA) [Method 982.30 E (a, b, c)] [11] on a Hitachi AA Analyzer (Model L8800; Hitachi High Technologies America Inc., Pleasanton, CA, USA) and nitrogen was analyzed by combustion (Method 990.03) [11] using a LECO FP628 Nitrogen Analyzer (LECO Corp., Saint Joseph, MI, USA). Methionine and Cystein were determined as methionine sulfone and cysteic acid after cold performic acid oxidation overnight before hydrolysis [11]. Crude protein was calculated as nitrogen×6.25. The acid hydrolyzed ether extract (AEE) was analyzed using 3N HCl (AnkomHCl; Ankom Technology, Macedon, NY, USA) followed by crude fat extraction using petroleum ether (AnkomXT15; Ankom Technology, USA). Insoluble dietary fiber and soluble dietary fiber were quantified according to method 991.43 [11] using the AnkomTDF Dietary Fiber Analyzer (Ankom Technology, USA). Total dietary fiber was calculated as the sum of insoluble and soluble dietary fiber. Minerals were analyzed (Method 985.01 a, b, and c) [11] using inductively coupled plasma-optical emission spectrometry (ICP-OES; Avio 200, PerkinElmer, Waltham, MA, USA). Sample preparation included dry ashing at 600°C for 4 h (Method 942.05; 10) [11] and wet digestion with nitric acids (Method 3050 B) [12]. Total starch was analyzed using the glucoamylase procedure (Method 979.10) [11]. Sugars including glucose, fructose, maltose, sucrose, stachyose, and raffinose were analyzed in malt barley rootlets and wheat co-products using high-performance liquid chromatography (Dionex App Notes 21 and 92).

Calculations and statistical analysis

For each feed ingredient, analyzed proximate components were added and subtracted from the concentration of dry matter to calculate the rest fraction according to the following equations:

Rest fractionbarley and corn co-products=[Dry matter-(crude protein+AEE+ash+total dietary fiber+total starch)].
Rest fractionmalt barley rootlets and wheat co-products=[Dry matter-(crude protein+AEE+ash+total dietary fiber+total starch+glucose+fructose+maltose+sucrose+stachyose+raffinose)].

The rest fraction of malt barley rootlets and wheat coproducts differs from rest fraction of barley and corn co-products because these ingredients do not contain a considerable amount of free sugars. To allow for statistical comparison, all samples were adjusted to 90% dry matter because this is a typical value for grains and allows for a direct comparison without the influence of moisture. If two or more samples of the same ingredient from one country were available, the coefficient of variation and the average were calculated.

Normality of residuals was verified using the UNIVARIATE procedure (SAS 9.4 Institute Inc., Cary, NC, USA). Data were analyzed by analysis of variance using the F-test in the PROC MIXED procedure in SAS to test differences among wheat co-products and differences in composition of wheat co-products from different countries. The replicate sample was the experimental unit for all analyses. The feed ingredient or country was the fixed effect, and the replicate sample was the random effect. Means were calculated using the LSMEANS statement in SAS. Results were considered significant at p<0.05.

RESULTS

The nutrient composition of barley grain from Australia and Indonesia was not different, with the exception that the barley grain from Australia had a greater concentration of total starch and a lower concentration of total dietary fiber than the barley grain from Indonesia (Table 1). The coefficient of variation for the analyzed components of barley grain from Australia was low, except for ash and most minerals, accounting for less than 30%. The average rest fraction for the barley grain samples was less than 2%.

Analyzed nutrient composition of barley grain, as-fed basis1)

The main nutrients in malt barley rootlet samples were crude protein (25% to 26%) and total dietary fiber (36% to 38%), the majority of which was insoluble dietary fiber (Table 2). Starch, AEE, sugars, and minerals were also present, but at lower concentrations (1% to 10%). The average rest fraction in these samples was very low, accounting for less than 1%.

Analyzed nutrient composition of malt barley rootlets, as-fed basis1)

The main nutrients in corn gluten feed were crude protein and insoluble dietary fiber (Table 3). The most abundant nutrient in corn gluten meal was also crude protein, but total dietary fiber in corn gluten meal was low, whereas the main nutrients in corn bran were insoluble dietary fiber and starch. Minerals and AEE were also present in all corn co-products, but at lower concentrations than other nutrients. All corn co-products had a rest fraction that was close to or less than 3%.

Analyzed nutrient composition of corn co-products, as-fed basis1)

The coefficient of variation for the analyzed wheat bran from Australia was low, accounting for less than 30%, with the exception of starch, soluble dietary fiber, and all sugars, which varied more among samples (Table 4). However, wheat bran from Thailand had on average a coefficient of variation (of around 40%) for most nutrients. The coefficient of variation among wheat pollard samples from the Philippines was low, except for starch, soluble dietary fiber, and some sugars and minerals, accounting for less than 30% (Table 5). The average rest fraction in wheat bran and wheat pollard was very low, accounting for less than 0.5%, regardless of origin.

Analyzed nutrient composition of wheat bran, as-fed basis1)

Analyzed nutrient composition of wheat mill mix and wheat pollard, as-fed basis1)

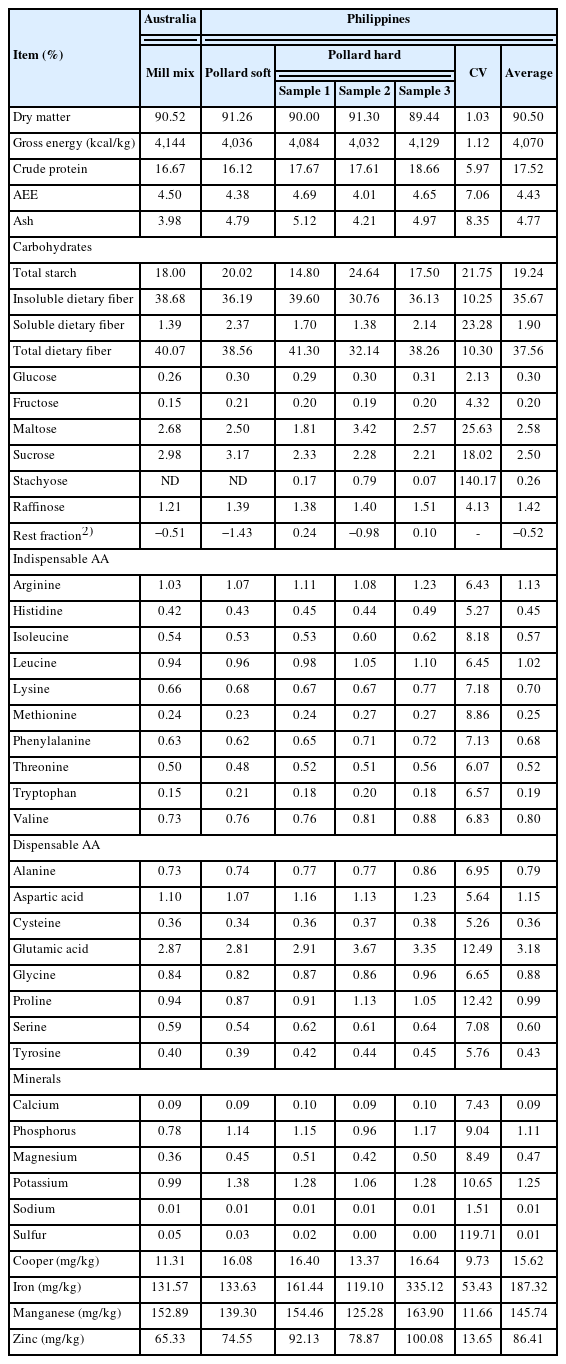
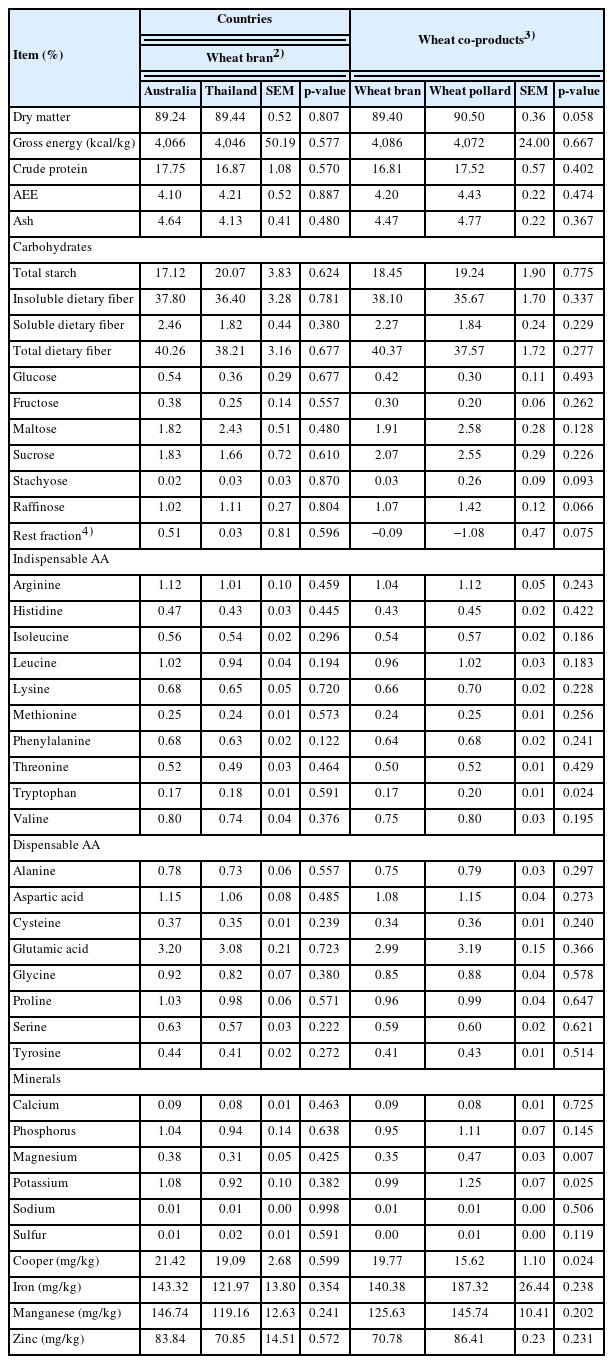
No differences were observed between wheat bran samples from Australia and Thailand (Table 6). Wheat pollard had greater (p<0.05) concentrations of tryptophan, magnesium, and potassium when compared with wheat bran, but wheat bran had greater (p<0.05) concentration of copper than wheat pollard.

Comparison among countries and ingredients for wheat co-products, as-fed basis1)

DISCUSSION

The chemical composition of barley and malt barley rootlets was within the range of published values [3,4,1317]. However, the total dietary fiber in barley used in this study was greater than that reported by McGhee and Stein [13] and NRC [14]. The concentration of starch is usually greater in barley grown in temperate climates than in subtropical or tropical climates, whereas the opposite is the case for dietary fiber, which may be the reason for the greater fiber analyzed in the present samples [15].

The chemical composition of corn co-products was also within the range of published data [14,16,18,19], although corn gluten feed had lower total starch and greater total dietary fiber concentrations, and corn gluten meal had lower total starch and greater AEE than observed in some published studies. Likewise, the chemical composition of wheat co-products was within the range of published values [8,10,14, 16,2023], but the starch content of wheat co-products in this study was lower than reported by Rostagno et al [16]. The chemical components of all analyzed ingredients were close to 100%, indicating that most nutrients were accounted for because the sum of all analyzed nutrients were close to the dry matter content [24].

Barley and malt barley rootlets

Barley is a major grain that is used for human consumption, livestock feed, and brewing [4]. Australia is one of the world’s largest barley producers and the country is currently the largest exporter of barley. In 2022, the total barley export from Australia was 8.5 million metric tons [25]. Barley, is therefore, an important crop in Australia. Many factors influence the chemical composition of barley, including variety, yield, and environment. The observation that the barley grain from Indonesia had greater crude protein and total dietary fiber, but contained less starch than barley from Australia, indicates that barley from Indonesia had lower yields, which generally increases protein and fiber levels while decreasing starch content [4]. Barley has a high concentration of starch and protein is close to that in wheat and greater than corn, but because of the high fiber in barley, feeding barley to animals sometimes results in reduced dietary energy intake [26]. However, energy digestibility in pigs can be increased if particle size is reduced [27].

The malt barley rootlets, also known as malt culms, represent an important fraction of alternative ingredients for animal diets [5], and they are mostly used for ruminants. However, barley rootlets may also be used at low levels for finishing pigs, but low AA digestibility and poor palatability prevent greater inclusion [3]. The protein and total dietary fiber concentrations of malt barley rootlets used in this study averaged 25.9% and 37.5%, respectively. The high concentration of sugars in barley rootlets is due to the malting process that converts starch into soluble sugars [4].

Corn co-products

Corn demand has increased as a result of bioethanol production, as well as increased use in the food and animal feed industries [28]. Based on USDA-FAS [29], the Philippines is recognized as a significant harvesting region in South-East Asia, with a corn production of approximately 8.1 million metric tons in 2022. The corn bran used in this study had an oil content of 9.9%, which is within the typical range, with values ranging from 8% to 12% [14]. However, corn bran has lower digestible energy and AA compared with corn when fed to growing pigs because of greater dietary fiber [30].

The high protein and low total dietary fiber in corn gluten meal were in agreement with published data [19]. Protein digestibility is high in corn gluten meal [6,14], but protein quality is poor, with tryptophan and lysine being limiting AA. Corn gluten meal is mostly used as an alternative to other plant or animal-based proteins in diets for ruminants, but not often in diets for pigs and poultry due to the poor protein quality [18]. The corn gluten feed usually has a high concentration of total dietary fiber and protein can range between 17% and 24% depending on the milling process and relative proportions of bran, steep liquor, and other components included in the final product [7]. Corn gluten feed is an important ingredient in ruminant diets, but it has a lower nutritional value for monogastrics because of poor AA balance and low energy due to the high concentration of fiber [6,19].

Wheat co-products

Wheat milling generates co-products that are needed in the food industry, in animal feed, in bioethanol production, or in other industries [4]. Australia accounts for 13% of global wheat exports, but as a result of the current conflict between Ukraine and Russia, as well as port closures, wheat prices have increased, with importers reducing purchases and relying on existing stocks. This is currently the case in most South-East Asian countries where wheat is not a major crop [25]. Wheat composition is affected by variety, seasonal growing conditions, yield, fertilizer use, and sample cleanliness. Wheat bran and pollard are the two wheat co-products that are most used as livestock feed and can provide energy as well as some of the indispensable digestible AA in pig and poultry diets [21].

The observation that there were no differences in chemical composition between wheat bran from Australia and Thailand, indicates that the processing method used in the two countries is similar. Wheat bran is a fibrous co-product, containing the husk and some adhering endosperm [7], and it is generally palatable, has a moderate protein content, and its fiber content is excellent for digestive problems in monogastric animals including horses, but the high concentration of insoluble dietary fiber results in low energy digestibility [20,21,23] and reduced concentration of digestible energy for pigs [31].

Wheat pollard makes up the fraction of wheat that is not used in wheat flour production, and is the main co-product produced by flour milling. The composition of wheat pollard may depend on the type of flour produced and whether or not the germ is added. Wheat co-products are known by different names, including pollards, sharps, middlings, and shorts and its feeding value is determined by its fiber and starch contents [4]. Because wheat pollard is assumed to be less fibrous and with greater concentration of gluten than wheat bran, it was expected that the composition would be different. However, the observation that the wheat bran and wheat pollard that were analyzed in this study generally had the same nutrient composition indicates that the processing used to produce the two co-products was not different, or that suppliers are unaware of the differences and may mislabel them. Wheat co-products can be used for ruminant and pig diets, but high levels of inclusion can increase transit rate due to the high fiber content, resulting in decreased digestibility of nutrients [21].

CONCLUSION

The chemical composition of barley and co-products from barley, corn, and wheat produced in South-East Asia or Australia was typically consistent with reported values for similar co-products from other regions of the world. There were no differences between wheat bran produced in Australia and Thailand. There were only a few differences between wheat bran and wheat pollard, indicating that the processing used to produce these two ingredients was not different or that there may be a lack of knowledge of origin when labeling products for sale. As a result, it is critical that chemical analysis be performed when using alternative ingredients to meet expectations and ensure feeding quality.

Notes

CONFLICT OF INTEREST

We certify that there is no conflict of interest with any financial organization regarding the material discussed in the manuscript. Abelilla JJ is an employee of DSM Nutritional Products.

FUNDING

The authors received no financial support for this article.

References

1. United States Department of Agriculture Foreign Agricultural Service (USDA-FAS). Livestock and products annual Canberra, Australia: Global Agricultural Information Network (GAIN); 2018. Report No: AS1820.
2. Devendra C. Perspectives on animal production systems in Asia. Livest Sci 2007;106:1–18. https://doi.org/10.1016/j.livsci.2006.05.005 .
3. Heuzé V, Tran G, Nozière P, et al. Barley grain [Internet]. Feedipedia, a programme by INRAE, CIRAD, AFZ and FAO 2016. [cited 2022 Feb 18]. Available from: https://www.feedipedia.org/node/227 .
4. Premier Atlas, Premier Nutrition Products. Ingredients matrix Rugeley Staffs, UK: AB Agro Ltd; 2019.
5. Hegazi SM, Ghali Y, Foda MS, Youssef A. Nutritive value of barley rootlets, a by‐product of malting. J Sci Food Agric 1975;26:1077–81. https://doi.org/10.1002/jsfa.2740260805 .
6. Almeida FN, Petersen GI, Stein HH. Digestibility of amino acids in corn, corn coproducts, and bakery meal fed to growing pigs. J Anim Sci 2011;89:4109–15. https://doi.org/10.2527/jas.2011-4143 .
7. AAFCO. American Association of Feed Control Officials [Internet] Association of American Feed Control Officials Official Publication; 2021. [cited 2022 Feb 3]. Available from: https://www.aafco.org/ .
8. Heuzé V, Tran G, Renaudeau D, Lessire M, Lebas F. Wheat grain [Internet]. Feedipedia, a programme by INRAE, CIRAD, AFZ and FAO 2015. [cited 2022 Feb 15]. Available from: https://www.feedipedia.org/node/223 .
9. Rhodes L, Broderick A. Bioconversion of nitrogen supplemented wheat pollard and bran by filamentous fungi. Biol Wastes 1989;30:101–9. https://doi.org/10.1016/0269-7483(89)90064-5 .
10. Nortey TN, Patience JF, Sands JS, Trottier NL, Zijlstra RT. Effects of xylanase supplementation on the apparent digestibility and digestible content of energy, amino acids, phosphorus, and calcium in wheat and wheat by-products from dry milling fed to grower pigs. J Anim Sci 2008;86:3450–64. https://doi.org/10.2527/jas.2007-0472 .
11. Official methods of analysis of AOAC International Association of Official, Analytical Chemists 21th edth ed. Rockville, MD, USA: AOAC Int; 2019.
12. U.S., Environmental Protection Agency. Acid digestion of sediments, sludges, and soils Washington, DC, USA: U.S EPA; 2000.
13. McGhee ML, Stein HH. Apparent and standardized ileal digestibility of AA and starch in hybrid rye, barley, wheat, and corn fed to growing pigs. J Anim Sci 2018;96:3319–29. https://doi.org/10.1093/jas/sky206 .
14. Committee on Nutrient Requirements of Swine, National Research Council. Nutrient requirements of swine 11th edth ed. Washington, DC, USA: National Academy Press; 2012.
15. Rodehutscord M, Rückert C, Maurer HP, et al. Variation in chemical composition and physical characteristics of cereal grains from different genotypes. Arch Anim Nutr 2016;70:87–107. https://doi.org/10.1080/1745039X.2015.1133111 .
16. Rostagno HS, Teixeira Albino LF, Hannas MI, et al. Brazilian tables for poultry and swine 4th edth ed. Viçosa, MG, Brazil: Feedstuff composition and nutritional requirements; 2017.
17. Woods VB, O’mara FP, Moloney AP. The nutritive value of concentrate feedstuffs for ruminant animals: Part I: In situ ruminal degradability of dry matter and organic matter. Anim Feed Sci Technol 2003;110:111–30. https://doi.org/10.1016/S0377-8401(03)00220-7 .
18. Heuzé V, Tran G, Sauvant D, Renaudeau D, Lessire M, Lebas F. Corn gluten meal [Internet]. Feedipedia, a programme by INRAE, CIRAD, AFZ and FAO 2018. [cited 2022 Mar 30]. Available from: https://www.feedipedia.org/node/715 .
19. Rojas OJ, Liu Y, Stein HH. Phosphorus digestibility and concentration of digestible and metabolizable energy in corn, corn coproducts, and bakery meal fed to growing pigs. J Anim Sci 2013;91:5326–35. https://doi.org/10.2527/jas.2013-6324 .
20. Rosenfelder P, Eklund M, Mosenthin R. Nutritive value of wheat and wheat by-products in pig nutrition: a review. Anim Feed Sci Technol 2013;185:107–25. https://doi.org/10.1016/j.anifeedsci.2013.07.011 .
21. Jaworski NW, Liu DW, Li DF, Stein HH. Wheat bran reduces concentrations of digestible, metabolizable, and net energy in diets fed to pigs, but energy values in wheat bran determined by the difference procedure are not different from values estimated from a linear regression procedure. J Anim Sci 2016;94:3012–21. https://doi.org/10.2527/jas.2016-0352 .
22. Jha R, Regmi P, Wang L, Pharazyn A, Zijlstra RT. Nutrient profile and energy digestibility of wheat co-products from flour milling differ in growing pigs. West Hog J 2012;46:e8.
23. Casas GA, Rodriguez DA, Stein HH. Nutrient composition and digestibility of energy and nutrients in wheat middlings and red dog fed to growing pigs. J Anim Sci 2018;96:215–24. https://doi.org/10.1093/jas/skx010 .
24. Navarro DMDL, Bruininx EMAM, de Jong L, Stein HH. Analysis for low-molecular-weight carbohydrates are needed to account for all energy contributing nutrients in some feed ingredients, but physical characteristics do not predict in vitro digestibility of dry matter. J Anim Sci 2018;96:532–44. https://doi.org/10.1093/jas/sky010 .
25. United States Department of Agriculture Economics, Statistics and Market Information System (USDA-ESMIS). Grain: World Markets and Trade [Internet] Foreign Agricultural Service; 2022. [cited 2022 Apr 1]. Available from: https://downloads.usda.library.cornell.edu/usda-esmis/files/zs25x844t/9593vz755/v979w611p/grain.pdf .
26. Kim BG, Wulf DM, Maddock RJ, et al. Effects of dietary barley on growth performance, carcass traits and pork quality of finishing pigs. Rev Colom Cienc Pecua 2014;27:102–13.
27. Laurinen P, Valaja J, Näsi M, Smeds K. Effects of different expander processing conditions on the nutritive value of barley and wheat by-products in pig diets. Anim Feed Sci Technol 1998;74:213–27. https://doi.org/10.1016/S0377-8401(98)00182-5 .
28. United States Department of Agriculture (USDA). Declining Crop Prices, Rising Production and Exports Highlight U.S. Agricultural Projections to 2032 2023. [cited 2023 Apr 7]. Available from: https://www.ers.usda.gov/amber-waves/ .
29. United States Department of Agriculture Foreign Agricultural Service (USDA-FAS). World agricultural production briefs – South East Asia [Internet] International Production Assessment Division (IPAD); 2022. [cited 2022 Apr 4]. Available from: https://ipad.fas.usda.gov/cropexplorer/pecad_stories.aspx?regionid=seasia&ftype=prodbriefs .
30. Liu Y, Song M, Almeida FN, Tilton SL, Cecava MJ, Stein HH. Energy concentration and amino acid digestibility in corn and corn coproducts from the wet-milling industry fed to growing pigs. J Anim Sci 2014;92:4557–65. https://doi.org/10.2527/jas.2014-6747 .
31. Choi H, Sung JY, Kim BG. Neutral detergent fiber rather than other dietary fiber types as an independent variable increases the accuracy of prediction equation for digestible energy in feeds for growing pigs. Asian-Australas J Anim Sci 2020;33:615–22. https://doi.org/10.5713/ajas.19.0103 .

Article information Continued

Table 1

Analyzed nutrient composition of barley grain, as-fed basis1)

Item (%) Australia Indonesia

Sample 1 Sample 2 Sample 3 Sample 4 Sample 5 Sample 6 CV Average
Dry matter 89.16 89.14 88.83 88.86 89.14 89.16 0.18 89.05 89.45
Gross energy (kcal/kg) 4,012 4,031 4,048 4,055 3,931 3,965 1.23 4,007 3,962
Crude protein 10.98 11.04 11.22 11.28 8.62 10.57 9.52 10.62 11.19
AEE 2.05 2.14 2.00 2.17 2.03 2.53 9.09 2.15 2.20
Ash 2.14 2.12 1.95 2.01 1.79 3.78 32.06 2.30 2.98
Carbohydrates
 Total starch 54.10 55.23 54.31 53.27 58.16 53.50 3.29 54.76 47.39
 Insoluble dietary fiber 14.94 15.04 16.11 15.29 15.95 14.64 3.81 15.33 22.14
 Soluble dietary fiber 3.13 3.94 3.75 3.44 2.83 2.83 14.13 3.32 2.62
 Total dietary fiber 18.07 18.98 19.86 18.74 18.78 17.46 4.39 18.65 24.75
 Rest fraction2) 2.64 0.44 0.70 2.58 0.59 2.11 - 1.51 1.44
Indispensable AA
 Arginine 0.52 0.51 0.52 0.52 0.40 0.58 11.57 0.51 0.54
 Histidine 0.24 0.24 0.24 0.24 0.19 0.24 8.81 0.23 0.24
 Isoleucine 0.41 0.41 0.44 0.42 0.32 0.43 10.68 0.41 0.41
 Leucine 0.75 0.75 0.79 0.76 0.60 0.77 9.31 0.74 0.72
 Lysine 0.45 0.44 0.45 0.43 0.35 0.58 16.45 0.45 0.48
 Methionine 0.19 0.17 0.18 0.17 0.14 0.21 13.23 0.18 0.18
 Phenylalanine 0.57 0.58 0.62 0.59 0.42 0.53 12.84 0.55 0.55
 Threonine 0.36 0.36 0.36 0.35 0.29 0.39 9.42 0.35 0.38
 Tryptophan 0.10 0.10 0.10 0.10 0.08 0.09 8.81 0.10 0.09
 Valine 0.56 0.55 0.56 0.55 0.43 0.53 9.47 0.53 0.54
Dispensable AA
 Alanine 0.44 0.43 0.44 0.43 0.35 0.45 8.67 0.42 0.48
 Aspartic acid 0.68 0.67 0.65 0.63 0.53 0.81 13.67 0.66 0.73
 Cysteine 0.24 0.24 0.25 0.23 0.19 0.23 9.12 0.23 0.22
 Glutamic acid 2.54 2.58 2.81 2.66 1.88 2.16 14.29 2.44 2.35
 Glycine 0.45 0.44 0.46 0.45 0.36 0.45 8.57 0.44 0.47
 Proline 1.12 1.14 1.31 1.23 0.82 0.85 18.60 1.08 1.02
 Serine 0.41 0.40 0.43 0.42 0.33 0.42 9.10 0.40 0.42
 Tyrosine 0.26 0.26 0.27 0.28 0.19 0.27 12.83 0.26 0.27
Minerals
 Calcium 0.03 0.04 0.05 0.05 0.03 0.02 33.03 0.04 0.06
 Phosphorus 0.38 0.33 0.29 0.26 0.26 0.30 15.13 0.30 0.38
 Magnesium 0.15 0.11 0.09 0.10 0.10 0.12 19.14 0.11 0.12
 Potassium 0.70 0.37 0.44 0.48 0.40 0.53 24.44 0.49 0.55
 Sodium 0.02 0.01 0.03 0.03 0.04 0.01 51.90 0.02 0.02
 Sulfur 0.08 0.01 0.01 0.02 0.02 0.05 88.01 0.03 0.02
 Cooper (mg/kg) 8.28 7.19 6.22 6.35 4.40 5.66 20.80 6.35 6.24
 Iron (mg/kg) 78.00 53.24 32.18 36.02 36.53 28.92 42.11 44.15 71.60
 Manganese (mg/kg) 27.16 15.99 11.72 12.53 12.64 49.95 69.27 21.67 14.54
 Zinc (mg/kg) 34.94 24.46 21.22 20.81 16.31 17.70 29.68 22.57 26.58

CV, coefficient of variation; AEE, acid hydrolyzed ether extract; AA, amino acids.

1)

Except for dry matter, all values were adjusted to 90% dry matter.

2)

Rest fraction = calculated using the following equation: [Dry matter – (crude protein + AEE + ash + total dietary fiber + total starch)].

Table 2

Analyzed nutrient composition of malt barley rootlets, as-fed basis1)

Item (%) Australia Indonesia
Dry matter 91.33 90.49
Gross energy (kcal/kg) 4,109 4,085
Crude protein 25.66 26.07
AEE 2.81 2.02
Ash 5.57 6.42
Carbohydrates
 Total starch 10.84 8.16
 Insoluble dietary fiber 35.08 36.40
 Soluble dietary fiber 1.38 2.19
 Total dietary fiber 36.46 38.59
 Glucose 3.21 1.59
 Fructose 2.69 1.48
 Maltose 2.57 2.50
 Sucrose 1.39 2.81
 Stachyose ND ND
 Raffinose 0.31 0.23
 Rest fraction2) −1.51 0.14
Indispensable AA
 Arginine 1.01 1.09
 Histidine 0.45 0.47
 Isoleucine 0.83 0.91
 Leucine 1.31 1.42
 Lysine 1.17 1.31
 Methionine 0.35 0.39
 Phenylalanine 0.80 0.87
 Threonine 0.80 0.87
 Tryptophan 0.13 0.13
 Valine 1.17 1.17
Dispensable AA
 Alanine 1.10 1.26
 Aspartic acid 3.08 2.91
 Cysteine 0.36 0.38
 Glutamic acid 2.83 2.59
 Glycine 0.94 1.04
 Proline 1.32 1.38
 Serine 0.74 0.77
 Tyrosine 0.49 0.52
Minerals
 Calcium 0.13 0.12
 Phosphorus 0.59 0.70
 Magnesium 0.15 0.17
 Potassium 1.84 1.45
 Sodium 0.15 0.05
 Sulfur 0.07 0.14
 Cooper (mg/kg) 10.24 12.77
 Iron (mg/kg) 107.08 85.33
 Manganese (mg/kg) 51.03 62.02
 Zinc (mg/kg) 77.13 99.44

AEE, acid hydrolyzed ether extract; ND, not detected; AA, amino acids.

1)

Except for dry matter, all values were adjusted to 90% dry matter.

2)

Rest fraction = calculated using the following equation: [Dry matter – (crude protein + AEE + ash + total dietary fiber + total starch + glucose + fructose + maltose + sucrose + stachyose + raffinose)].

Table 3

Analyzed nutrient composition of corn co-products, as-fed basis1)

Item (%) Indonesia Philippines


Corn gluten feed Corn bran Corn gluten meal
Dry matter 91.02 90.32 92.97
Gross energy (kcal/kg) 4,105 4,374 5,270
Crude protein 20.21 11.12 62.57
AEE 3.47 9.92 5.93
Ash 5.32 3.18 1.67
Carbohydrates
 Total starch 10.88 34.88 10.94
 Insoluble dietary fiber 46.08 29.59 4.07
 Soluble dietary fiber 1.19 1.20 1.16
 Total dietary fiber 47.26 30.79 5.23
 Rest fraction2) 2.86 0.11 3.66
Indispensable AA
 Arginine 0.96 0.69 2.11
 Histidine 0.66 0.33 1.29
 Isoleucine 0.63 0.38 2.70
 Leucine 1.71 0.96 9.84
 Lysine 0.73 0.53 1.16
 Methionine 0.33 0.20 1.65
 Phenylalanine 0.71 0.48 3.87
 Threonine 0.71 0.42 2.10
 Tryptophan 0.10 0.07 0.37
 Valine 0.97 0.56 2.99
Dispensable AA
 Alanine 1.46 0.72 5.38
 Aspartic acid 1.09 0.80 3.82
 Cysteine 0.51 0.24 1.16
 Glutamic acid 2.98 1.63 13.48
 Glycine 0.90 0.54 1.85
 Proline 1.80 0.78 5.76
 Serine 0.72 0.44 2.94
 Tyrosine 0.55 0.30 3.15
Minerals
 Calcium 0.04 0.25 0.01
 Phosphorus 1.02 0.75 0.23
 Magnesium 0.46 0.25 0.01
 Potassium 1.65 0.63 0.13
 Sodium 0.09 0.01 0.01
 Sulfur 0.08 0.01 ND
 Cooper (mg/kg) 7.74 23.61 9.75
 Iron (mg/kg) 157.89 126.95 48.77
 Manganese (mg/kg) 25.49 14.24 24.96
 Zinc (mg/kg) 70.83 53.31 17.85

AEE, acid hydrolyzed ether extract; AA, amino acids; ND, not detected.

1)

Except for dry matter, all values were adjusted to 90% dry matter.

2)

Rest fraction = calculated using the following equation: [Dry matter – (crude protein + AEE + ash + total dietary fiber + total starch)].

Table 4

Analyzed nutrient composition of wheat bran, as-fed basis1)

Item (%) Australia Indonesia Philippines Thailand Vietnam


Sample 1 Sample 2 Sample 3 CV Sample 1 Sample 2 CV
Dry matter 89.45 89.8 88.47 0.77 88.99 88.81 90.13 88.74 1.10 90.80
Gross energy (kcal/kg) 4,161 4,057 3,980 2.24 4,100 4,130 4,114 4,058 0.97 4,092
Crude protein 18.50 17.35 17.39 3.70 15.38 15.90 18.85 15.05 15.86 16.03
AEE 3.85 4.08 4.36 6.24 3.93 4.43 5.16 3.26 32.04 4.56
Ash 4.48 4.46 4.97 6.30 3.81 4.65 4.75 3.51 21.29 5.16
Carbohydrates
 Total starch 20.02 18.94 12.41 24.05 22.55 16.21 14.08 26.06 42.22 17.35
 Insoluble dietary fiber 34.61 36.18 42.62 11.23 35.50 42.26 40.94 31.85 17.67 40.84
 Soluble dietary fiber 2.92 1.70 2.75 26.75 2.43 2.43 1.30 2.33 40.30 2.28
 Total dietary fiber 37.53 37.88 45.37 11.00 37.93 44.69 42.24 34.18 14.92 43.12
 Glucose 0.08 0.40 1.15 100.92 0.39 0.23 0.36 0.35 0.89 0.36
 Fructose 0.18 0.28 0.68 69.52 0.25 0.19 0.25 0.25 1.10 0.30
 Maltose 1.95 2.06 1.46 17.44 2.30 1.26 1.65 3.25 46.18 1.32
 Sucrose 2.69 2.36 0.45 66.04 2.07 2.16 2.73 1.91 25.01 2.16
 Stachyose ND 0.07 ND 173.21 ND 0.05 0.06 ND 141.42 0.06
 Raffinose 1.26 1.19 0.61 34.94 0.57 1.11 1.49 0.98 28.84 1.33
 Rest fraction2) −0.54 0.92 1.14 - 0.81 −0.89 −1.62 1.20 - −1.73
Indispensable AA
 Arginine 1.17 1.11 1.09 3.59 0.98 1.01 1.18 0.84 23.56 0.96
 Histidine 0.47 0.45 0.48 3.08 0.39 0.42 0.48 0.37 19.13 0.40
 Isoleucine 0.58 0.54 0.57 3.82 0.52 0.52 0.57 0.50 9.58 0.50
 Leucine 1.08 0.99 0.98 5.30 0.91 0.93 1.03 0.89 10.01 0.90
 Lysine 0.67 0.69 0.67 1.61 0.63 0.66 0.74 0.56 19.75 0.64
 Methionine 0.26 0.25 0.23 5.59 0.23 0.22 0.26 0.24 4.56 0.23
 Phenylalanine 0.72 0.66 0.65 5.85 0.60 0.62 0.68 0.60 8.93 0.58
 Threonine 0.54 0.52 0.51 3.35 0.48 0.49 0.54 0.45 13.34 0.48
 Tryptophan 0.17 0.15 0.19 12.52 0.15 0.19 0.19 0.17 6.76 0.14
 Valine 0.83 0.77 0.79 3.37 0.71 0.73 0.82 0.66 15.27 0.71
Dispensable AA
 Alanine 0.78 0.78 0.77 0.77 0.72 0.74 0.83 0.62 20.53 0.72
 Aspartic acid 1.19 1.13 1.14 2.59 1.01 1.03 1.21 0.92 18.93 1.03
 Cysteine 0.38 0.35 0.38 4.53 0.31 0.31 0.36 0.33 5.05 0.32
 Glutamic acid 3.64 3.08 2.87 12.52 2.72 2.78 3.03 3.13 2.49 2.63
 Glycine 0.93 0.87 0.96 4.65 0.80 0.82 0.93 0.70 19.88 0.78
 Proline 1.16 0.99 0.94 11.18 0.90 0.90 0.96 0.99 2.56 0.84
 Serine 0.67 0.62 0.60 6.02 0.55 0.55 0.63 0.53 12.44 0.55
 Tyrosine 0.45 0.43 0.45 2.57 0.38 0.40 0.44 0.38 11.13 0.36
Minerals
 Calcium 0.10 0.09 0.09 6.02 0.12 0.09 0.10 0.07 23.89 0.04
 Phosphorus 1.00 1.02 1.10 5.13 0.77 1.03 1.20 0.67 40.05 0.80
 Magnesium 0.36 0.38 0.40 4.55 0.29 0.37 0.41 0.21 44.63 0.34
 Potassium 1.06 1.01 1.16 7.03 0.96 1.19 1.07 0.75 24.72 0.75
 Sodium 0.01 0.01 0.01 0.78 0.03 0.01 0.01 0.01 1.10 0.01
 Sulfur 0.02 0.01 0.02 35.04 0.03 0.02 0.01 0.02 48.11 ND
 Cooper (mg/kg) 20.92 20.72 22.61 4.87 17.72 19.60 23.56 14.58 33.27 18.46
 Iron (mg/kg) 127.34 151.04 151.59 9.66 103.45 143.81 144.18 99.75 25.76 201.85
 Manganese (mg/kg) 147.92 136.67 155.63 6.50 108.43 139.67 138.14 96.43 25.15 82.18
 Zinc (mg/kg) 72.31 91.53 87.67 12.13 63.58 77.07 96.42 45.27 51.05 32.38

CV, coefficient of variation; AEE, acid hydrolyzed ether extract; ND, not detected; AA, amino acids.

1)

Except for dry matter, all values were adjusted to 90% dry matter.

2)

Rest fraction = calculated using the following equation: [Dry matter – (crude protein + AEE + ash + total dietary fiber + total starch + glucose + fructose + maltose + sucrose + stachyose + raffinose)].

Table 5

Analyzed nutrient composition of wheat mill mix and wheat pollard, as-fed basis1)

Item (%) Australia Philippines


Mill mix Pollard soft Pollard hard CV Average

Sample 1 Sample 2 Sample 3
Dry matter 90.52 91.26 90.00 91.30 89.44 1.03 90.50
Gross energy (kcal/kg) 4,144 4,036 4,084 4,032 4,129 1.12 4,070
Crude protein 16.67 16.12 17.67 17.61 18.66 5.97 17.52
AEE 4.50 4.38 4.69 4.01 4.65 7.06 4.43
Ash 3.98 4.79 5.12 4.21 4.97 8.35 4.77
Carbohydrates
 Total starch 18.00 20.02 14.80 24.64 17.50 21.75 19.24
 Insoluble dietary fiber 38.68 36.19 39.60 30.76 36.13 10.25 35.67
 Soluble dietary fiber 1.39 2.37 1.70 1.38 2.14 23.28 1.90
 Total dietary fiber 40.07 38.56 41.30 32.14 38.26 10.30 37.56
 Glucose 0.26 0.30 0.29 0.30 0.31 2.13 0.30
 Fructose 0.15 0.21 0.20 0.19 0.20 4.32 0.20
 Maltose 2.68 2.50 1.81 3.42 2.57 25.63 2.58
 Sucrose 2.98 3.17 2.33 2.28 2.21 18.02 2.50
 Stachyose ND ND 0.17 0.79 0.07 140.17 0.26
 Raffinose 1.21 1.39 1.38 1.40 1.51 4.13 1.42
 Rest fraction2) −0.51 −1.43 0.24 −0.98 0.10 - −0.52
Indispensable AA
 Arginine 1.03 1.07 1.11 1.08 1.23 6.43 1.13
 Histidine 0.42 0.43 0.45 0.44 0.49 5.27 0.45
 Isoleucine 0.54 0.53 0.53 0.60 0.62 8.18 0.57
 Leucine 0.94 0.96 0.98 1.05 1.10 6.45 1.02
 Lysine 0.66 0.68 0.67 0.67 0.77 7.18 0.70
 Methionine 0.24 0.23 0.24 0.27 0.27 8.86 0.25
 Phenylalanine 0.63 0.62 0.65 0.71 0.72 7.13 0.68
 Threonine 0.50 0.48 0.52 0.51 0.56 6.07 0.52
 Tryptophan 0.15 0.21 0.18 0.20 0.18 6.57 0.19
 Valine 0.73 0.76 0.76 0.81 0.88 6.83 0.80
Dispensable AA
 Alanine 0.73 0.74 0.77 0.77 0.86 6.95 0.79
 Aspartic acid 1.10 1.07 1.16 1.13 1.23 5.64 1.15
 Cysteine 0.36 0.34 0.36 0.37 0.38 5.26 0.36
 Glutamic acid 2.87 2.81 2.91 3.67 3.35 12.49 3.18
 Glycine 0.84 0.82 0.87 0.86 0.96 6.65 0.88
 Proline 0.94 0.87 0.91 1.13 1.05 12.42 0.99
 Serine 0.59 0.54 0.62 0.61 0.64 7.08 0.60
 Tyrosine 0.40 0.39 0.42 0.44 0.45 5.76 0.43
Minerals
 Calcium 0.09 0.09 0.10 0.09 0.10 7.43 0.09
 Phosphorus 0.78 1.14 1.15 0.96 1.17 9.04 1.11
 Magnesium 0.36 0.45 0.51 0.42 0.50 8.49 0.47
 Potassium 0.99 1.38 1.28 1.06 1.28 10.65 1.25
 Sodium 0.01 0.01 0.01 0.01 0.01 1.51 0.01
 Sulfur 0.05 0.03 0.02 0.00 0.00 119.71 0.01
 Cooper (mg/kg) 11.31 16.08 16.40 13.37 16.64 9.73 15.62
 Iron (mg/kg) 131.57 133.63 161.44 119.10 335.12 53.43 187.32
 Manganese (mg/kg) 152.89 139.30 154.46 125.28 163.90 11.66 145.74
 Zinc (mg/kg) 65.33 74.55 92.13 78.87 100.08 13.65 86.41

CV, coefficient of variation; AEE, acid hydrolyzed ether extract; ND, not detected; AA, amino acids.

1)

Except for dry matter, all values were adjusted to 90% dry matter.

2)

Rest fraction = calculated using the following equation: [Dry matter – (crude protein + AEE + ash + total dietary fiber + total starch + glucose + fructose + maltose + sucrose + stachyose + raffinose)].

Table 6

Comparison among countries and ingredients for wheat co-products, as-fed basis1)

Item (%) Countries Wheat co-products3)

Wheat bran2)


Australia Thailand SEM p-value Wheat bran Wheat pollard SEM p-value
Dry matter 89.24 89.44 0.52 0.807 89.40 90.50 0.36 0.058
Gross energy (kcal/kg) 4,066 4,046 50.19 0.577 4,086 4,072 24.00 0.667
Crude protein 17.75 16.87 1.08 0.570 16.81 17.52 0.57 0.402
AEE 4.10 4.21 0.52 0.887 4.20 4.43 0.22 0.474
Ash 4.64 4.13 0.41 0.480 4.47 4.77 0.22 0.367
Carbohydrates
 Total starch 17.12 20.07 3.83 0.624 18.45 19.24 1.90 0.775
 Insoluble dietary fiber 37.80 36.40 3.28 0.781 38.10 35.67 1.70 0.337
 Soluble dietary fiber 2.46 1.82 0.44 0.380 2.27 1.84 0.24 0.229
 Total dietary fiber 40.26 38.21 3.16 0.677 40.37 37.57 1.72 0.277
 Glucose 0.54 0.36 0.29 0.677 0.42 0.30 0.11 0.493
 Fructose 0.38 0.25 0.14 0.557 0.30 0.20 0.06 0.262
 Maltose 1.82 2.43 0.51 0.480 1.91 2.58 0.28 0.128
 Sucrose 1.83 1.66 0.72 0.610 2.07 2.55 0.29 0.226
 Stachyose 0.02 0.03 0.03 0.870 0.03 0.26 0.09 0.093
 Raffinose 1.02 1.11 0.27 0.804 1.07 1.42 0.12 0.066
 Rest fraction4) 0.51 0.03 0.81 0.596 −0.09 −1.08 0.47 0.075
Indispensable AA
 Arginine 1.12 1.01 0.10 0.459 1.04 1.12 0.05 0.243
 Histidine 0.47 0.43 0.03 0.445 0.43 0.45 0.02 0.422
 Isoleucine 0.56 0.54 0.02 0.296 0.54 0.57 0.02 0.186
 Leucine 1.02 0.94 0.04 0.194 0.96 1.02 0.03 0.183
 Lysine 0.68 0.65 0.05 0.720 0.66 0.70 0.02 0.228
 Methionine 0.25 0.24 0.01 0.573 0.24 0.25 0.01 0.256
 Phenylalanine 0.68 0.63 0.02 0.122 0.64 0.68 0.02 0.241
 Threonine 0.52 0.49 0.03 0.464 0.50 0.52 0.01 0.429
 Tryptophan 0.17 0.18 0.01 0.591 0.17 0.20 0.01 0.024
 Valine 0.80 0.74 0.04 0.376 0.75 0.80 0.03 0.195
Dispensable AA
 Alanine 0.78 0.73 0.06 0.557 0.75 0.79 0.03 0.297
 Aspartic acid 1.15 1.06 0.08 0.485 1.08 1.15 0.04 0.273
 Cysteine 0.37 0.35 0.01 0.239 0.34 0.36 0.01 0.240
 Glutamic acid 3.20 3.08 0.21 0.723 2.99 3.19 0.15 0.366
 Glycine 0.92 0.82 0.07 0.380 0.85 0.88 0.04 0.578
 Proline 1.03 0.98 0.06 0.571 0.96 0.99 0.04 0.647
 Serine 0.63 0.57 0.03 0.222 0.59 0.60 0.02 0.621
 Tyrosine 0.44 0.41 0.02 0.272 0.41 0.43 0.01 0.514
Minerals
 Calcium 0.09 0.08 0.01 0.463 0.09 0.08 0.01 0.725
 Phosphorus 1.04 0.94 0.14 0.638 0.95 1.11 0.07 0.145
 Magnesium 0.38 0.31 0.05 0.425 0.35 0.47 0.03 0.007
 Potassium 1.08 0.92 0.10 0.382 0.99 1.25 0.07 0.025
 Sodium 0.01 0.01 0.00 0.998 0.01 0.01 0.00 0.506
 Sulfur 0.01 0.02 0.01 0.591 0.00 0.01 0.00 0.119
 Cooper (mg/kg) 21.42 19.09 2.68 0.599 19.77 15.62 1.10 0.024
 Iron (mg/kg) 143.32 121.97 13.80 0.354 140.38 187.32 26.44 0.238
 Manganese (mg/kg) 146.74 119.16 12.63 0.241 125.63 145.74 10.41 0.202
 Zinc (mg/kg) 83.84 70.85 14.51 0.572 70.78 86.41 0.23 0.231

SEM, standard error of the means; AEE, acid hydrolyzed ether extract; AA, amino acids.

1)

Except for dry matter, all values were adjusted to 90% dry matter.

2)

For wheat bran from Australia there were 3 observations and for wheat bran from Thailand there were 2 observations.

3)

There were 8 observations for wheat bran and 4 observations for wheat pollard.

4)

Rest fraction = calculated using the following equation: [Dry matter – (crude protein + AEE + ash + total dietary fiber + total starch + glucose + fructose + maltose + sucrose + stachyose + raffinose)].