Estimating genetic diversity and population structure of 22 chicken breeds in Asia using microsatellite markers
Article information
 , Seung-Chang Kim1, Chang-Yeon Cho1, Jinwook Lee1, Dayeon Jeon1, Dong-kyo Kim1, Kwan-Woo Kim1, Fahmida Afrin1, Yeoung-Gyu Ko1, Jun-Heon Lee2, Solongo Batsaikhan3, Triana Susanti4, Sergey Hegay5, Siton Kongvongxay6, Neena Amatya Gorkhali7, Lan Anh Nguyen Thi8, Trinh Thi Thu Thao8, Lakmalie Manikku9
Abstract
Objective
Estimating the genetic diversity and structures, both within and among chicken breeds, is critical for the identification and conservation of valuable genetic resources. In chickens, microsatellite (MS) marker polymorphisms have previously been widely used to evaluate these distinctions. Our objective was to analyze the genetic diversity and relationships among 22 chicken breeds in Asia based on allelic frequencies.
Methods
We used 469 genomic DNA samples from 22 chicken breeds from eight Asian countries (South Korea, KNG, KNB, KNR, KNW, KNY, KNO; Laos, LYO, LCH, LBB, LOU; Indonesia, INK, INS, ING; Vietnam, VTN, VNH; Mongolia, MGN; Kyrgyzstan, KGPS; Nepal, NPS; Sri Lanka, SBC) and three imported breeds (RIR, Rhode Island Red; WLG, White Leghorn; CON, Cornish). Their genetic diversity and phylogenetic relationships were analyzed using 20 MS markers.
Results
In total, 193 alleles were observed across all 20 MS markers, and the number of alleles ranged from 3 (MCW0103) to 20 (LEI0192) with a mean of 9.7 overall. The NPS breed had the highest expected heterozygosity (Hexp, 0.718±0.027) and polymorphism information content (PIC, 0.663±0.030). Additionally, the observed heterozygosity (Hobs) was highest in LCH (0.690±0.039), whereas WLG showed the lowest Hexp (0.372±0.055), Hobs (0.384±0.019), and PIC (0.325±0.049). Nei’s DA genetic distance was the closest between VTN and VNH (0.086), and farthest between KNG and MGN (0.503). Principal coordinate analysis showed similar results to the phylogenetic analysis, and three axes explained 56.2% of the variance (axis 1, 19.17%; 2, 18.92%; 3, 18.11%). STRUCTURE analysis revealed that the 22 chicken breeds should be divided into 20 clusters, based on the highest ΔK value (46.92).
Conclusion
This study provides a basis for future genetic variation studies and the development of conservation strategies for 22 chicken breeds in Asia.
INTRODUCTION
Prior to the Convention on Biological Diversity (CBD; Rio de Janeiro, Brazil) in 1992, genetic resources had been recognized as common global resources, however, after the CBD, they began to be regarded not as common, but as the individual resources of each respective country. In 2007, the Interlaken Declaration was adopted by the United Nations Food and Agriculture Organization, which suggested that each country should preserve their own animal genetic resources and promote the sustainable use of local breeds [1]. Moreover, the Nagoya protocol on access to genetic resources and the fair and equitable sharing of their benefits, for the conservation and sustainable use of biodiversity [2], was adopted in October 2010 by the CBD, at the 10th Conference of the Parties. The importance of animal genetic resources has subsequently become established.
Animal genetic diversity is a source of raw genetic material that can be utilized to improve breeds and adapt livestock populations to changing environments and demands. Thus, acquiring information on animal genetic diversity is essential to design strategies for their sustainable management [3,4]. In Asia, there are many chicken breeds that are distinguished by phenotypic differences, such as feather color, shank color, and comb type. While there are more than 21 billion chickens in the world, more than half of these (53%) are found in Asia. Among the common types of livestock kept by humans, chickens have the largest number of different breeds, at approximately 1,669, of which 1,514 are local breeds and 155 are regional or from areas that cross international boundaries [5]. However, due to the spread of imported breeds that have good commercial performance, the local breeds with poorer commercial performance have been ignored, to the point that some are now threatened by extinction [6]. The loss of a breed to extinction means the loss of its unique genetic resources, such as environmental adaptability and resistance to endemic diseases [7]. Therefore, it is necessary to develop a conservation strategy for local breeds, by studying their genetic diversity.
To identify genetic uniqueness, many countries have evaluated the genetic diversity and relatedness of local breeds using DNA markers such as microsatellites (MS), mitochondrial DNA (mtDNA), copy number variation, and single nucleotide polymorphism (SNP) [8–11]. In recent years, SNPs have been widely used in genetic research. MS markers are comparatively cheap to genotype and provide more genetic information for the population per marker than SNPs, which are biallelic markers. Moreover, MS markers are easily typed in samples with low concentrations of DNA and enable quick identification of breeds in contrast to SNPs [12]. MS markers, also known as simple-sequence repeats, have short tandem repeats of approximately 2 to 6 bp, and because they show co-dominant inheritance, are highly polymorphic, and are distributed throughout the genome [13,14], they are widely used to assess genetic diversity and relationships in many different fields [15–18].
Although many studies have analyzed the genetic diversity and phylogenetic relatedness of chickens using MS markers, they have been limited, as their samples generally only come from breeds of their respective country or of a few countries [19–22]. The National Institute of Animal Science (NIAS) in South Korea, however, has been carrying out the Asian Food & Agriculture Cooperation Initiative (AFACI) Animal Genetic Resources (AnGR) project since 2016, for the purpose of improving the value of animal genetic resources across Asia. Currently, 12 countries, including South Korea, are designated as member countries; NIAS has established a cooperative system by providing information and technologies for the characterization of animal genetic resources from these countries. NIAS is consequently able to utilize a large number of Asian chicken breed samples for scientific research. Consequently, in this study, we have investigated the genetic diversity and relationships among 22 chicken breeds in eight AFACI member countries including three imported breeds, using 20 MS markers.
MATERIALS AND METHODS
Sample collection and extraction of genomic DNA
A total of 469 chickens, belonging to 19 different chicken breeds from eight different countries and three imported breeds were used in this study. The 22 chicken breeds included six Korean native breeds (KNG, KNB, KNR, KNW, KNY, KNO), four Laotian (LYO, LCH, LBB, LOU), three Indonesian (INK, INS, ING), two Vietnamese (VTN, VNH), one Kyrgyzstani (KGPS), one Mongolian (MGN), one Nepalese (NPS), one Sri Lankan (SBC), and three imported (RIR, Rhode Island Red; WLG, White Leghorn; CON, Cornish). Detailed information on these breeds can be found in Table 1. Ulnar venous blood of the six Korean native breeds and the three imported breeds was collected from the Animal Genetic Resources Research Center at NIAS. Genomic DNA was extracted from the blood using the Wizard Genomic DNA purification Kit (Promega, Madison, WI, USA) according to the manufacturer’s instructions. Genomic DNA of the other chicken breeds was obtained from each country, for the purposes of the AFACI AnGR project. The DNA concentrations were quantified by UV Spectrophotometer (Nanodrop ND-1000; Thermo Scientific, Waltham, MA, USA) and the samples were diluted to a final concentration of 10 ng/μL in distilled water. This experiment was conducted with the approval of the NIAS Committee on the Ethics of Animal Experiments (approval number: 2018-048).

Description of the 22 chicken breeds used in this study
Microsatellite markers and polymerase chain reaction amplification
Ten MS markers were selected from among the International Society for Animal Genetics / Food and Agriculture Organization of the United Nations (ISAG/FAO) recommended markers. Another Ten MS markers were selected based on their high heterozygosity in the Ark database website (Roslin Bioinformatics Group, Edinburgh, UK). The information for the twenty MS markers used in this study is available in Supplementary Table A. Extracted DNAs were amplified by the GeneAmp PCR 9700 system (Applied Biosystems, Foster, CA, USA) using AccuPower Negative dye PCR PreMix (Bioneer, Daejeon, Korea), including DNA polymerase, dNTP, Tris-HCl, KCL, and MgCl2. The polymerase chain reaction (PCR) reactions were performed in a total reaction volume of 20 μL containing 2 μL of template DNA, and 0.4 to 2.6 μL (2 pmol/μL) of primer based on the multiplex combinations. The initial denaturation was performed at 95°C for 5 min, followed by 35 cycles of 60 s at 95°C, 45 s of annealing at 58°C to 62°C based on the multiplex combination, 60 s of extension at 72°C, a final extension at 72°C for 30 min, and then cooling to 4°C.
Determining allele sizes in each marker
After PCR amplification, the genotyping reaction mixtures were made using 1 μL of the PCR products, 10 μL of Hi-Di Formamide (Applied Biosystems, USA), and the GeneScan 500 LIZ Size Standard (Applied Biosystems, USA) mixture. The genotyping reaction mixture was denatured for 10 min at 95°C and then immediately placed in ice. Electrophoresis was performed using capillary arrays in an ABI PRISM 3130xl Genetic Analyzer (Applied Biosystems, USA). The allele sizes were determined using GeneMapper Software 5 (Applied Biosystems, USA) and was analyzed statistically.
Statistical analysis
The allele frequencies, the number of alleles, expected heterozygosity (Hexp), observed heterozygosity (Hobs), and polymorphism information content (PIC) values for each of the chicken breeds across the 20 loci were calculated using the MS Tool Kit [23]. Nei’s DA genetic distances between breeds were calculated using the DISPAN software [24]. The output file for the neighbor-joining (NJ) phylogenetic tree was generated using the PHYLIP package [25] and visualized using TreeView 1.6 [26].
The genetic structures and the degree of admixture among the 22 chicken breeds were analyzed using the Bayesian clustering procedure of STRUCTURE ver 2.3.4 [27]. Twenty independent runs were performed for each K value from 2 to 22. For all runs, the admixture models had a burn-in period of 20,000 repeats, followed by 100,000 repeats of the Markov chain Monte Carlo algorithm. To identify the K value that best fits the data, STURCTURE HARVERSTER [28] was used, which implements the Evanno method [29]. The CLUMPP program ver 1.1.2 [30] was used to align the 20 repetitions of each K value. The CLUMPP output files were visualized using the DISTRUCT program ver 1.1 [31]. Principal coordinate analysis (PCoA) was conducted using the adegenet package [32] in R Studio [33].
RESULTS AND DISCUSSION
Genetic diversity of 22 chicken breeds using MS markers
To obtain insight into the genetic diversity and population structures, the Hexp, Hobs, and the PIC value for each locus were calculated using the MS Tool kit (Table 2). From the 20 MS markers, a total of 193 alleles were identified in the 22 chicken breeds. The number of alleles ranged from 3 (MCW0103) to 20 (LEI0192) (mean 9.65). The means of Hexp, Hobs, and PIC were 0.598±0.022, 0.591±0.020, and 0.523±0.023, respectively, for the 20 MS markers. The lowest values of Hexp (0.348±0.036), Hobs (0.382±0.046), and PIC (0.272±0.027), were all found at the MCW0103 locus, whereas the highest values of Hexp (0.714±0.021) and PIC (0.640±0.022) were found at the ADL0176 locus, and the highest value of Hobs (0.735±0.034) was found at the MCW0193 locus. Moreover, MCW0103 showed low polymorphism levels in previous studies [34–36]. Botstein et al [37] reported that MS markers with PIC≥0.5 and Hexp≥0.6 were highly informative for genetic analysis. Our study demonstrated that 13 of the 20 MS markers were highly informative for discrimination analysis, and would be appropriate for the analysis of the 22 chicken breeds.
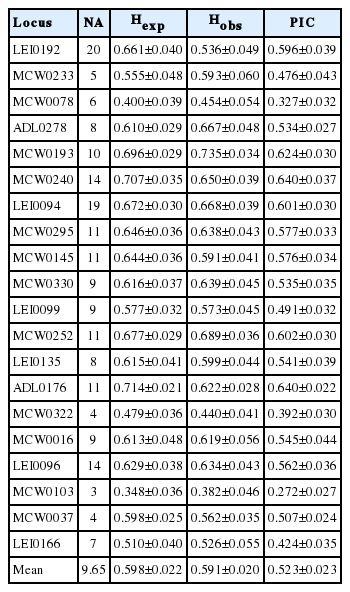
The statistical analysis of heterozygosity and polymorphism information content using 20 microsatellite markers
Furthermore, the genetic diversity parameters of the 22 chicken breeds were calculated using the MS Tool Kit (Table 3). The mean number of alleles ranged from 2.15±0.93 (MGN) to 6.50±3.02 (NPS). The imported breed WLG showed the lowest Hexp (0.372±0.055), Hobs (0.384±0.019) and MGN showed the lowest PIC (0.306±0.048), while NPS showed the highest Hexp (0.718±0.027) and PIC (0.663±0.030). Correspondingly, although the population size was small, LCH had the highest Hobs (0.690±0.039). Overall, the diversity of the imported breeds was lower than that of local chicken breeds in 8 countries, except for MGN. This is because the imported breeds have been strongly selected for their performance characteristics and breeding purpose (meat type, egg type, etc.) for many decades. In our study, the genetic diversity of the Korean native chicken (KNC) breeds was lower than that of the other Asian chicken breeds tested. The reason for this may be that five KNC breeds (KNY, KNR, KNW, KNG, and KNG) were restored in 2008 by NIAS, according to the genetic fixation of their different feather colors [38], and this fixation was absent in the other Asian chicken breeds tested. Thus, we further investigated whether the genetic distances could be discriminated amongst between the 22 chicken breeds.

Genetic diversity parameters in 22 chicken breeds
Genetic distance and phylogenetic analysis among 22 chicken breeds
To further investigate the genetic divergences among the breeds using the 20 MS marker allele frequencies, we estimated Nei’s DA genetic distance between pairs of breeds, for all 22 chicken breeds, using the DISPAN program (Supplementary Table B); the shortest genetic distance was between VNH and VTN at 0.086, and the longest was between KNG and MGN at 0.503. Moreover, to understand the evolutionary relationships among the chicken breeds, an NJ phylogenetic tree was constructed using the PHYLIP program based on the DA genetic distance (Figure 1). In our study, three main branches appear in the phylogenetic tree. The first main branch comprised the KNC breeds (except for KNO), and the RIR and SBC breeds. The WLG, CON, KNO, MGN, and KGPS breeds constituted the second major branch, and this branch was further subdivided into the WLG and CON groups. KNO was grouped with CON, whereas MGN and KGPS were grouped with WLG. The third main branch was comprised of the other Asian chicken breeds. This suggests that the KNC breeds are clearly genetically separated from the other Asian chicken breeds that we studied.
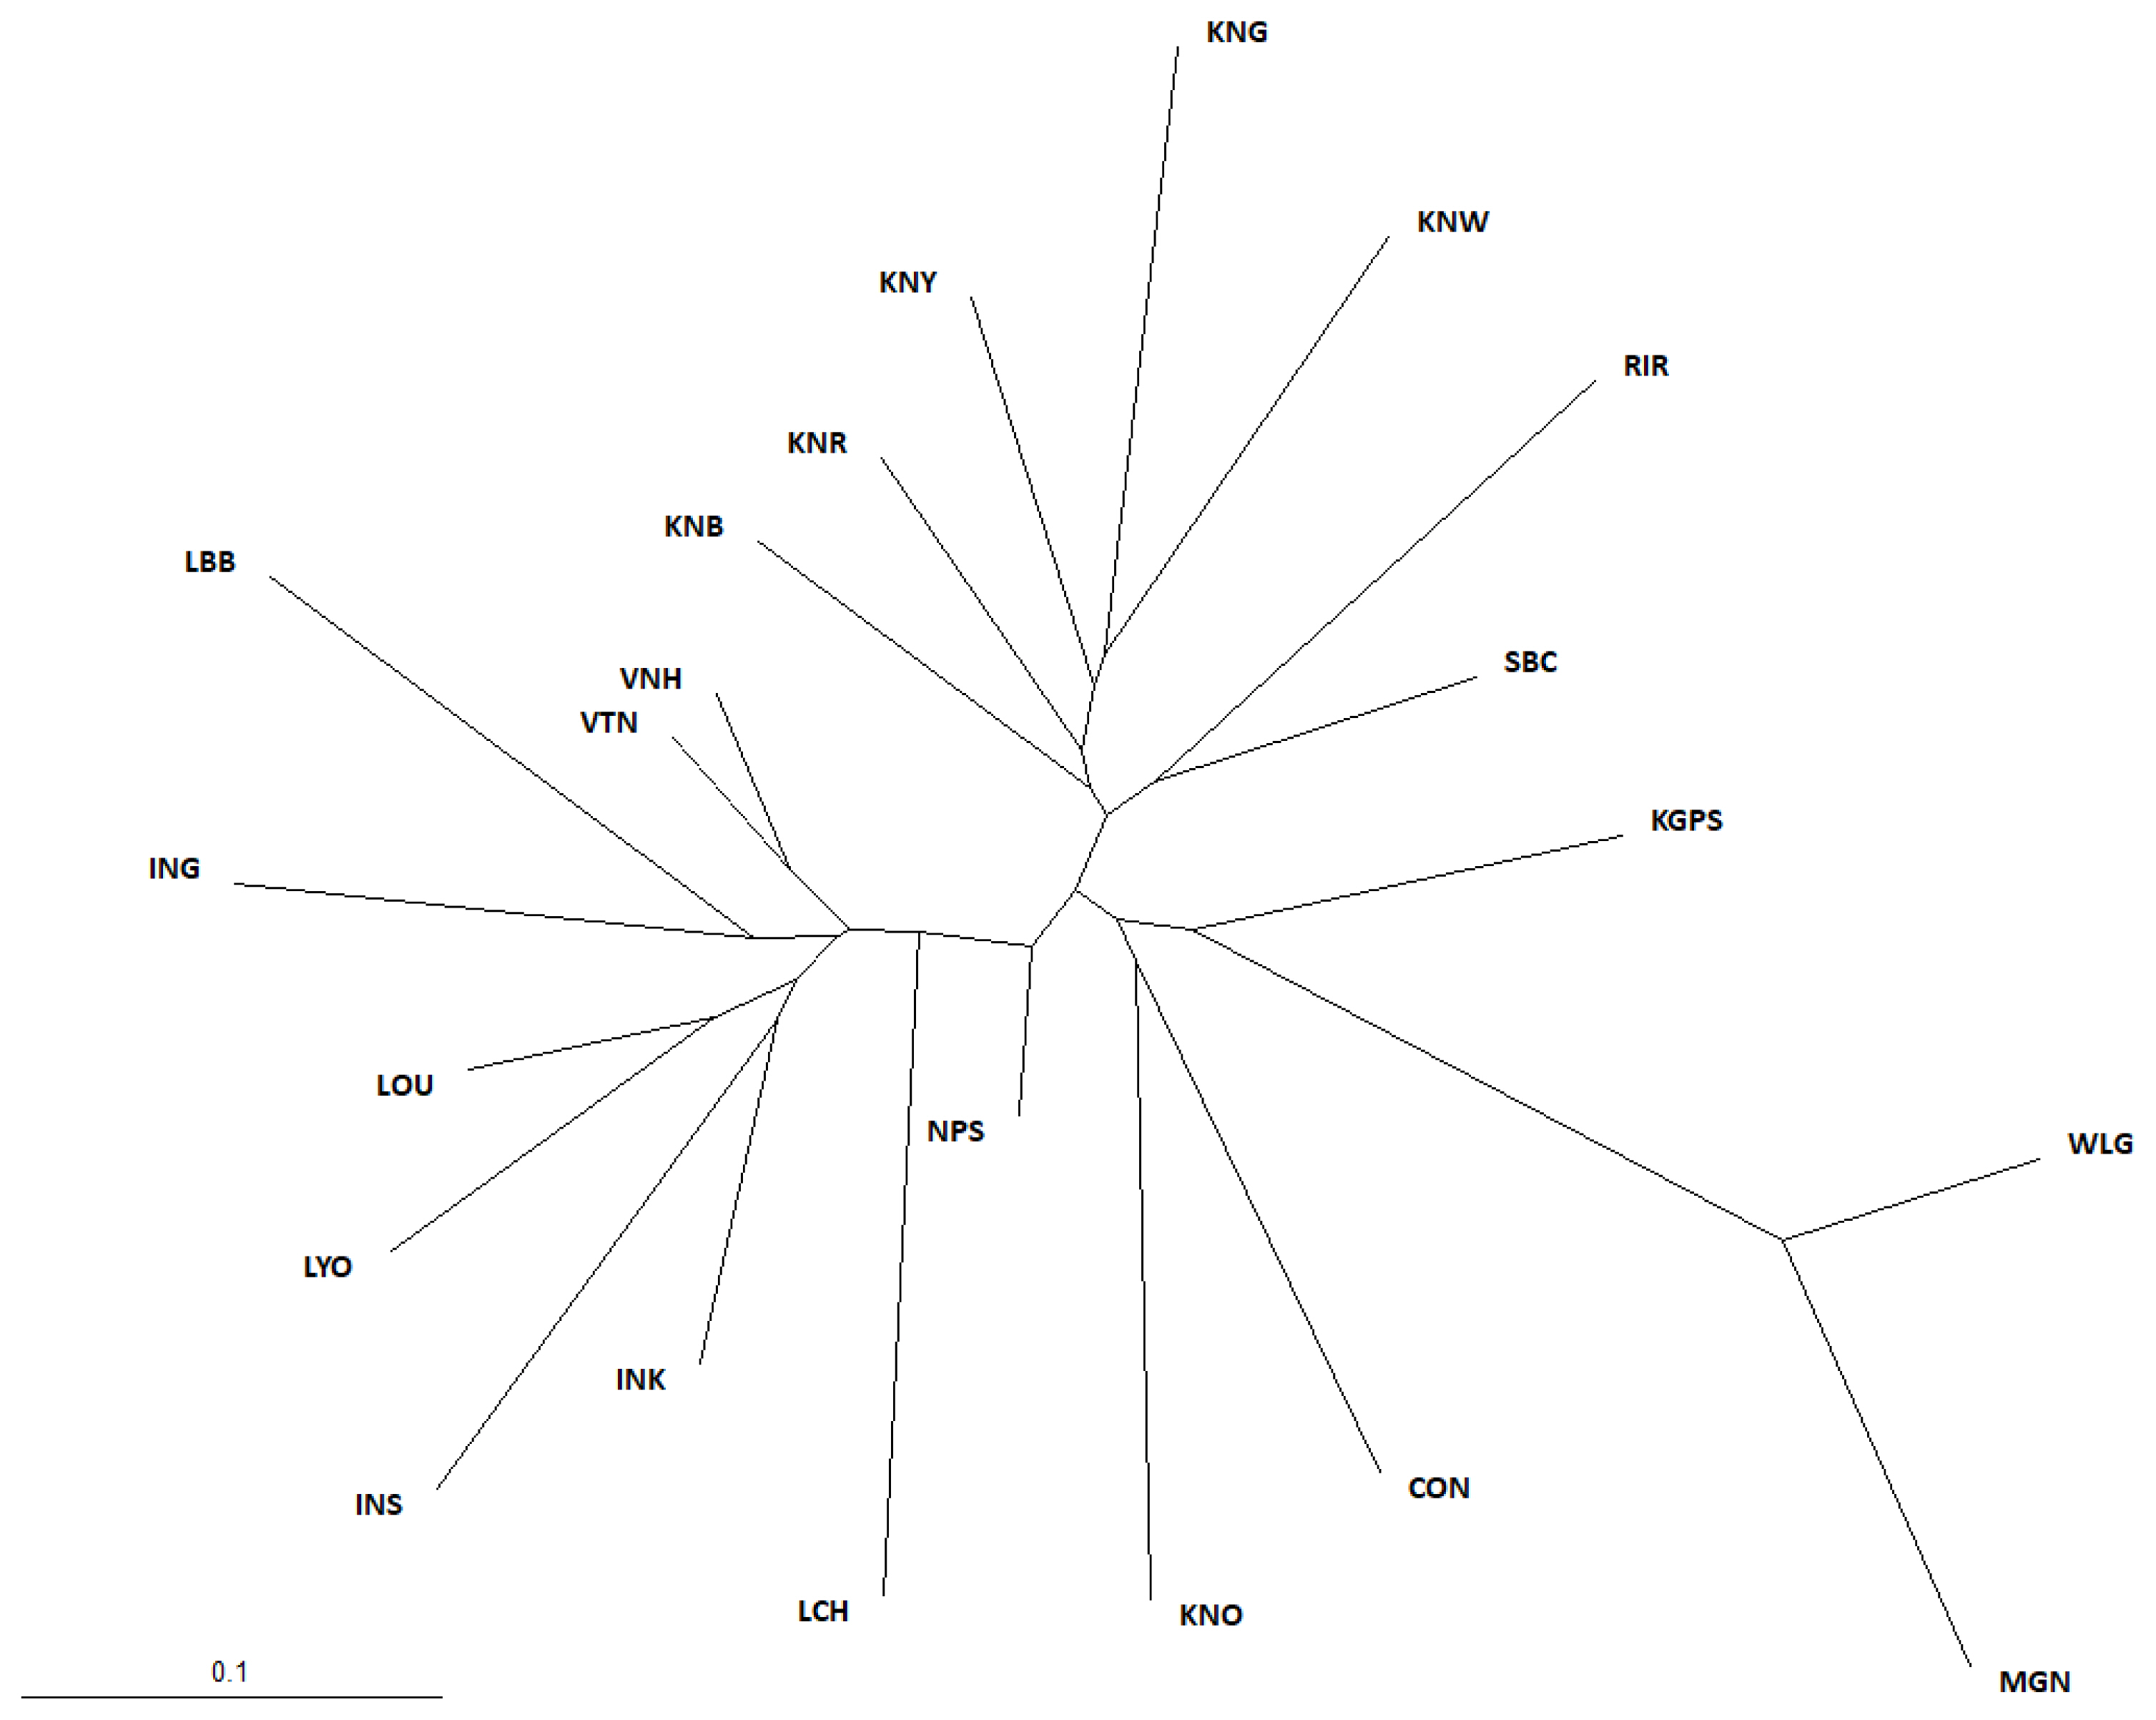
Neighbor-joining phylogenetic tree showing genetic relationships among 22 chicken breeds based on DA genetic distance. It showing the genetic relationships among 22 chicken breeds. RIR, Rhode Island Red; WLG, White Leghorn; CON, Cornish; KNG, Korean Grayish-brown; KNB, Korean Black; KNR, Korean Reddish-brown; KNW, Korean White; KNY, Korean Yellowish-brown; KNO, Korean Ogye; MGN, Mongolian Nuthiin bor; INK, Indonesian KUB; INS, Indonesian Sensi; ING, Indonesian Gaok; KGPS, Kyrzyzstani GPS-H; LYO, Laotian York; LCH, Lotian Chae; LBB, Laotian Black Bone; LOU, Latotian Ou; NPS, Nepalese Sakini; SBC, Sri Lankan Junglefowl.
Clustering and principal coordinate analysis
We conducted clustering analysis using Bayesian clustering, which provided more accurate estimates of relatedness of the breeds [39]. According to the STRUCTURE analysis the most probable number of inferred clusters and the K value (ΔK), was K = 20 (46.92). The genetic structures of each chicken breed (for K = 2, 4, 9, 14, and 20) were visualized using DISTRUCT (Figure 2). For K = 2, the KNC breeds (excepting KNO) and SBC were clustered with RIR, whereas the other Asian chicken breeds were clustered with WLG and CON. WLG and MGN were distinguished from the other breeds at K = 4. These two breeds were found to differ the most in terms of genetic composition, compared with the other breeds. Differentiation from the other breeds began for RIR and KGPS at K = 9, and for CON at K = 14. Based on the CLUMPP analysis at K = 20 (Supplementary Table C), 11 breeds (RIR, WLG, CON, KNG, KNB, KNR, KNW, KNY, KNO, KPGS, and LCH) were detected in independent cluster and each of these breeds occurred predominantly in one cluster (with more than 84% of its membership in one cluster). Moreover, MGN had 88.9% and WLG had 95.1% membership in cluster 18, and the genetic distances between them were short (0.193). It was difficult to distinguish between WLG and MGN, suggesting that MGN was derived from WLG. SBC was also detected independently in cluster 1, but with a relatively low proportion of membership (68.3%). The proportion of membership of the other breeds ranged from 25.3% to 79.5% in cluster 13 (LOU) and 17 (INS), respectively. Generally, the genetic uniformity of the imported breeds (RIR, WLG, CON) and KNC breeds was higher than that of the other Asian chicken breeds, except for MGN, KPGS, and LCH. This is probably because these Asian chicken breeds have not gone through genetic fixation processes via strong selection processes. It means they were crossbreed. If genetic uniformity is low, it is difficult to determine whether a breed is distinct from other breeds. Therefore, to increase genetic uniformity, as long as it does not reduce genetic diversity through planned breeding, these Asian chicken breeds should be selected according to their specific purposes.

Clustering assignment of the 22 chicken breeds obtained by STRUCTURE analysis. Each of the 469 chickens is represented by a thin vertical line, which is divided into colored segments which represent the proportional contribution of the inferred K = 4, 9, 14, 20 clusters. The populations are separated by thin vertical black lines. RIR, Rhode Island Red; WLG, White Leghorn; CON, Cornish; KNG, Korean Grayish-brown; KNB, Korean Black; KNR, Korean Reddish-brown; KNW, Korean White; KNY, Korean Yellowish-brown; KNO, Korean Ogye; MGN, Mongolian Nuthiin bor; INK, Indonesian KUB; INS, Indonesian Sensi; ING, Indonesian Gaok; KGPS, Kyrzyzstani GPS-H; LYO, Laotian York; LCH, Lotian Chae; LBB, Laotian Black Bone; LOU, Latotian Ou; NPS, Nepalese Sakini; SBC, Sri Lankan Junglefaowl.
To assess the relatedness of breeds, we carried out PCoA analysis using the allele frequencies of the 20 MS markers (Figure 3). These results were similar to those of our phylogenetic tree and structure analysis. The percentages in the label of each axis indicate the variance explained by the axis. Three axes explained 56.2% of the variance; the first two explained 19.17% and 18.92%, respectively, and the third axis explained 18.11%. Remarkably, on the first axis, the Laotian, Vietnamese, and Indonesian chicken breeds were clearly separated from the other breeds. In addition, WLG and MGN were completely isolated from the other breeds on the second axis, whereas the Asian chicken breeds were not clearly separated from each other on this axis. On the other hand, CON and KNO were separated from the other breeds on the third axis.

Principal coordinate analysis (PCoA) of allele frequencies from 20 microsatellite markers in 22 chicken breeds. The percentage of the variation explained by the plotted principal coordinates is indicated on the axes. RIR, Rhode Island Red; WLG, White Leghorn; CON, Cornish; KNG, Korean Grayish-brown; KNB, Korean Black; KNR, Korean Reddish-brown; KNW, Korean White; KNY, Korean Yellowish-brown; KNO, Korean Ogye; MGN, Mrtmiongolian Nuthiin bor; INK, Indonesian KUB; INS, Indonesian Sensi; ING, Indonesian Gaok; KGPS, Kyrzyzstani GPS-H; LYO, Laotian York; LCH, Lotian Chae; LBB, Laotian Black Bone; LOU, Latotian Ou; NPS, Nepalese Sakini; SBC, Sri Lankan Junglefowl; VTN, Vietnamese Ninh Hoa; VNH, Vietnamese Ninh Hoa.
In conclusion, the genetic diversity of the KNC and imported breeds was lower than that of the other Asian chicken breeds, whereas their genetic uniformity was higher, except in the MGN, KGPS, and LCH. Therefore, selection for the specific characteristics of Asian chicken breeds used in this study is necessary to increase their genetic uniformity. Moreover, estimating the genetic diversity between the 22 Asian chicken breeds is the first step in a strategic plan for the genetic characterization and conservation of these breeds. Although the sample size of some of the breeds was small, our findings are meaningful in that the study was conducted using various breeds from different countries. Additionally, this study may be useful as an initial guide for defining conservation objectives, for designing future investigations of genetic variation, and for developing conservation strategies for 22 Asian chicken breeds. However, further research is required to elucidate the specific reasons for the genetic differences between the Asian breeds and the native Korean and imported breeds.
Supplementary Information
Notes
CONFLICT OF INTEREST
We certify that there is no conflict of interest with any financial organization regarding the material discussed in the manuscript.
ACKNOWLEDGMENTS
This work was carried out with the support of the Asian Food & Agriculture Cooperation Initiative (AFACI) Animal Genetic Resources (AnGR) project “Improving Animal Genetic Resources Value and Productive Performance in Asia,” and the Production and Management of Livestock Genetic Resources Characteristic Information project (Project No. PJ 01098402) in Rural Development Administration, Republic of Korea.