The meat quality, muscle fiber characteristics and fatty acid profile in Jinjiang and F1 Simmental×Jinjiang yellow cattle
Article information

Abstract
Objective
This study compared the meat quality, muscle fiber characteristics, and fatty acids between Jinjiang yellow cattle (JJ) and F1 Simmental×Jinjiang yellow cattle (SJ) which were offered the same diet.
Methods
Six JJ and six SJ individuals were reared and fattened from 10 to 26 months of age. After feeding, the highrib (HR), ribeye (RB), and tenderloin (TL) samples were taken from the carcass for meat quality evaluations.
Results
The results showed that growth performance of SJ was higher than that of JJ (higher live weight and average daily gain), and the hot carcass weight of SJ was higher than that of JJ (p<0.05). pH of JJ was higher than that of SJ in TL (p<0.05); the color of a* of SJ was higher than that of JJ in TL and RB (p<0.05); the cooking loss of SJ was significantly lower than that of JJ in TL and RB (p<0.05); the shear force value was significantly lower in SJ compared to JJ (p<0.05); the muscle fiber diameter was higher and the fiber density was lower in SJ compared to JJ in HR and TL (p<0.05); compared to SJ, the muscles of JJ had higher saturated fatty acid (SFA) composition; the sum of monounsaturated fatty acid and polyunsaturated fatty acid (PUFA) were lower in the muscle of JJ; the mRNA expressions of myosin heavy chain-I (MyHC-I) and MyHC-IIa were higher in SJ compared to JJ in muscle of HR and RB; the mRNA expressions of MyHC-IIx and MyHC-IIb were lower in SJ compared to JJ in HR and RB (p<0.05).
Conclusion
Meat quality and fatty acid profile differed between SJ and JJ; the muscle of SJ had higher a* and SFA; SJ had lower cooking loss, shear force and PUFA compared to the muscle of JJ. In addition, the type and development characteristics of the muscle fiber had some difference between SJ and JJ; these might be factors which caused the differences in meat quality and fatty acid profile between SJ and JJ.
INTRODUCTION
Current beef production has to meet the growing consumers’ demands for high quality beef, while concurrently increasing the resource efficiency. Meat quality is influenced by several factors. Milićević et al [1] found that the fatty acid profiles could affect the overall acceptability of meat; as well as influence several meat quality parameters, such as softness, hardness, oxidation stability, color and flavor. In addition, muscle fiber development is also known to have an important impact on the meat quality. Although the total number of skeletal muscle fibers is fixed in animals before birth [2], the composition of muscle fiber types varies during the life of an animal to adapt to different physiological requirements [3]. The contractile properties depend primarily on myosin heavy-chain isoforms (MyHCs) present within the thick filaments. In most mature mammalian skeletal striated muscles, four types of MyHC are expressed: I, IIa, IIx, and IIb [4]. The muscle fiber composition could influence the technological quality of meat, such as water-holding capacity and muscle pH. Kim [5] indicated that the pH at 45 min is much lower in pork Psoas major muscle (27% I fibers) than in the Longissimus muscle (10% I fibers), the type of muscle fiber composition had major effects on the muscle pH. Fatty acid compositions, as well as muscle fiber development, are affected together by many other factors, such as feeding conditions, the age of animals and especially the breed of animals [6].
In China, there are several local breeds (Yellow Cattle), such as Luxi, Qinchuan, Jinnan, Xiangxi, and Jinjiang; to improve the growth performance and meat quality, China has imported some high productivity cattle breeds such as Limousin and Simmental from other countries [7]. Zhou et al [8] reported that crossbreeding could significantly improve the yellow cattle meat productivity. Jinjiang yellow cattle (JJ) are a breed of Chinese indigenous yellow cattle that are bred in the northwest of the Jiangxi Province. To meet the current market demands, steps to increase beef quality and quantity have been introduced, such as crossing superior foreign breeds with native breeds. Here we aim to use crossing to improve the growth performance and meat quality of JJ. The objective of this study was to compare the growth performance and meat quality in JJ and F1 Simmental×Jinjiang yellow cattle (SJ). Special attention was paid to the differences in fatty acid profile, muscle fiber characteristics and meat quality between Jinjiang and SJ.
MATERIALS AND METHODS
Ethics statement
The care and use of animals followed Animal Research Institute Committee guidelines of Nanjing Agriculture University, China. This study has been approved by the Committee of the Animal Research Institute of Nanjing Agriculture University, China (SYXK2011-0036).
Animals and samples
The experiment was carried out in National Beef Cattle Industrial Technology System of China–Jiangxi Station. Six JJ and six SJ (10 months of age) were weaned. After 16 months of feeding, the animals were reared and fattened under the same conditions. The grain-fed cattle were kept in a pen with group feeding using the standard feeding system for cattle production. All the beef cattle were provided feed and water ad libitum. In brief, the cattle were fed twice daily on a calculated starting diet. All the cattle had permanent access to water and mineral salt blocks, which contained minerals, salt, and a diuretic. Table 1 lists the ingredients and chemical compositions of the basal finishing diets.

Ingredients and chemical compositions of the basal finishing diets
The ribeye (RB, the muscle between the 5th and 7th rib), high rib (HR, the muscle between the 8th and 10th rib) and tenderloin (TL, the muscle between the 3rd and 4th lumbar vertebrae) were cut and taken at the last rib of the left carcass, followed by immediate freezing in liquid nitrogen for fatty acid and the RNA expressions analyses. The RB, HR, and TL muscles are regarded as top grade cuts of the meat in the Chinese markets. The carcasses were placed in a chiller at 4°C and aged for 48 h, and then transported to the Jiangsu Collaborative Innovation Center of Meat Production and Processing, Quality and Safety Control, Nanjing Agricultural University for the meat quality analysis.
Growth performance and carcass traits
The initial and final body weights and feed consumption per pen were recorded on the 10th and 26th months of the experiment to calculate average daily weight gain (ADG), average daily dry matter intake (DMI), F/G = DMI/ADG. The dry matter intake was recorded every 2 week to calculate the average DMI. After 12-h fast, 12 cattle (six per treatment) were weighed and transported (approximately 30 min) to the slaughter house. The cattle were electrically stunned, exsanguinated, scalded, depilated, labeled, eviscerated and cut down accurately from the midline. The hot carcass weight (excluding the head, feet, tail and offal, but including the leaf fat and kidney) of individual cattle was recorded directly on the assembly line, to calculate the carcass yield (= hot carcass weight/live weight×100%) before the carcasses were sent to the chilling room (4°C). Table 2 lists the growth performance and carcass data.
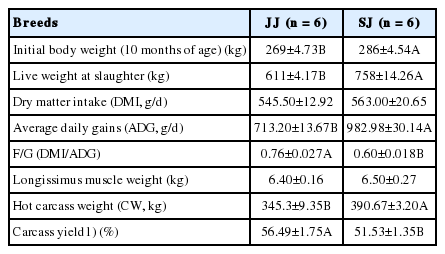
Growth performance and carcass data of Jinjiang (JJ) and F1 Simmental×Jinjiang (SJ) yellow cattle at slaughter (26 months of age)
pH determination
pH values at 24 h (pH 24h) postmortem were measured by using a HI9125 portable water proof pH/oxidation reduction potential meter (HANNA Instruments, Cluj-Napoca, Romania) [9]. Using a scalpel, small incisions were made in the samples. A pH probe was inserted into the incision and the reading was recorded. The pH electrode was calibrated with buffers of pH 4.01 and 7.00 before testing and compensated at a temperature of 20°C together with the samples. Each sample was measured 3 times at different points and the average value was used.
Color determination
Instrumental color determination performed with the Commission Internationale de l’Eclairage L*a*b* system using a colorimeter (CR400, Konica Minolta Sensing, Inc., Osaka, Japan; calibrated with a white plate) on a fresh cut surface of the samples after blooming in air in daylight at a temperature of 20°C for approximately 20 min. The aperture of the color meter was placed vertically on the surface of samples and the L* (lightness), a* (redness/greenness), and b* (yellowness/blueness) values used were recorded. Each sample was measured 3 times at different points and the average value was used.
Cooking loss determination
Cooking loss was measured after respective treatments following Xia et al [10]. A sample (approximately 50 g weight) was cut perpendicular to the direction of the muscle fibers from each muscle. Meanwhile, the actual weight was also recorded (W1). The samples were packaged and sealed in a boilable bag and placed in an 80°C water bath until the core temperature reached 75°C. The meat pieces were then removed and cooled to room temperature, after wiping the surface with filter paper, the weight was recorded (W2), and cooking loss was calculated using the following equation:
Shear force determination
Meat tenderness was determined using cooking-loss samples. Shear force was evaluated by the method described by Baublits et al [11]. After the cooking loss measurement, each sample was cut parallel to the direction of the muscle fibers into three cuboidal strips (1 cm×1 cm×3 cm). Each core was sheared perpendicular to the direction of muscle fiber with a Digital Meat Tenderness Instrument (model C-LM3B, Northeast Agricultural University, Harbin, China; probe model XL1155). The peak of the shear force was recorded and regarded as the shear force value. The results are shown in Newton (N).
Muscle fiber diameter and fiber density measurement
Samples with dimensions of 5 mm×5 mm×10 mm were cut out, parallel to the muscle fiber direction. We fixed the sample in 4% paraformaldehyde and processed them to be embedded into paraffin wax using a routine protocol. The slides were for stained with haematoxylin and eosin. The measurement point was randomly selected from each photo graph and the muscle fiber diameter (μm) was determined using the Image-Pro plus 6.0 software (Media Cybernetics, Bethesda, Silver Spring, MD, USA). Muscle fiber density = number of muscle fibers/area selected.
Fatty acid analysis
Tissue samples were kept at −70°C until fatty acid analysis, to limit the fatty acid degradation. The samples were thawed in an ice water bath for <1 h. As per a protocol modified from Folch, Lees, and Sloane-Stanley [12], the total lipids were extracted from the muscle with chloroform/methanol (2:1, v/v) by homogenization (Ultra Turrax, 3×15 s, 12,000 revolutions per minute) at room temperature. All solvents contained 0.005% (w/v) of t-butylhy droxytoluene in order to avoid the oxidation of polyunsaturated fatty acids (PUFA). The extraction mixture was stored at 5°C for 18 h in the dark and subsequently washed with 0.02% aqueous CaCl2. The organic phase was dried with Na2SO4 and K2CO3 (10:1, wt/wt) and the solvent was subsequently removed under nitrogen at room temperature. The lipid extract was re-dissolved in toluene and a 25-mg was used for methyl ester preparation. After 20 min an aliquot of chloroform was added to yield a solvent ratio of 2:1 v/v. Fatty acid methyl esters (FAME) were prepared. FAME was separated by capillary gas chromatography on a Cp-Sil 88 fused-silica capillary column (100 m×0.25 mm×0.25 μm), Varian-Chrompack GmbH (Beijing, China).
mRNA expression analysis
Total RNA was treated with DNase I (Takara Biotechnology Co. Ltd., Dalian, China) to remove DNA and reverse transcribed to cDNA (10 μL reaction system for maximum use of 500 ng of total RNA) using a PrimeScript RT Master Mix kit (Takara Biotechnology Co. Ltd., China), according to the manufacturer’s instructions. Real-time polymerase chain reaction (PCR) was carried out in optical 96-well plates on an ABI 7500 Real-Time PCR System (Applied Biosystems, Foster City, CA, USA) using SYBR Premix Ex Taq Kits (Takara Biotechnology Co. Ltd., China). Primers used for real-time PCR are presented in Table 3 and were synthesized by Invitrogen. Glyceraldehyde-3-phosphate dehydrogenase amplification was performed for each sample to normalize the expression of the selected genes. Relative gene expression was calculated using the 2−ΔΔCt method, as described by Livak and Schmittgen [13].

Primer sequences used in quantitative polymerase chain reaction
Statistical analysis
Statistical analysis was performed using SPSS 20.0 statistical software. Student’s t-test was used to detect the significant differences between individual means in the two kinds of breed beef cattle, (at a significance level of p<0.05). All the values are reported as means±standard error for each treatment. Different superscript capital letters (A, B) denotes significant differences between the breeds within a same tissue.
RESULTS AND DISCUSSION
Growth performance and carcass data for Jinjiang and F1 Simmental×Jinjiang yellow cattle
Growth performance and carcass data of JJ and SJ are listed in Table 2. The growth performance and carcass characteristics of the meat were significantly influenced by the breed. The ADG, hot carcass weight and carcass yield (%) were higher in SJ, and the DMI was lower in SJ compared to JJ (p<0.05). This indicated that crossbreeding could improve the production performance, and promote the economic benefits of beef cattle feeding.
Determination of pH, color, cooking loss, shear force value, and muscle fiber diameter and density
As shown in Table 4, the pH of TL in JJ was higher than that in SJ (p<0.05). The results showed that the L* and b* had no differences in HR, TL, and RB between JS and SJ (p>0.05); the color of a* for TL and RB in SJ was higher than in JJ (p<0.05). In addition, the results showed that the cooking loss in TL and RB was significantly lower for SJ, compared to JJ (p<0.05). The shear force value was significantly lower in HR, TL, and RB of SJ, compared to JJ (p<0.05).
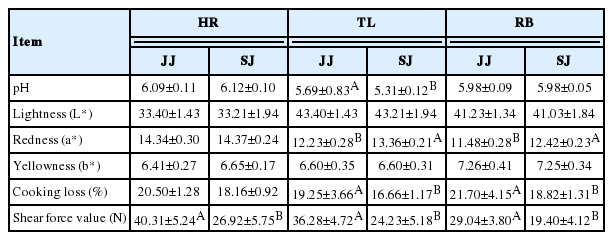
The pH, meat color, cooking loss, and shear force of Jinjiang (JJ) and F1 Simmental×Jinjiang (SJ) cattle
pH is one of the most important indicators of meat quality [14]; It can directly reflect the size of the fast rate of muscle glycogen glycolysis. When animals are slaughtered, the muscle glycogen is subjected to anaerobic metabolism, and lactic acid is produced [15], the faster muscle glycogen degrades the more lactic acid produced. The pH of TL in SJ was lower than that in JJ, indicating that, after slaughter, the TL of JJ produced higher amounts of lactic acid, compared to SJ. pH can also affect meat tenderness; pH of 5.4 to 5.8 is indicative of normal, tender meat, pH of 5.8 to 6.2 indicates inconsistently tender meat (moderate dark firm dry [DFD]), and pH>6.2 reflects tender meat with microbial spoilage (DFD meat) [16]. Therefore, the meat observed in the present study can be considered as normal. The meat of TL was more tender than that of HR and RB in JJ and SJ.
Meat color is a dominant factor that affects meat purchasing decisions, because the consumers prefer to use the color as an indicator of freshness and wholesomeness [17]. Our results showed that the a* in SJ was higher than that in JJ, Pigment content and oxidation state accounted for much of the variation in a* value [17], and cooking loss of SJ was significantly lower than that of JJ in TL and RB. This indicates that after crossbreeding with Simmental cattle, the TL and RB muscle of SJ might have relatively good water holding capacity.
A previous study [18] on the relationship between meat quality and muscle fiber characteristics found a negative correlation between the shear force value and the muscle fiber diameter. The results of muscle fiber diameter and density are presented in Figure 1. As shown in Table 5, the muscle fiber diameter was higher and the fiber density in the HR and TL of SJ were lower compared to JJ (p<0.05). The main factors affecting the meat tenderness included muscle fiber diameter and density; in addition, the fat content and connective tissue of muscle were also important factors. The present study showed that the muscle fiber diameter of SJ was higher than that of JJ, and the shear force value and the muscle fiber density were lower than those of JJ. It indicated that the muscle of SJ had a better tenderness than that of JJ.
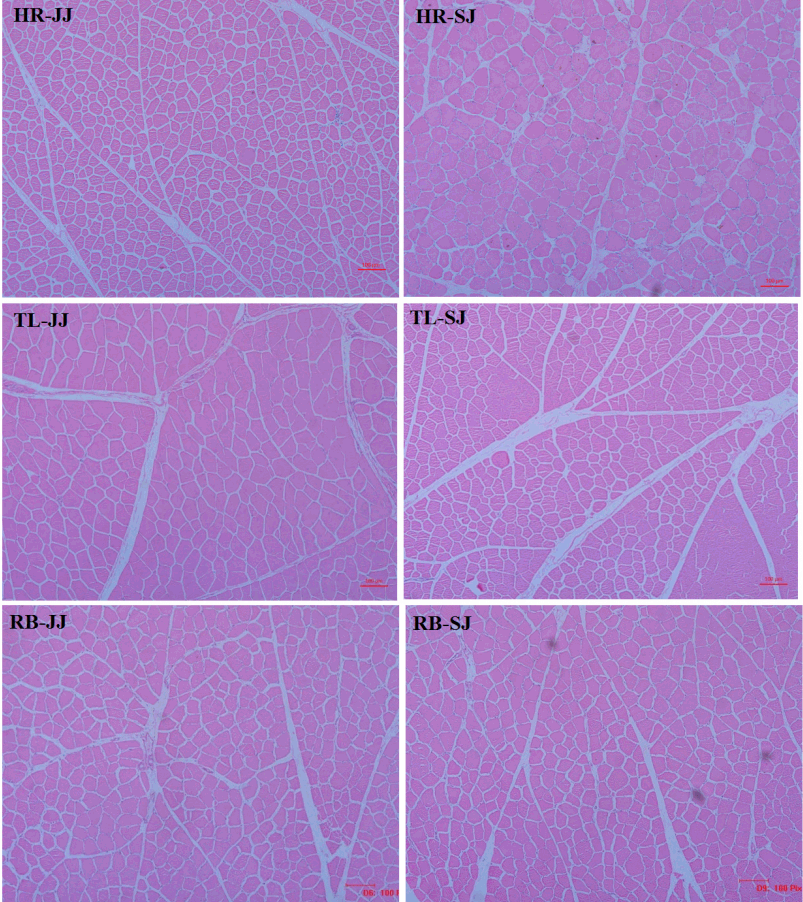
The slice observation haematoxylin and eosin (HE) staining of the muscle in Jinjiang (JJ) and F1 Simmental×Jinjiang (SJ) yellow cattle (10×40 objective view). HR, highrib; TL, tenderloin; RB, ribeye.
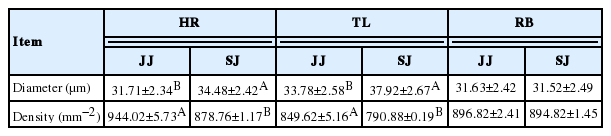
The muscle fiber characteristics of between of Jinjiang (JJ) and F1 Simmental×Jinjiang (SJ) yellow cattle
Fatty acid analysis
Table 6 summarizes the fatty acid compositions in the muscle of JJ and SJ. The relative amount of C18:0 as well as the sum of saturated fatty acid (SFA) were lower in SJ (p<0.05). The relative amounts of C18:1cis-9 and the sum of monounsaturated fatty acid (MUFA) in the RB of SJ were higher compared to JJ (p<0.05). The sum of PUFA in the muscle of SJ was higher compared with the JJ (p<0.05).

Fatty acid composition (g/100 g) of Jinjiang (JJ) and F1 Simmental×Jinjiang (SJ) yellow cattle
The main composition of fatty acids is an important flavor precursor of meat, closely associated with its edible value and commodity value. The composition and content of fatty acid has important influence on the consumption of nutritional value. Stearic acid (C18:0), with a high melting point being the primary reason for fat hardness [19], and the fatty acid contributed to the softness of fat in the steer, such as oleic acid (C18:1cis-9) [20]. Higher deposition of lipids in muscle correlated with higher oleic acid content, which can improve the sensory quality [21,22]. A previous study reported that the oxidation of SFA induce volatile substances, which provide aroma and flavor, and the unsaturated fatty acids (UFA) can improve meat flavor [23]. Another study [24] showed that SFA and MUFA are proportional to the meat flavor in pork, and the PUFA is inversely proportional to the flavor of meat. Other studies [25] reported that the SFA content is high and the PUFA content is low in the meat with high intramuscular fat (IMF).
Our results show that the sum of SFA was lower and the sum of MUFA and PUFA were higher in the muscles of SJ, compared to JJ. A previous study [26] showed that the n-3/n-6 ratio was inversely proportional to the content of IMF. Another study [27] also indicated that the content of MUFA was proportional to the IMF content and the quality of the meat. According to the result of our experiment, the n-6/n-3 ratio in the muscle of RB in JJ is higher than SJ, which could be due to the fact that the muscles of JJ had higher IMF, compared to SJ. It has been reported [28] that the UFA have a certain protective effect against the cardiovascular disease, and could delay the occurrence of atherosclerosis disease. Our research results show that the muscle of SJ had a relatively higher PUFA compared to JJ, which might be an advantage for SJ.
MyHC isoform genes expressions
As shown in Figure 2, the mRNA expressions of MyHC-I and MyHC-IIa were higher in the HR and RB of SJ, than in the muscle of JJ (p<0.05). The mRNA expressions of MyHC-IIx and MyHC-IIb were lower in the HR and RB of SJ, than in JJ (p<0.05). There was no significant difference in TL between JJ and SJ (p>0.05).
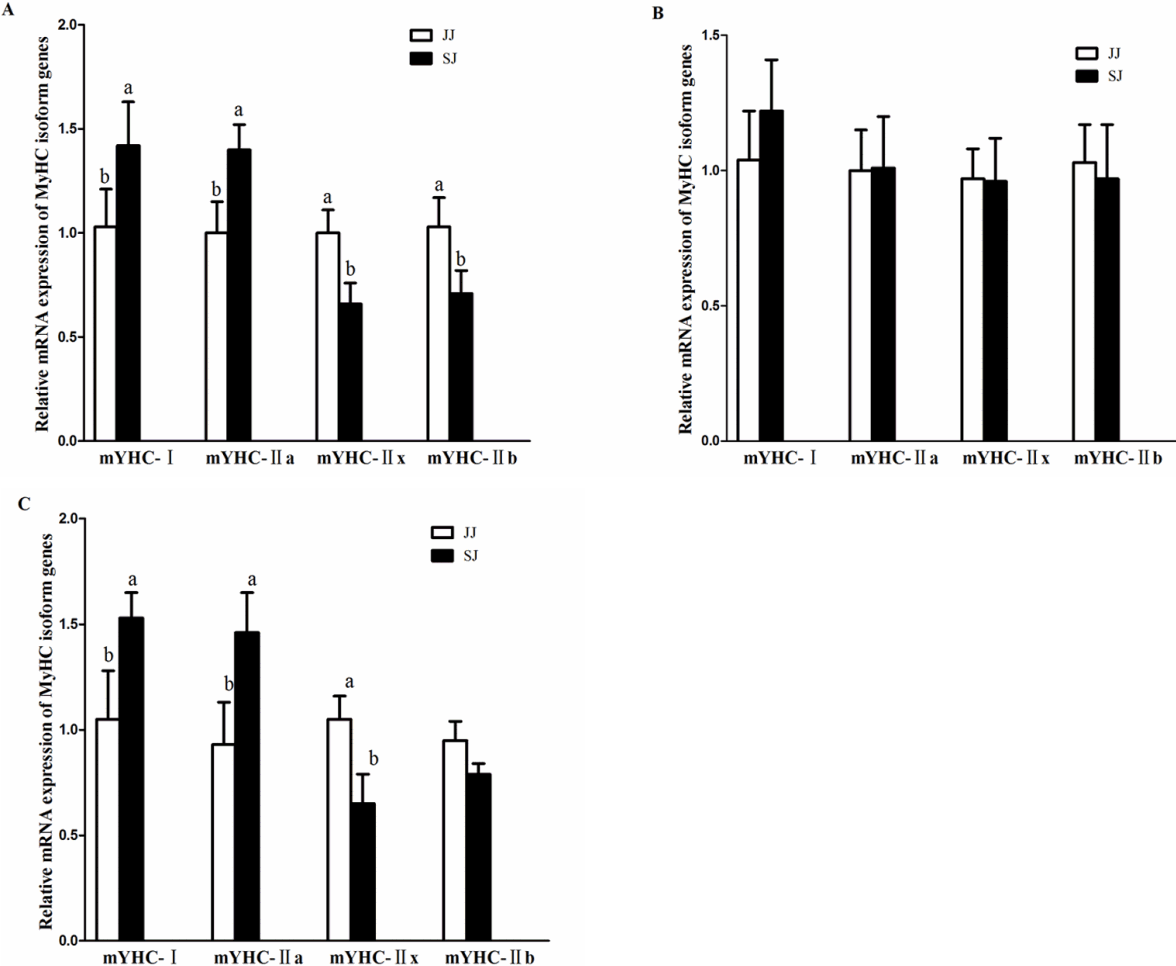
Relative mRNA expressions of myosin heavy-chain (MyHC) isoform genes in the muscles of Jinjiang (JJ) and F1 Simmental×Jinjiang (SJ) yellow cattle. (A) the muscle of HR; (B) the muscle of TL; (C) the muscle of RB. mRNA expression was normalized to glyceraldehyde-3-phosphate dehydrogenase gene expression. Data were shown as the mean±standard error of six replicates. a,b Mean values within different letters were significantly different (p<0.05). HR, highrib; TL, tenderloin; RB, ribeye.
A previous study [29] on the relationship between meat qual ity and muscle fiber properties revealed that the numbers of type I and type II fibers were closely related to the meat color and cooking loss. In our study, the mRNA expressions of MyHC-I and MyHC-IIa were higher in the HR and RB of SJ, than in the muscles of JJ, and the cooking loss of SJ was significantly lower than the JJ in TL and RB, indicating that the numbers of type I and type II fibers increased in the muscles of SJ after crossbreeding. A previous study showed that the greater the type I muscle fiber content, better is the meat quality; in addition, the greater the type II muscle fibers, higher is shear force of the meat [30]. The results in the present study showed a similar trend, such that shear force value of SJ was significantly lower than that of JJ, and the MyHC isoform genes expressions results showed that the mRNA expressions of MyHC-IIx and MyHC-IIb were lower in the HR ad RB muscle of SJ, than those of JJ. It has been indicated that the red muscle (MyHC-I, IIa) has a higher content of oxidative enzymes and mitochondria than the white muscle (MyHC-IIx, IIb).
In the present study, although SJ breed had higher expressions of MyHC-I and IIa in HR and TL, compared to the JJ, there was no significant differences in RB compared to that of JJ breed, although both cattle breeds had relative low watering holding capacity values. Taken together, the results suggest that crossbreeding the JJ with Simmental cattle could improve the ratio of red muscle to a certain extent.
CONCLUSION
Fatty acid composition and meat quality of JJ and SJ were examined. Differences were observed between SJ and JJ; the muscles of SJ had a higher a-value and SFA concentrations, and had lower cooking loss, shear force and lower PUFA concentrations, compared to the muscles of JJ. The differences might be due to the increase in muscle fiber diameter, a decrease in muscle fiber density and the different mRNA expressions of MyHC family genes in the muscles of SJ and JJ.
ACKNOWLEDGMENTS
Zheng Yue benefited from the National Key R&D Plan (grant number 2016YFD0500508) for funding this work. We are grateful to the Jiangsu Collaborative Innovation Center of Meat Production and Processing for the test of meat quality. In addition, we are grateful to Dr Ron Tume (CSIRO, Australia) for language improvement of the manuscript.
Notes
CONFLICT OF INTEREST
We certify that there is no conflict of interest with any financial organization regarding the material discussed in the manuscript.