Effect of rapeseed meal supplementation to gestation diet on reproductive performance, blood profiles and milk composition of sows
Article information
Abstract
Objective
This experiment evaluated the effect of dietary supplementation levels of rapeseed meal (RSM) in gestation diets on reproductive performance, blood profiles, milk composition of sows, and growth of their progeny.
Methods
A total of 55 mixed-parity sows (Yorkshire×Landrace; average parity = 3.82) with an initial body weight (BW) of 193.0 kg were used in this experiment. Sows were allotted to one of 5 treatments at breeding based on BW and backfat thickness in a completely randomized design. Treatments consisted of dietary RSM supplementation levels (0%, 3%, 6%, 9%, and 12%) in gestation diets. During lactation all sows were fed a common lactation diet with no RSM supplementation.
Results
Body weight, backfat thickness, litter size, lactation feed intake, and milk composition of sows, and growth of their progeny were not different among dietary treatments. In blood profiles, a quadratic increase (Quadratic, p<0.05) in serum triiodothyronine (T3) concentration and a linear increase (Linear, p<0.01) in serum thyroxine (T4) concentration were observed at d 110 of gestation as dietary RSM supplementation levels increased. However, serum T3 and T4 concentrations in lactating sows and their piglets were not affected by RSM supplementation of gestation diets. Concentrations of serum total cholesterol and low density lipoprotein cholesterol in sows were not influenced by dietary treatments, whereas serum glucose level in sows decreased linearly at d 110 of gestation (Linear, p<0.05) by increasing dietary RSM supplementation in gestation diets.
Conclusion
The RSM could be supplemented to gestation diets up to 12% with no detrimental effects on reproductive performance and growth of their progeny. However, increasing supplementation levels of RSM in gestation diets may increase serum T3 and T4 concentrations and decrease serum glucose concentration of sows in late gestation.
INTRODUCTION
Rapeseed meal (RSM) is a by-product of oil extraction from rapeseed and contains 33% to 40% of protein [1,2], which is one of the cost-effective protein sources for pig diets [3]. Compared with soybean meal (SBM), RSM has lower lysine (6.0% vs 6.2% of protein) but greater methionine (1.8% vs 1.4% of protein) content [1]. Furthermore, because RSM has higher content of crude fiber (12.4% vs 6.1%) than SBM, it could be supplemented in gestation diets to increase dietary fiber content for gestating sows [1]. However, limited amount of RSM has been used in sow diets because of anti-nutritional factors in RSM such as glucosinolates (Gls) and erucic acid [4]. So, generally RSM supplementation is limited up to 3% in breeding sow diets [5].
Halkier and Gershenzon [6] reported that Gls hydrolysis products are mainly toxic. Their degradation products such as isothiocyanates, thiocyanates, oxazolidinethiones, and nitriles reduce lactation feed intake of sows [3], and interfere with iodine uptake and synthesis of the thyroid hormones [7]. In addition, Gls are associated with a poor performance in reproduction such as delayed sexual maturity, decrease of embryo survival rates, low conception rate and fetal survival rates [3,8]. In the case of erucic acid, high intake is also toxic, and may cause heart damage and lipidosis in cardiac tissues [9] because it is poorly oxidized by mitochondrial β-oxidation system [10]. Therefore, the objective of the present study was to evaluate the effect of dietary supplementation levels of RSM on reproductive performance, blood profiles and milk composition of sows and performance of their progeny.
MATERIALS AND METHODS
Animals and diets
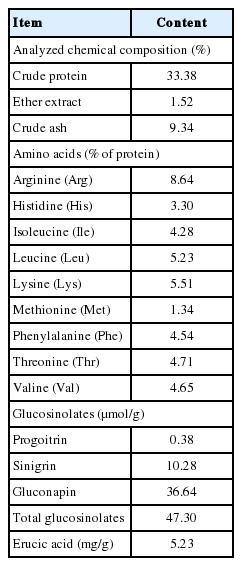
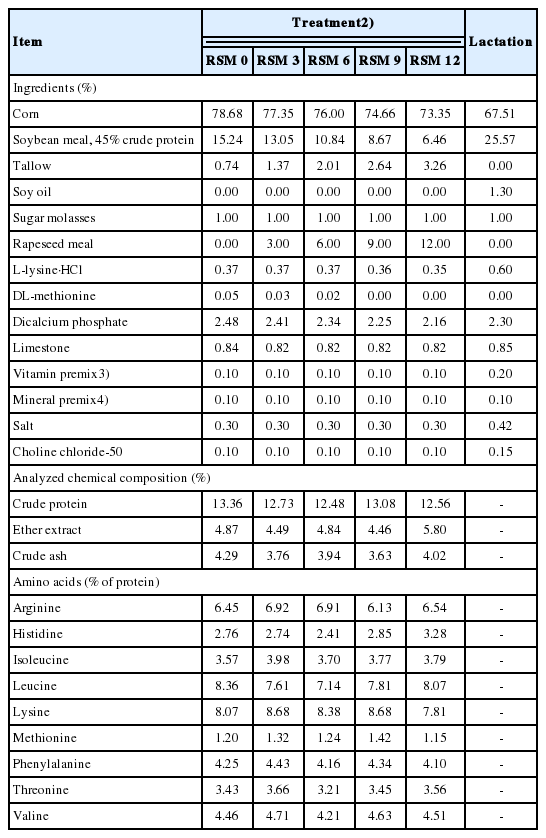
A total of 55 mixed-parity sows (Yorkshire×Landrace, average parity 3.82) with an initial body weight (BW) of 193.0 kg were allotted to 1 of 5 dietary treatments in a completely randomized design. All sows were artificially inseminated (Darby AI center, Choongju, Korea) by 3 times at 12 h interval. Rapeseed meal (Brassica. Juncea) was an imported from India. Brassica. Juncea had high content of gluconapin (36.64 μmol/g) in RSM and gluconapin represented approximately 77% of total Gls in this study (Table 1). Five experimental diets containing different levels of RSM (0%, 3%, 6%, 9%, and 12%) were provided to sows during gestation. During lactation all sows were fed a common diet without RSM supplementation after farrowing regardless of the gestation treatments. Each diet in gestation contained 3,265 kcal of metabolizable energy (ME)/kg, 12.9% of crude protein (CP), 0.74% of total lysine and the assigned levels of RSM, respectively. Rapeseed meal was supplemented to the diets with replacement of corn, SBM, and tallow (Table 2). The lactation diet contained 3,269 kcal of ME/kg, 16.8% of CP and 1.09% of total lysine. All nutrients met or exceeded NRC [11] nutrient requirement estimates. The formula and chemical composition of experimental diets were presented in Table 2.
Housing and management
Gestating sows were housed in individual stalls (2.40×0.64 m), which were installed on concrete floor in a temperature-controlled room with automatic fans and individually fed a total of 2.4 kg/d divided equally to two meals at 08:00 and 16:00 during the entire gestation period. Pregnancy of sows was confirmed on d 35 after mating via ultrasound (Eagle scan, Dong Jin BLS Co, LTD, Sungnam, Korea). After d 110 of gestation, all sows were moved into individual farrowing crates (2.5×1.8 m) and housed until weaning.
After parturition, a common lactation diet was provided to all sows and gradually increased from 1 kg/d by 0.5 kg/d until 5 day postpartum with a free access to water. From 5 day postpartum, feed and water were provided ad libitum to sows. Within 24 h postpartum, Fe-dextran (150 ppm) injection, ear notching, needle teeth clipping and tail docking were performed on each piglet. Piglets were cross-fostered across treatments within 3 days after birth to balance suckling intensity across sows with equalization of litter size, thus to minimize any impact of initial litter size potentially affecting litter growth.
Feeding trial
Body weight and backfat thickness of sows were measured at mating, d 110 of gestation, 24 h postpartum and d 21 of lactation. An ultra-sound device (Lean-meter, Renco Corp., Minneapolis, ME, USA) was used for measuring backfat thickness at P2 position (mean value from both side of the last rib and 65 mm away from the backbone). The number of total born and born alive were recorded within 24 h postpartum and the number of pigs was recorded after cross-fostering and at 21 d of lactation. Lactation feed intake was recorded weekly. Piglet weight was recorded at 24 h postpartum, after cross-fostering and at 21 day of lactation. Litter weight was calculated by summing the individual piglet weights. Weaning to estrus interval (WEI) was determined by monitoring for estrus from 3 to 10 day after weaning.
Blood profiles
For the initial level, blood samples were randomly taken from 13 sows immediately before mating. Colostrum, milk and blood samples were collected from 5 sows with 7 to 12 piglets from each treatment and 5 piglets (one piglet from one sow) were used to collect blood. Blood samples were collected from sows through jugular vein into serum separation tubes at d 110 of gestation as well as 24 h and 21 d postpartum and from nursing piglets through anterior vena cava at 24 h and 21 d after birth. Blood samples were centrifuged at 1,700 g at 4°C for 15 min (Eppendorf centrifuge 5810R, Hamburg, Germany) to separate serum. Serum triiodothyronine (T3) and thyroxine (T4) concentrations were measured by electrochemiluminescence immunoassay (T3 and T4 Kits, Roche, Mannheim, Germany). Serum total cholesterol, low density lipoprotein (LDL) cholesterol and high density lipoprotein (HDL) cholesterol concentrations were analyzed using enzymatic colorimetric assay (Cholesterol Kit; LDL-C plus 2nd generation Kit; HDL-C plus 3nd generation Kit, Roche, Germany). Serum glucose and blood urea nitrogen (BUN) concentrations were analyzed using a kinetic UV assay (Glucose Hexokinase Kit; UREA/BUN Kit, Roche, Germany).
Milk composition
Colostrum and milk were collected from the first and second teats at 24 h and 21 d postpartum after an intravascular injection with 5 IU oxytocin (Komi oxytocin inj. Komipharm International Co., Ltd., Siheung, Korea) in the ear. All samples were stored at −20°C until analysis.
Feed analysis
Rapeseed meal and experimental diets were analyzed for CP (976.05), ether extract (920.39, and crude ash (942.05) by AOAC [12]. Proximate analysis of colostrum and milk was conducted using Milkoscan FT 120 (FOSS Electric, Sungnam, Korea). Amino acid content in RSM was carried out according to Moore [13] and AccQ-Tag regent kits were used (Waters, Milford, MA, USA). Performic acid was used in oxidizing amino acids and neutralized with sodium citrate dihydrate, and then hydrolyzed with 6 N HCl for 24 h at 110°C to be liberated from the protein. Amino acids were analyzed on high performance of chromatography (HPLC; Waters 486, USA). All of separations were generated on NOVA-Pak C18 (4 μm) column (Waters, USA) with temperature controlled at 37°C and operated with flow rate of 1 mL/min).
Anti-nutritional factor analysis
Glucosinolates were extracted from RSM with 2 mL of boiling methanol solution (70% vol/vol) and 200 μL internal standard spike solution of glucotropaeolin (ChromaDex, Irvine, CA, USA) was added immediately [14] and extracted Gls were purified on a DEAE Sephadex A-25 anion exchange column (St. Louis, MO, USA). Three types of Gls in RSM were determined by using (HPLC; Sunnyvale, CA, USA). Desulfo-glucosinolates were separated using a Synergi Fusion-RP 80A (100×3 mm, 4 μm, Phenomenex, Torrance, CA, USA) with a flow rate of 1 mL/min. Glucosinolates (progoitrin, sinigrin, and gluconapin) were confirmed by a Finnigan LCQ Deca XP plus Ion Trap Mass Spectrometer system (Thermo Finnigan, San Jose, CA, USA) which confirmed by LC-ESI-MS in positive mode.
Erucic acid content in RSM was analyzed on 7890 Agilent gas liquid chromatograph (Agilent Technologies, Palo Alto, CA, USA) and equipped with flame ionization detector and the column was SP-2560 (i.d. 100 m×0.25 mm×0.20 μm film). Nitrogen was used as carrier gas, injector core temperature was 250°C, detector temperature was 260°C and column temperature was programmed to begin at 170°C, and then increase to 250°C remained at 240°C for 40 min. Chromatography was calibrated with a mixture of 37 different fatty acids (FAME 37; Supelco Inc., Bellefonte, PA, USA) and this standard containing fatty acids ranging from C4:0 to C24:1n9 and samples were added 250 μL of internal standard spike solution (pentadecanoic acid; Sigma-Aldrich Co. LLC. St. Louis, MO, USA) by the method of AOAC [12].
Statistical analysis
Three sows were excluded from data analysis for gestation due to leg weakness during gestation (1 sow from each of 0%, 6%, and 12% of RSM supplementation, respectively), and then 1 sow (12% of RSM supplementation) was excluded from data analysis for lactation due to a lack of appetite after parturition. Data were analyzed by analysis of variance for a completely randomized design using the general linear model procedure of SAS [15]. Least squares means were calculated for each independent variable. Orthogonal polynomial contrasts were used to determine linear and quadratic effects by increasing dietary RSM levels in gestation for all measurements of sows and piglets, blood profiles, and milk composition. Individual sows and their litters were used as the experimental unit. Alpha level used for the determination of significance for all analysis was 0.05 and tendency for all analysis was p≥0.05 and p<0.10.
RESULTS
Rapeseed meal used in this study contained progoitrin (0.38 ±0.17 μmol/g), sinigrin (10.28±1.54 μmol/g) and gluconapin (36.64± 6.89 μmol/g), resulting in 47.30±8.58 μmol/g of total Gls on a dry matter (DM) basis (Table 1). Erucic acid content in RSM was 5.23±2.57 mg/g on a DM basis. Glucosinolates content in the diets was equivalent to 0, 1.41, 2.83, 4.25, and 5.67 μmol/g and erucic acid content was equivalent to 0, 0.16, 0.31, 0.47, and 0.63 mg/g for 0%, 3%, 6%, 9%, and 12% of RSM supplementation treatments, respectively (Table 3).

Effect of rapeseed meal (RSM) supplementation levels in gestation diets on glucosinolates (Gls) and erucic acid intake in sows during gestation period
Body weight and backfat thickness at mating and d 110 of gestation and during lactation were not affected by dietary RSM levels in gestation diets, and there were no differences in lactation feed intake and WEI as dietary RSM supplementation levels in the gestation diet increased (Table 4). Litter size, piglet and litter performance were not affected by dietary RSM levels in gestation diets (Table 5).
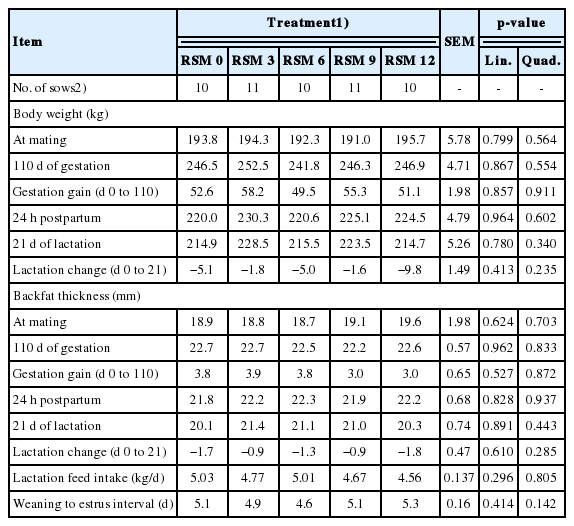
Effect of rapeseed meal (RSM) supplementation levels in gestation diets on body weight, backfat thickness, lactation feed intake and weaning to estrus interval of gestation and lactation

Effect of rapeseed meal (RSM) supplementation levels in gestation diets on litter size and litter performance of sows
Serum T3 (Quadratic, p<0.05) and T4 (Linear, p<0.01) concentration of sows at d 110 of gestation increased by increasing dietary RSM supplementation levels in the gestation diets (Table 6) and the highest values of serum T3 and T4 concentration were observed when sows were fed the diet containing 12% RSM. However, concentrations of serum T3 and T4 in lactating sows and their piglets were not affected by dietary RSM levels in gestation diets (Tables 6, 7).

Effect of rapeseed meal (RSM) supplementation levels in gestation diets on serum triiodithyronine (T3) and thyroxine (T4) concentrations in sows
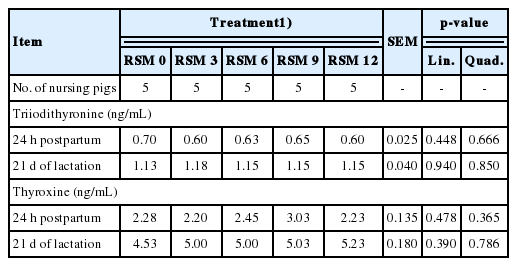
Effect of rapeseed meal (RSM) supplementation levels in gestation diets on serum triiodithyronine (T3) and thyroxine (T4) concentrations in piglets
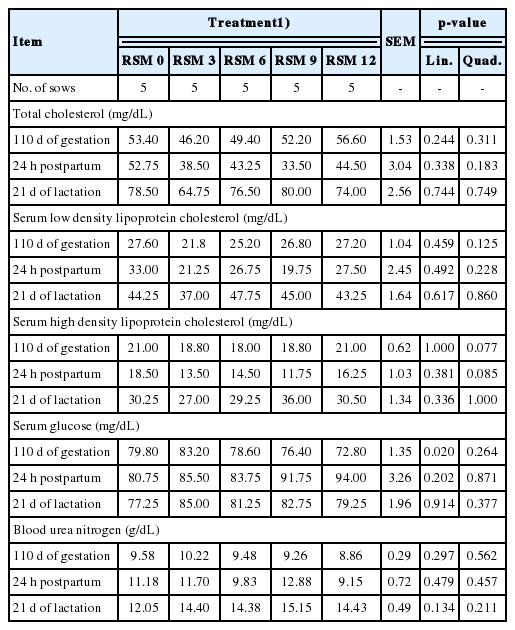
Serum HDL cholesterol concentration at d 110 of gestation and 24 h postpartum tended to decrease as dietary RSM supplementation level in the gestation diets increased up to 6% and 9%, respectively, and then increase as dietary RSM supplementation level increased up to 12% (Quadratic, p = 0.08 and p = 0.09, respectively; Table 8), whereas concentrations of serum total cholesterol and LDL cholesterol were not influenced by dietary RSM levels in gestation diets. Serum glucose level at d 110 of gestation decreased linearly as dietary RSM supplementation levels increased (Linear, p<0.05), whereas at 24 h postpartum and weaning it was not different by dietary RSM levels in gestation diets (Table 8). Serum urea nitrogen was not affected by RSM levels in the gestation diets during gestation and lactating periods (Table 8). Colostrum and milk compositions were not affected by dietary RSM levels in gestation diets at 24 h postpartum and weaning (Table 9).
DISCUSSION
It was previously reported that a high level of Gls from RSM in the gestation diet resulted in poor reproductive performance, low palatability and high piglet mortality [16,17]. Additionally, in gestating sows, feeding a high Gls rapeseed diet without iodine addition accelerated the incidence of iodine deficiency [7] with prolonged pregnancy and piglets being stillborn with impaired viability [16,18]. In the results of the current study, however, RSM supplementation in the gestation diet had no effects on sow BW, backfat thickness, WEI, and growth of their progeny. In contrast, previous studies reported impaired reproductive performance such as poor fetal development, low survival rate, poor conception rates and litter size when sows were fed the diet containing 7% to 8% of RSM with 4 μmol/g Gls [8,16,18]. Although, there was no clear evidence to fully describe the possible reasons of negative effects of Gls on animal reproduction, it has been reported that Gls led to malnutrition due to thyroid dysfunction, transfer of goitrogenic compounds to fetus and reduced nutrient transfer to fetus through placenta [8]. Therefore, Canada and EU regulated the inclusion level of RSM up to 3% and the Gls content below 2 μmol/g in sow diets even though gilts and breeding sows were more susceptible to these Gls and RSM levels [5,8].
Lee and Hill [19] reported that low palatability of RSM was due to smell and bitter taste. The decrease in feed intake resulted from high content of erucic acid, bitter taste of sinapine, and an astringent effect in mouth due to tannin [4,5]. Besides progoitrin could be converted to oxazolidinethion, one of Gls hydrolysis products, and feed intake was significantly reduced when progoitrin levels were 2.30 to 4.65 μmol/g in the animal diet [10,20, 21]. In this experiment, because progoitrin levels (0, 0.0113, 0.0227, 0.0341, and 0.0455 μmol/g DM basis) in the gestation diets were less than 2.30 μmol/g, feed intake during whole experimental period was not affected by dietary RSM supplementation in gestation diets.
High Gls RSM diet without iodine addition caused iodine deficiency disease in gestating sows with increased thyroid activity and serum T4 concentration [7]. In the present experiment, serum concentrations of T3 and T4 increased at d 110 of gestation as dietary RSM levels increased. The hydrolysis products of Gls, thiocyanates, were strongly related with goitrogenic substance, which interfered with iodine uptake and inhibited the synthesis of thyroid hormones T3 and T4 [7,8,17, 22]. Schöne et al [23] reported that serum iodine concentration was associated with change of hormone turnover, hormone requirement for tissues, and thyroid activity related with serum T3 and T4 concentrations. High serum T4 concentration reflected high thyroid activity that induced liver and thyroid hypertrophy, and reduced contents of serum zinc and red blood cell counts [5]. Therefore, the result of the current study indicated that RSM supplementation in gestation diets could alter thyroid functions in sows during gestation. However, no differences were observed in sera T3 and T4 concentrations among dietary treatments during lactation period either in sows or in piglets, suggesting that RSM supplementation in the gestation diets had no influences in thyroid function of sows and their progeny during lactation.
Thyroid hormone was an important modulator of intermediary metabolism by hypercholesterolemia of hypothyroidism and was associated with altered lipoprotein metabolism and increased serum LDL cholesterol [24]. Mckinnon and Bowland [25] demonstrated that hypothyroid condition was related to increase serum total cholesterol concentration in weaning pigs fed the diet containing high Gls RSM and double low RSM (low Gls and erucic acid in rapeseed) compared with those fed the diet with no RSM supplementation. However, in this study, there were no differences in total and LDL cholesterol concentrations by RSM supplementation. These results demonstrated that sows fed RSM diet were less sensitive to Gls than piglets and its effects were not observed by short supplementation period (gestation 0 to 110 day).
In this study, a linear decrease of serum glucose was observed at d 110 of gestation as dietary RSM level increased. Due et al [26] reported that high monounsaturated fatty acid diets reduced serum glucose concentration. From results of Kracht et al [27], RSM contained high amount of monounsaturated oleic acid (51.3% of total fatty acid) and polyunsaturated linoleic acid (26.8% of total fatty acid). This could be a possible reason for decrease of serum glucose levels in sows in late gestation by increasing RSM supplementation level in the gestation diets.
Blood urea nitrogen depended on quality and quantity of protein in animal diets [28]. Biological value of RSM protein was 95% of SBM protein and protein digestibility was lower in RSM compared with SBM [29]. In this study, however, serum BUN concentration was not affected by dietary treatments during gestation and lactation periods and protein availability of RSM was not differ compared to that of SBM.
The results of milk composition in the current study were supported by previous studies. Mawson et al [8] reported that sows fed RSM containing diets did not affect milk composition during four reproductive cycles. Fisher and Walsh [30] also reported that milk composition of fat, protein and solid not fat were not changed by RSM supplementation. In the current study, increasing dietary RSM supplementation levels did not affect milk composition of lactating sows.
ACKNOWLEDGMENTS
This work was supported by Korea Institute of Planning and Evaluation for Technology in Food, Agriculture, Forestry and Fisheries (IPET) through Agri-Bio industry Technology Development Program, funded by Ministry of Agriculture, Food and Rural Affairs (Grant Number:314022-3).
Notes
CONFLICT OF INTEREST
We certify that there is no conflict of interest with any financial organization regarding the material discussed in the manuscript. Choi HB is an employee of CJ Cheiljedang company.

