Studies on meat color, myoglobin content, enzyme activities, and genes associated with oxidative potential of pigs slaughtered at different growth stages
Article information
Abstract
Objective
This experiment investigated meat color, myoglobin content, enzyme activities, and expression of genes associated with oxidative potential of pigs slaughtered at different growth stages.
Methods
Sixty 4-week-old Duroc×Landrace×Yorkshire pigs were assigned to 6 replicate groups, each containing 10 pigs. One pig from each group was sacrificed at day 35, 63, 98, and 161 to isolate longissimus dorsi and triceps muscles.
Results
Meat color scores were higher in pigs at 35 d than those at 63 d and 98 d (p<0.05), and those at 98 d were lower than those at 161 d (p<0.05). The total myoglobin was higher on 161 d compared with those at 63 d and 98 d (p<0.05). Increase in the proportions of metmyoglobin and deoxymyoglobin and a decrease in oxymyoglobin were observed between days 35 and 161 (p<0.05). Meat color scores were correlated to the proportion of oxymyoglobin (r = 0.59, p<0.01), and negatively correlated with deoxymyoglobin and metmyoglobin content (r = −0.48 and −0.62, p<0.05). Malate dehydrogenase (MDH) activity at 35 d and 98 d was higher than that at 161 d (p<0.05). The highest lactate dehydrogenase/MDH ratio was achieved at 161 d (p<0.05). Calcineurin mRNA expression decreased at 35 d compared to that at 63 d and 98 d (p<0.05). Myocyte enhancer factor 2 mRNA results indicated a higher expression at 161 d than that at 63 d and 98 d (p<0.05).
Conclusion
Porcine meat color, myoglobin content, enzyme activities, and genes associated with oxidative potential varied at different stages.
INTRODUCTION
Appearance, nutrition, flavor, hygiene, and security all contribute to the perception of pork quality [1]. Meat color is the first visual sensory index of pork quality and is considered a direct primary determinant of consumer purchase decisions [2]. Fresh pork with a bright red color but not pale, soft, and exudative or dark, firm, and dry, complies with consumer preference. It was reported that acceptance of pork color followed a sequence as follows: red>purple>brownness [3]. Therefore, it can be certain that color deterioration of fresh pork gives rise to financial losses. To date, previous research has predominantly investigated the effect of multiple factors, such as nutrition, genetics, and antioxidants, on postmortem meat color [4].
Meat color depends on the content of myoglobin, hemoglobin, and cytochrome C catalase in skeletal muscle. After thorough exsanguination, the proportion of myoglobin in muscle can reach 80% to 90%. Accordingly, Bekhit and Faustman [5] suggested that the principal chemical ingredient that affects meat color was myoglobin from sarcoplasm. Based on the distinctive reflectance spectra, myoglobin has been classified into three basic states: deoxymyoglobin (DMb), oxymyoglobin (OMb), and metmyoglobin (MMb) [6]. In the absence of oxygen, myoglobin exists in a reduced form (DMb) and has a fuchsia color, particularly in fresh pieces of meat immediately after dissection [7]. In the presence of oxygen, OMb is generated, and the meat color turns to cardinal red [8]. When meat is exposed to oxygen for a long time, MMb is the dominant myoglobin state, imparting a dark brown color to the meat surface [8]. Consequently, meat color is influenced by these three states in a dynamic equilibrium. Meat color can be regulated by numerous conditions such as endurance exercise, species, raising environment, slaughtering processes, and storage conditions [9]. However, few reports have focused on the changes of pork color at different stages of growth.
On the basis of the metabolism capacity of skeletal muscle, muscle fibers are characterized as oxidative (type I, red muscle) or glycolytic (type II, white muscle) and this is closely related to myoglobin concentration [10]. Type I muscle fibers contain more myoglobin, cytochromes, and mitochondria than type II [11]. Thus, meat color somewhat reflects the oxidative pattern of the muscle [12]. Lactate dehydrogenase (LDH) is an indicator of glycolytic potential whose metabolic end-product is lactic acid (LA) [13]. Malate dehydrogenase (MDH) is used as a symbolic enzyme of the mitochondrial matrix [14]. It is well known that the longissimus dorsi muscle belongs to glycolytic muscle category, while triceps muscles are oxidative. In order to reveal the impact of different metabolic types of muscle on meat color, longissimus dorsi and triceps muscles were assessed in our study.
Recently, although ever more potential candidate genes underlying phenotypic variation have been documented, meat color is a complex quantitative trait regulated by numerous genes and is difficult to identify accurately. Myoglobin is enriched in oxidative muscle fibers and its encoded gene (Mb) has higher expression in cardiac muscle and skeletal muscle, as proved by Weller et al [15]. The Mb pathway involves signaling of the Ca2+ concentration variance from muscle cells being transducted to nuclear factor of activated T cells (NFATc1) and myocyte enhancer factor 2 (MEF2) in the nucleus by activating calcineurin (CaN) or calmodulin-dependent protein kinases (CaMK); this modulates the transcription of downstream genes, including the Mb gene [16,17]. Moreover, peroxisome proliferator-activated receptor γ co-activator-1α (PGC-1α) plays an essential role in mitochondrial biosynthesis and cellular respiration. Overexpression of PGC-1α increased the mitochondrial content, oxidase level, and composition of type I muscle fibers [18]. These novel genes are associated with the pathway of muscle fiber formation (red muscle) and oxidative metabolism of muscle.
It is reasonable to hypothesize that meat color will differ depending on different stages of growth or the type of muscle. Therefore, the objective of this work was to investigate meat color, myoglobin content, enzyme activities, and expression of genes associated with oxidative potential of pigs slaughtered at different growth stages. We evaluated the meat color scores, the content of total myoglobin, OMb, DMb, and MMb, LA concentration and enzyme activities (LDH and MDH capacity; the ratio of LDH/MDH) of two types of muscle (longissimus dorsi and triceps muscles) from pigs at different stages. In addition, the relative expression levels of oxidative metabolism-related genes (Mb, CaN, NFATc1, MEF2, and PGC-1α) were also identified in the present study. Using these data, our study provides a better understanding of the mechanisms underlying meat color variation at different stages of growth.
MATERIALS AND METHODS
Ethics approval of animal experiments
The experiment protocol was approved by the Institutional Animal Care and Use Committee (IACUC) of South China Agricultural University under procedure (SCAU-AEC-2010-0416). Animals were cared for and used strictly in accordance with the Welfare and Ethics of Laboratory Animals Regulations (WELAR) approved by the Chinese Association for Laboratory Animal Sciences (CAFLAS).
Animals, experiment design, and diets
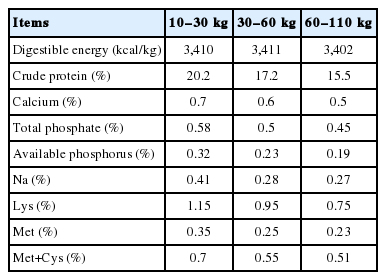
Sixty 4-week-old weaned piglets (Landrace×Yorkshire×Duroc) with similar initial body weights were randomly assigned into 6 replicate groups (pens) with 10 pigs per group. All pigs were supplied ad libitum access to food and water throughout the experimental period. Experimental diets were formulated according to the NRC [19] and are shown in Table 1. Nutrient values were calculated (Table 2).
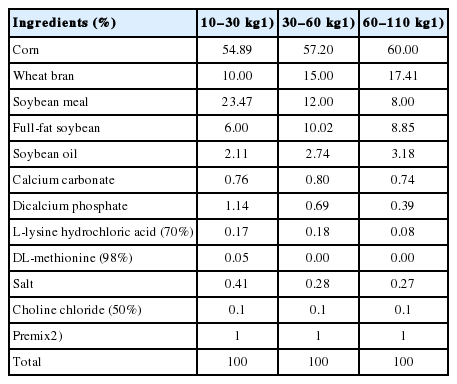
Ingredients of the diets for pigs at the three stages (%)
Meat color score analyses
Twenty-four pigs were sacrificed, at 35, 63, 98, and 161 days of age, by slaughtering one pig from each stall via electrical stunning followed by exsanguination. Longissimus dorsi and triceps muscles were obtained for experimental analyses. Meat color scores (on a scale of 1 to 6) of the longissimus dorsi flesh samples were assessed by 8 trained panelists (Color Quality Meeting, National Pork Producers Council, Des Moines, IA, 1996) [20].
Determination of myoglobin content of porcine skeletal muscle
Samples (0.5 g) of pork were homogenized and centrifuged at 10,000 g for 10 min, and the supernatant absorbance was detected at 576 nm against a blank using a spectrophotometer (iMark680, Bio-Rad, Hercules, CA, USA) as previously described by Li et al [21]. The results are presented as milligrams of total myoglobin per gram of meat, calculated from the millimolar extinction coefficient of myoglobin at 576 nm.
Approximately 1 g of sample was homogenized with 8 mL sodium phosphate solution (0.04 mol/L, pH 6.8) and the supernatant was filtered through a WhatMan filter. The extract absorbance was read at 503, 525, 557, and 582 nm against a blank by using a spectrophotometer (iMark680, Bio-Rad, USA). The proportion of the DMb, OMb, and MMb was calculated using the following equations [22,23]:
Where R1, R2, and R3 were the absorbance (A) ratios of A582/A525, A557/A525, and A503/A525, respectively.
Enzyme capacity and lactic acid content profiles
Normal saline was added to pork to prepare the extraction used in the determination of the enzyme capacity and LA content. Briefly, to detect LDH capacity, the extract was incubated with the substrate buffer and coenzyme I at 37°C for 15 min, and then was color-rendered using 2,4-dinitrophenylhydrazine [24]. The absorbance of the reaction was read at 450 nm against a blank using a spectrophotometer (iMark680, Bio-Rad, USA). LDH capacity was reported as U of LDH per gram of meat. Similarly, MDH activity was detected using the redox reaction of the substrate and was expressed as U of MDH per gram of meat, calculated from the millimolar extinction coefficient of MDH at 340 nm [25]. The ratio of LDH to MDH was calculated. Measurement of LA was performed as described by Ryu et al [26]. Lactate oxidase was added to the pork extract and incubated at 37°C for 10 min before the absorbance of the reactions was read at 530 nm against a blank using a spectrophotometer (iMark680, Bio-Rad, USA). LA content is shown as millimoles of LA per gram of pork.
Extraction of total RNA
Total RNA was extracted from longissimus dorsi and triceps muscles by using TRIzol reagent according to the manufacturer’s protocol (Invitrogen, Carlsbad, CA, USA). Trace genomic DNA contamination was eliminated from the isolated RNA by using DNase. Purity of the RNA samples was examined using 260/280 nm and 260/230 nm absorbance ratios. To verify the integrity of the isolated RNA, we ran 28S, 18S, and 5S rRNA bands on ethidium bromide-stained agarose gels.
RT-qPCR for genes associated with oxidation of porcine skeletal muscle
The extracted RNA was reverse transcribed to cDNA using oligo (dt) 18 primer, reverse transcriptase, and an RNase inhibitor. The primers for real-time quantitative polymerase chain reaction (RT-qPCR) were designed by Primer 5 and Oligo 7 software and are listed in Table 3. RT-qPCR was performed on an Applied Biosystems 7500 machine (Foster City, CA, USA) using a cDNA temperate and SYBR Green fluorescent dye (Promega, Madison, WI, USA). The following thermal cycling parameters were used: initial denaturation at 95°C for 5 min, followed by 40 cycles of denaturation at 95°C for 30 s and annealing and extension at 72°C for 30 s. The expression level of genes associated with oxidation of porcine skeletal muscle is shown as 2−ΔCt where ΔCt is the difference in Ct between the objective gene and the housekeeping gene (glyceraldehyde-3-phosphate dehydrogenase).
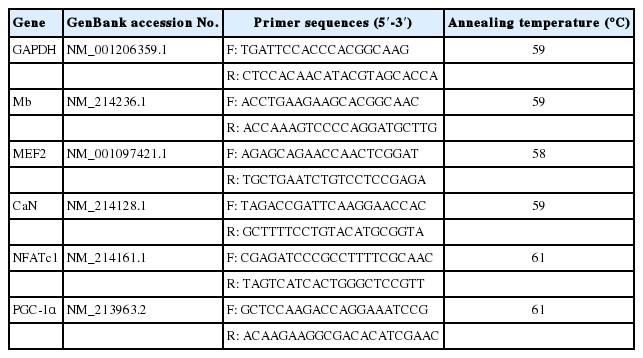
Primers for RT-qPCR
Statistical analysis
All data were analyzed using SPSS 19.0 (Inc.233 South Wacker Drive, Chicago, IL, USA) with one-way analysis of variance and independent samples T test. Pearson procedure was employed to analyze the correlation coefficients between meat color scores and myoglobin in longissimus dorsi. The results are displayed as means±standard error. A significant difference between means was considered if p<0.05.
RESULTS
Changes of meat color scores in longissimus dorsi at different stages
Meat color scores in longissimus dorsi altered with age (Figure 1). Scores were higher in pigs at 35 d than those at 63 d and 98 d (p<0.05), and those at 98 d were lower than those at 161 d (p< 0.05) (Figure 1). The highest color score (3.64) was observed at 35 d and the lowest color score (2.83) was found at 98 d.

Changes of meat color scores in longissimus dorsi at different stages of growth. Mean with different superscripts demonstrate significant difference among groups (p<0.05), n = 6.
Changes of myoglobin of porcine skeletal muscle at different stages
The total myoglobin content in both longissimus dorsi and triceps muscles showed an overall increase between 35 d and 161 d (Figure 2A, 2B). The total myoglobin in longissimus dorsi was higher on 161 d compared with those at 63 d and 98 d (p<0.05) (Figure 2A). There was no significant difference in total myoglobin content in triceps muscle at any age (Figure 2B). The maximum total myoglobin content in longissimus dorsi and triceps muscles were 0.27 mg/g and 0.30 mg/g at 161 d and their minimum value were 0.16 mg/g at 63 d and 0.27 mg/g at 98 d (Figure 2A, 2B). An increase in the proportion of MMb and DMb in longissimus dorsi was observed from 35 d to 161 d, similar to those of triceps muscles, whereas the proportion of OMb in both muscle types fell between 35 d and 161 d (Figure 2C, 2D, 2E, 2F). Pigs at 35 d and 63 d showed similar proportions of OMb in longissimus dorsi and these were greater than those of pigs at 98 d and 161 d (p<0.05) (Figure 2C). OMb content in triceps muscles at 63 d, 98 d, and 161 d were lower than that of 35 d (p<0.05) (Figure 2D). OMb content in longissimus dorsi and triceps muscles reached to the maximum (51.75% and 51.61%) at 35 d and they achieved minimum levels (33.82% and 41.06%) at 161 d (Figure 2C, 2D). Mean-while, MMb and DMb content in longissimus dorsi at 98 d and 161 d were higher than those at 35 d and 63 d (p<0.05) (Figure 2E). The maximal MMb and DMb levels in longissimus dorsi were 49.17% and 16.36% at 161 d and their minimal values were 37.01% at 35 d and 8.42% at 63 d, respectively (Figure 2E). Pigs at 161 d had greater MMb content in triceps muscles than that of pigs at 35 d (p<0.05) (Figure 2F). DMb content in triceps muscles at 63 d, 98 d, and 161 d were higher than that of 35 d (p<0.05) (Figure 2F). The crest MMb and DMb content in triceps muscles were 37.15% and 9.51% at 35d, and their least values were 42.71% and 15.45% at 161 d (p<0.05) (Figure 2F).

Changes of myoglobin content in porcine skeletal muscle at different stages of growth. (A, B) Total myoglobin content in longissimus dorsi and triceps muscles, respectively. (C, D) Proportion of oxymyoglobin in longissimus dorsi and triceps muscles, respectively. (E) Proportion of metmyoglobin and deoxymyoglobin in longissimus dorsi. (F) Proportion of metmyoglobin and deoxymyoglobin in triceps muscles. Mean with different superscripts demonstrate significant difference among groups (p<0.05), n = 6.
Correlation coefficients between meat color scores and myoglobin in longissimus dorsi
Pearson coefficients analysis revealed that meat color scores in longissimus dorsi were negatively correlated with the proportion of DMb and MMb (r = −0.48 and −0.62, p<0.05) (Table 4). A positive correlation between meat color scores and the proportion of OMb in longissimus dorsi was noted (r = 0.59, p<0.01) (Table 4).
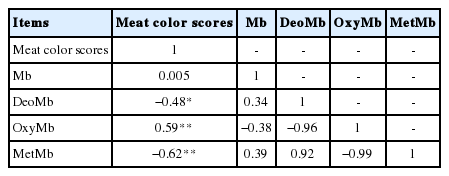
Correlation coefficients between meat color scores and myoglobin in longissimus dorsi
Changes of enzyme activities and LA levels in porcine skeletal muscle at different stages
It appeared that LDH capacity and the ratio of LDH/MDH in longissimus dorsi increased with age, while an adverse trend was shown for MDH in longissimus dorsi (Figure 3A, 3C, 3E). The LDH capacity, MDH capacity, and their ratio in triceps muscles were identical to that exhibited in longissimus dorsi (Figure 3B, 3D, 3F). The LDH activity in longissimus dorsi was increased from 35 d to 161 d (Figure 3A). The LDH activity in triceps muscles at 35 d was lower than that of any other age (p<0.05) (Figure 3B). MDH activity in longissimus dorsi and triceps muscles at 35 d and 98 d was higher than that at 161 d (p<0.05) (Figure 3C, 3D). The highest MDH activity in longissimus dorsi and triceps muscles were 6.97 U/g and 7.61 U/g at 35 d, and their lowest values were 3.71 U/g and 4.72 U/g at 161 d, respectively. The highest LDH/MDH ratio in longissimus dorsi and triceps muscles was achieved at 161 d (p<0.05) (Figure 3E, 3F). LDH activity and LDH/MDH ratio in longissimus dorsi aroused to climax (94.88 U/g and 26.06 U/g) at 161 d, while they approached lowest point (80.42 U/g and 11.77 U/g) at 35 d, respectively. Maximum LDH activity and LDH/MDH ratio (83.81 U/g and 17.44 U/g) in triceps muscles appeared at 161 d, while their minimum values (54.52 U/g and 7.36 U/g) attained at 35 d, respectively. As shown in Figure 3G, 3H, the content of LA in longissimus dorsi and triceps muscles was not significantly affected by age, but showed a declining trend with increasing age. LA content in longissimus dorsi and triceps muscles culminated at 63 d with levels of 2.77 mmol/g at 35 d and 2.17 mmol/g, while they hit the bottom at 98 d and 161 d when their content were 2.10 mmol/g and 1.90 mmol/g, respectively.

Changes of enzyme activities and lactic acid (LA) of porcine skeletal muscle at different stages of growth. (A, B) Proportion of lactic dehydrogenase (LDH) in longissimus dorsi and triceps muscles, respectively. (C, D) Proportion of MDH in longissimus dorsi and triceps muscles, respectively. (E, F) The ratio of LDH/MDH in longissimus dorsi and triceps muscles, respectively. (G, H) LA content in longissimus dorsi and triceps muscles, respectively. Mean with different superscripts demonstrate significant difference among groups (p<0.05), n = 6.
Changes of genes associated with oxidative potential of porcine skeletal muscle at different stages
All the genes associated with oxidative potential of longissimus dorsi and triceps muscles showed no significant difference among the age groups except for MEF2 and CaN genes in longissimus dorsi. PGC-1α mRNA expression in triceps muscles reached a peak at 98 d and subsequently decreased at 161 d in consistent with the longissimus dorsi result (Figure 4A, 4B). NFATc1 mRNA expression in longissimus dorsi increased form 35 d to 63 d and subsequently decreased from 63 d to 98 d and then increased from 98 d to 161 d (Figure 4C). As shown in Figure 4D and 4H, CaN mRNA and NFATc1 mRNA expression in triceps muscles decreased from 35 d to 161 d. MEF2 mRNA results indicated a higher expression at 161 d than that at 63 d and 98 d in longissimus dorsi (p<0.05) (Figure 4E). MEF2 mRNA expression in triceps muscles decreased from 35 d to 63 d and subsequently increased from 63 d to 98 d followed by a decline from 98 d to 161 d (Figure 4F). CaN mRNA expression in longissimus dorsi was decreased at 35 d compared to that at 63 d and 98 d, and thereafter increased at 161 d (p<0.05) (Figure 4G). Mb mRNA expression in longissimus dorsi achieved a trough at 63 d and then increased from 98 d to 161 d (Figure 4I). In contrast, the expression level of Mb mRNA in triceps muscles decreased between 35 d and 161 d (Figure 4J).

Changes in expression of genes associated with oxidation of porcine skeletal muscle at different stages of growth. (A, B) Peroxisome proliferator-activated receptor γ co-activator-1α (PGC-1α) expression level in longissimus dorsi and triceps muscles, respectively. (C, D) Nuclear factor of activated T cells (NFATc1) expression level in longissimus dorsi and triceps muscles, respectively. (E, F) Myocyte enhancer factor 2 (MEF2) expression level in longissimus dorsi and triceps muscles, respectively. (G, H) Calcineurin (CaN) expression level in longissimus dorsi and triceps muscles, respectively. (I, J) Myoglobin (Mb) expression level in longissimus dorsi and triceps muscles, respectively. Mean with different superscripts demonstrate significant difference among groups (p<0.05), n = 6.
Different muscle profiles of porcine myoglobin
The total myoglobin content of triceps muscles at 35 d (0.27 mg/g vs 0.20 mg/g), 63 d (0.29 mg/g vs 0.16 mg/g), and 98 d (0.27 mg/g vs 0.18 mg/g) was higher than those of longissimus dorsi (p<0.05) (Figure 5A). The longissimus dorsi had more OMb and less DMb at 63 d (51.16% vs 43.31%, 8.42% vs 13.55%), and less OMb 98 d (33.87% vs 42.97%) compared with the triceps muscles (p<0.05) (Figure 5B, 5D). The percentage of MMb in longissimus dorsi from pigs at 98 d (49.14% vs 41.65%) and 161 d (49.17% vs 42.71%) decreased compared to that of triceps muscles (p<0.05) (Figure 5C).

Different muscle profiles of porcine myoglobin. (A) Differences in total myoglobin content between longissimus dorsi and the triceps muscles. (B) Differences in oxymyoglobin content between longissimus dorsi and triceps muscles. (C) Differences in metmyoglobin content between longissimus dorsi and triceps muscles. (D) Differences in deoxymyoglobin content between longissimus dorsi and the triceps muscles. Mean with different superscripts demonstrate significant difference among groups (p<0.05), n = 6.
Different muscle profiles of porcine enzyme activities and LA
The LDH capacity in longissimus dorsi from pigs at 35 d (80.42 U/g vs 54.52 U/g) was higher than that of triceps muscles, as was the level of LA at 35 d (2.77 mmol/g vs 2.07 mmol/g) and 161 d (2.52 mmol/g vs 1.90 mmol/g) (p<0.05) (Figure 6A, 6B). On the contrary, MDH capacity in longissimus dorsi from pigs at 63 d (4.64 U/g vs 6.59 U/g) was lower than that of triceps muscles (p<0.05) (Figure 6C). A significantly decreased ratio of LDH/MDH was observed in triceps muscles compared with that of longissimus dorsi from pigs at 35 d (11.77 vs 7.36), 63 d (19.47 vs 12.68), and 161 d (26.06 vs 17.44) (p<0.05) (Figure 6D).
Different muscle profiles of porcine enzyme activities and lactic acid (LA). (A) Differences in lactic dehydrogenase (LDH) content between longissimus dorsi and triceps muscles. (B) Differences in LA content between longissimus dorsi and triceps muscles. (C) Differences in malate dehydrogenase (MDH) content between longissimus dorsi and triceps muscles. (D) Differences in the ratio of LDH/MDH between longissimus dorsi and triceps muscles. Mean with different superscripts demonstrate significant difference among groups (p<0.05), n = 6.
DISCUSSION
Meat color is one of the crucial sensory evaluation parameters of meat quality. In the present study, pork color scores fell to their lowest point at 98 d and then rebounded at 161 d. Myoglobin is a hemoprotein that binds oxygen in muscles so they can work at peak efficiency [27]. Meat color is mainly determined by the content of myoglobin. Meat with higher myoglobin content is redder in color [28]. In our study, the total myoglobin content showed a consistent trend with the meat color scores with age. Therefore, the variation of meat color could be explained simply as the change in total myoglobin. Furthermore, the proportion of OMb decreased, and the percentage of DMb and MMb increased with age. Sutha et al [29] reported that meat quality improved with increasing age of pigs and approached stabilization after 12 months of age. Taken together, these results indicate that optimal meat quality had not yet been accomplished in the immature pigs, and optimization of meat quality could not be realized if pigs were slaughtered too late, as far as meat color was concerned. A significant positive correlation between myoglobin concentration and meat color was observed in a previous study [30], and it corroborates our results that meat color score is positively correlated to the proportion of OMb (r = 0.59). However, we also showed that the proportions of DMb and MMb were negatively correlated with meat color scores (r = −0.48 and −0.62).
In our study, LDH activity and LDH/MDH increased with age. Moreover, LA content and MDH capacity decreased with age. As mentioned above, meat color is associated with the metabolic pattern of muscle, particularly the oxidative or glycolytic potential of muscle fibers. MDH is a component of the tricarboxylic acid cycle, and LDH is an important enzyme of anaerobic glycolysis in glycometabolism. The ratio of LDH/MDH demonstrates the oxidative pattern of muscle, and a low level approximates vigorous oxidative metabolism [31]. Unexpectedly, the increase of LDH with age did not increase the production of LA, but rather the converse was true. In theory, LA accumulation in skeletal muscle derives from the glycolytic metabolism of glucose from muscular glycogen breakdown [32]. Based on the results above, we speculated that levels of the substrates of the enzymes, such as glycogen and glucose, may reduce with age resulting in the decline in LA content [33]. The presence or absence of oxygen in the body can be estimated by the concentration of LA and LDH capacity. LDH capacity is activated by the deficiency of oxygen partial pressure. All results of enzyme activity tests exhibited evidence of a higher glycolytic metabolism and a lower oxygen pressure in muscle across all ages. To a certain degree, the metabolic pattern and oxygen pressure of muscle are assumed to influence meat color when referring to our myoglobin results.
Mb, CaN, NFATc1, MEF2, and PGC-1α have been considered as causative genes responsible for meat color [34]. These genes also participate in the pathway of muscle fiber formation (red muscle) or oxidative metabolism of muscle. CaN, a protein phosphatase 2B, modulates the transcription of Mb by regulating its downstream genes (MEF2 and NFATc1) [35,36]. A reduction in levels of mitochondria and oxidase activities were detected in PGC-1α knockout mice [37]. Expression levels of PGC-1α mRNA were higher in red muscle than those of white muscle [38]. The expression of Mb, CaN, NFATc1, and MEF2 mRNA was upregulated in skeletal muscle across all ages, but PGC-1α mRNA expression showed the opposite trend in this study. Therefore, variation in the expression of genes associated with meat color among the age groups in the present study demonstrated a high consistency with the meat color scores. Furthermore, the decrease of PGC-1α mRNA expression across all ages was also in harmony with the low oxidative potential of muscle. Our results indicate that meat color and metabolic patterns of muscle were regulated by the genes analyzed in our study.
Triceps muscles had a higher content of total myoglobin than longissimus dorsi, but there was no uniform pattern of the proportion of OMb between muscle types at the four ages. Similar results were found in the proportion of DMb between longissimus dorsi and triceps muscles and those of MMb. The MDH capacity of longissimus dorsi decreased compared with that of triceps muscles. LDH capacity and the ratio of LDH/MDH of longissimus dorsi were higher than those of triceps muscles; this contributed to the elevated LA content. This result was in line with the theory that longissimus dorsi has a fast speed of glycolysis [39]. Triceps muscles, with their higher myoglobin content and special glycolysis characteristics, are endowed with adaption to bear load and endurance exercise [40,41]. Therefore, longissimus dorsi and triceps muscles can be defined as different muscle types according to their glycolytic or oxidative capacity [42].
CONCLUSION
In summary, this study found that different ages at slaughter could influence porcine meat color, myoglobin content (OMb, DMb, and MMb), enzyme activities (LDH and MDH), and genes associated with oxidative potential in skeletal muscle (Mb, CaN, NFATc1, MEF2, and PGC-1α). Furthermore, meat color scores were significantly associated to the proportion of myoglobin. In addition, longissimus dorsi had higher myoglobin content, LA level, and LDH capacity, as well as lower MDH activity, compared with triceps muscles. Therefore, longissimus dorsi and triceps muscles were characterized as glycolytic and oxidative muscles, respectively. These results provide a better understanding of mechanisms underlying the occurrence of meat color variation.
ACKNOWLEDGMENTS
This work was supported by the National Basic Research Program of China 973 Project (project number 2012CB12470), Provincial Science and Technology Project of Guangdong Province (project number 2016A020210104), University-Industry Cooperation Projects of Huadu in Guangzhou (project number HD14NY003) and Guangdong Provincial Innovation Team Project of Modern Agricultural Industry Technology System (project number 2016 LM1120).
Notes
AUTHOR CONTRIBUTIONS
QPY, DYF, and JJZ conceived the conception and design. QPY, JX, and XJH participated in the meat color sensory evaluation in this study. JX, XJH, and YHL measured myoglobin content and enzyme capacity. QPY, JX, and FW conducted RT-qPCR experiment and statistical analysis. MHX drafted the manuscript and performed Table 1 to 4. QPY and TD carried out and generate Figure 1 to 6. HZT, SGZ, TZ, and XHO participated in its design and coordination. JJZ revised the manuscript. All authors read and approved the final manuscript.
CONFLICT OF INTEREST
We certify that there is no conflict of interest with any financial organization regarding the material discussed in the manuscript.