Carbohydrate and lipid spectroscopic molecular structures of different alfalfa hay and their relationship with nutrient availability in ruminants
Article information
Abstract
Objective
This study was conducted to determine molecular structures related to carbohydrates and lipid in alfalfa hay cut at early bud, late bud and early flower and in the afternoon and next morning using Fourier transform infrared spectroscopy (FT/IR) and to determine their relationship with alfalfa hay nutrient profile and availability in ruminants.
Methods
Chemical composition analysis, carbohydrate fractionation, in situ ruminal degradability, and DVE/OEB model were used to measure nutrient profile and availability of alfalfa hay. Univariate analysis, hierarchical cluster analysis (CLA) and principal components analysis (PCA) were conducted to identify FT/IR spectra differences.
Results
The FT/IR non-structural carbohydrate (NSCHO) to total carbohydrates and NSCHO to structural carbohydrate ratios decreased (p<0.05), while lignin to NSCHO and lipid CH3 symmetric to CH2 symmetric ratios increased with advancing maturity (p<0.05). The FT/IR spectra related to structural carbohydrates, lignin and lipids were distinguished for alfalfa hay at three maturities by PCA and CLA, while FT/IR molecular structures related to carbohydrates and lipids were similar between alfalfa hay cut in the morning and afternoon when analyzed by PCA and CLA analysis. Positive correlations were found for FT/IR NSCHO to total carbohydrate and NSCHO to structural carbohydrate ratios with non-fiber carbohydrate (by wet chemistry), ruminal fast and intermediately degradable carbohydrate fractions and total ruminal degradability of carbohydrates and predicted intestinal nutrient availability in dairy cows (r≥0.60; p<0.05) whereas FT/IR lignin to NSCHO and CH3 to CH2 symmetric stretching ratio had negative correlation with predicted ruminal and intestinal nutrient availability of alfalfa hay in dairy cows (r≥−0.60; p<0.05).
Conclusion
FT/IR carbohydrate and lipid molecular structures in alfalfa hay changed with advancing maturity from early bud to early flower, but not during the day, and these molecular structures correlated with predicted nutrient supply of alfalfa hay in ruminants.
INTRODUCTION
Cultivated alfalfa (Medicago sativa L.) is one of the major forage crops in the world [1]. In general, leaf:stem ratio [1] protein and non-structural carbohydrate (NSCHO) concentration and potential nutrient availability decrease and fiber and lignin increase with advancing stage of maturity (SM) of alfalfa [1,2]. The NSCHO and true protein content of alfalfa hay, which influence its nutritive value, accumulate during the day as a result of photosynthesis and are therefore affected by cutting time (CT) [3,4]. Availability of nutrient from feed in cattle is mainly determined by the accessibility of rumen microbial enzymes to the structural carbohydrates (STCHO) and by the nutrients in the cell content like NSCHO [5]. Carbohydrates in the fiber structure include cellulose, hemicellulose and pectin in a matrix of cross-linkages which also include structural proteins and lignin [6]. These components can be determined by wet chemical analysis and reveal information about the composition of the plant fiber [6]. However, this does not give information about the molecular structures in fiber which are important determinants of nutrient availability from feed in ruminants [5,7]. Fourier transform infrared micro spectroscopy (FT/IR) is a quick, direct, and non-destructive analytical technique which can reveal molecular structural features of biological samples [5,7]. Recently, Zhang and Yu [7] demonstrated that FT/IR carbohydrate molecular structures correlated with different carbohydrate fractions related to predicted nutrient availability of grain mixed with increasing levels of dried distiller’s grain with soluble for cattle. The degradation of wheat straw lignin by white rot fungus with FT/IR has been reported [8].
Generally, total fatty acids content in forages is in the range of 20 to 50 g/kg dry matter (DM). This is relatively low, however, forages are usually the main and cheapest source of fatty acids in ruminant diets. Fatty acid content and composition in forage is affected by numerous factors such as cultivar, climate, day length, rainfall, fertilization, and SM [9,10]. Total fatty acids content and unsaturated fatty acids concentration were found to decrease with advancing maturity in grasses. The change in leaf:stem ratio might partly explain the reduction of fatty acids as plants mature. Light intensity affects chloroplast (containing fatty acids) in the leaf which is another factor that may affect the fatty acids concentration and composition of forage plants. The CT in the day was found to have an impact on the profile of fatty acids in forage with more poly-unsaturated fatty acids when plants were longer exposed to day light [9,11,12].
Recently we found that alfalfa hay FT/IR protein molecular structures, α-helix to β-sheets ratio, changed with advancing SM and during the day from morning to afternoon CT [13]. To date, no published research has investigated the effect of SM and CT on FT/IR carbohydrate and lipid molecular structures of alfalfa hay and its relationship with nutrient availability in cattle.
The objectives of this study were to determine FT/IR carbohydrate and lipid molecular structure in alfalfa hay cut at three SM (early bud, late bud, and early flower) and two CT (in afternoon and morning). Secondly, to correlate the FT/IR molecular structures with basic wet chemical composition, carbohydrate sub-fractions, in situ ruminal degradability and predicted metabolizable protein supply in ruminants. The hypothesis was that molecular structures related to carbohydrates and lipids in alfalfa hay could be revealed by FT/IR spectroscopy and these features correlate with potential nutrient availability from alfalfa hay in ruminants.
MATERIALS AND METHODS
Alfalfa crop management
A second year alfalfa field (20×24 m) seeded with cv. Ranger at the Research Farm of Ferdowsi University of Mashhad (Mashhad, Iran; 36°17′52.8″N, 59°36′20.52″E) was used in this study. The whole field was harvested before the experiment at April 6, 2010 and irrigated every 10 days during experiment.
Six plots (4×4 m each) within 5 replicate blocks in a field were randomly assigned to 6 treatments in a factorial arrangement (3 SM×2 CT). Alfalfa was cut at early bud (June 15/16), late bud (June 26/27), and early flower (July 18/19), both in the afternoon (18:00 h) and the following morning (06:00 h). The SM was determined according the available method [14]. Briefly, a quadrate (250 cm2) was randomly thrown in each plot (one time) and all stems above 3 cm stubble height inside the quadrate (ca. 70 to 80 stems) were used to calculate the mean SM for each plot. At each harvest, an area of 3×3 m was manually clipped using a small scythe at ca. 5 cm above the soil surface.
Alfalfa harvested from each plot was air dried in the shade for 10 to 15 days. After air drying, alfalfa hay samples were chopped using a hay chopper with a 20 mm screen (Agri-Equip, Nasr Co., Isfahan, Iran). This is the common procedure in Iran for processing alfalfa hay before mixing it in total mixed ration for dairy cows. The hay from the first, second and third blocks were pooled to one sample and hay from the fourth and fifth blocks were pooled to another sample to generate sufficient material for chemical analysis, in situ degradability, and FT/IR spectroscopy measurements (n = 12; 3 SM×2 CT×2 sample pools).
Fourier transformed infrared spectroscopy
This part of the study was performed in the Department of Animal and Poultry Science, University of Saskatchewan (Saskatoon, SK, Canada). Before analysis, the alfalfa hay samples were finely ground two times to pass through a 0.2 mm screen (Retsch ZM-1, Brinkmann Instruments Ltd., ON, Canada). Fourier transformed infrared spectroscopy was performed using a JASCO FT/IR-ATR-4200 with a ceramic infrared (IR) light source and a deuterated L-alanine doped triglycine sulfate detector (JASCO Corporation, Tokyo, Japan) equipped with a MIR acle attenuated total reflectance accessory module and fitted with a Zn Se crystal and pressure clamp (PIKE Technologies, Madison, WI, USA) [13]. Spectra were generated from the mid-IR region (4,000 to 800 cm−1) using JASCO Spectra manager II software with a spectral resolution of 4 cm−1 (Figure 1). Five sub-samples of each alfalfa hay (n = 12) were scanned with 5 spectra per sample and 60 spectra (12×5) in total.
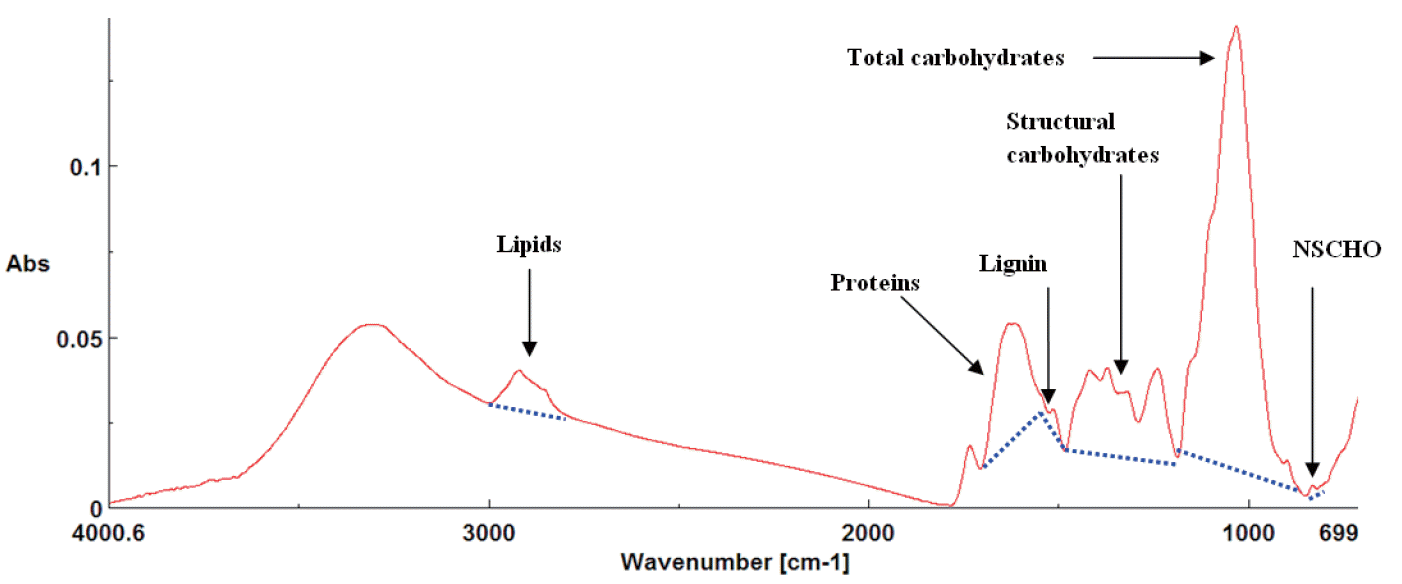
Typical JASCO FT/IR-ATR full range spectrum (ca. 4,000 to 800 cm−1) of alfalfa hay (finely ground) including functional groups related to lipids (ca. 2,770 to 3,000 cm−1), lignin (ca. 1,498 to 1,526 cm−1), total carbohydrates (ca. 900 to 1,180 cm−1), structural carbohydrates (ca. 1,188 to 1,485 cm−1) and non-structural carbohydrates (NSCHO, ca. 815–845 cm−1).
Molecular spectra analysis
Functional spectral bands associated with carbohydrate and lipid molecular structures were assigned according to published studies [15,16] and identified after JASCO Spectra manager II software after noise elimination. Functional groups related to molecular structures of total carbohydrates (TCHO) (peak area baseline ca. 852 to 1,186 cm−1), STCHO mainly associated with hemi and cellulosic compounds (peak area baseline ca. 1,188 to 1,482 cm−1), NSCHO (peak area and height, baseline: ca. 818 to 845 cm−1) and lignin (peak area and height, baseline ca. 1,498 to 1,526 cm−1) were analyzed (Figure 1) [7,17].
Functional groups related to lipids are detectable from ca 2,770 to 3,000 cm−1 and are related to vibration absorption of CH (asymmetric stretching of CH2 at ca. 2,923 cm−1 and CH3 at ca. 2,967 cm−1; CH3 symmetric and CH2 symmetric groups were at ca. 2,894 cm−1 and ca. 2,874 cm−1 respectively) [17,18]. These features were identified after using second derivative and fourier self deconvolution functions of OMNIC software (Figure 2A, 2B) [17,18]. Lipid unsaturation group (CH attached to C=C) peak area is detected between ca. 2,996 to 3,020 cm−1 with the center of the peak located at ca. 3,000 cm−1 [17].
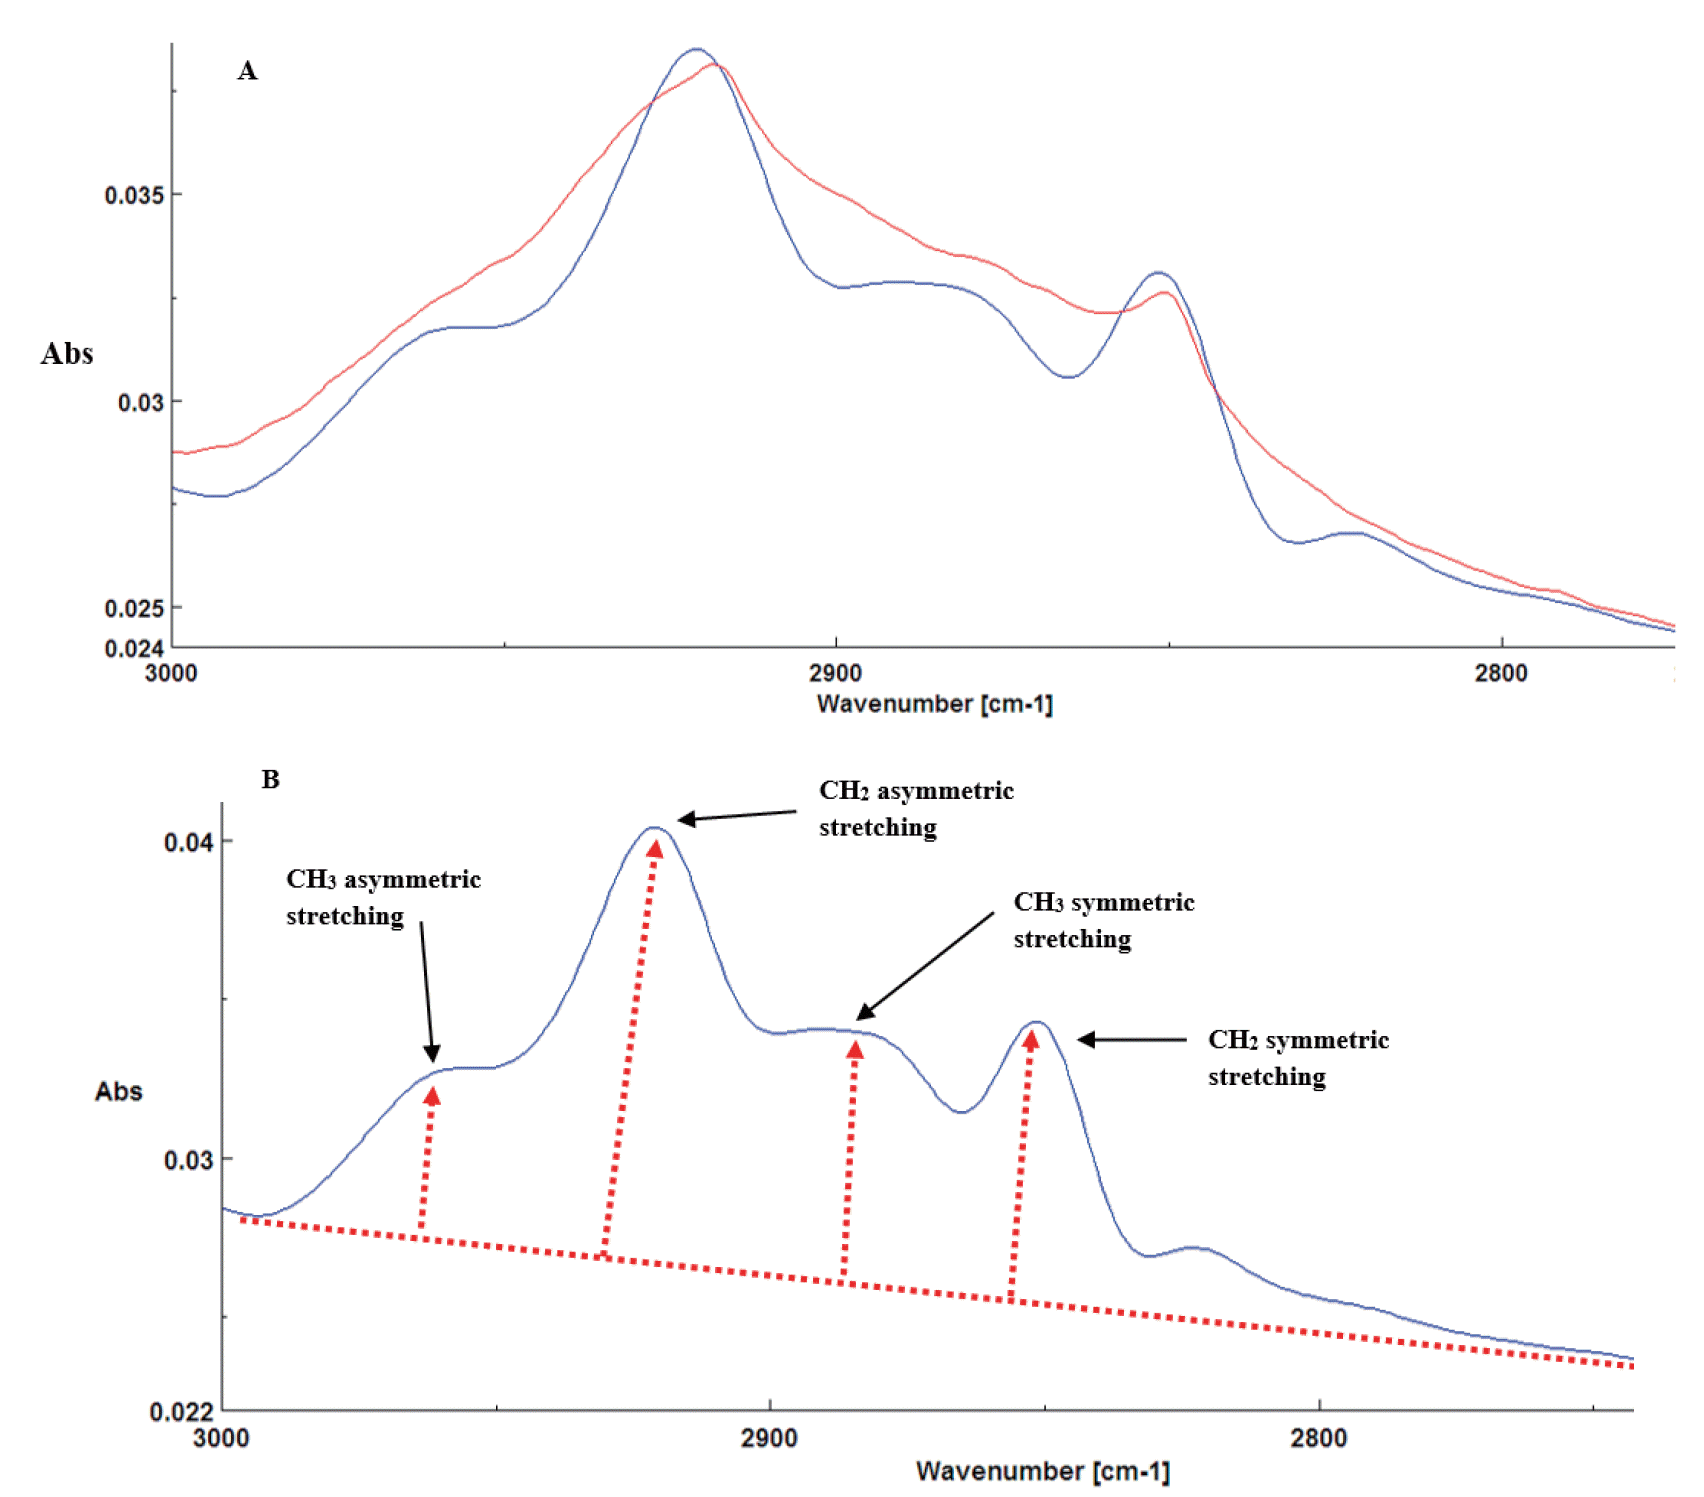
The molecular spectrum in the lipid region of alfalfa hay in the 2nd derivative and Fourier self-deconvolution (FSD) spectrum (A) and identification of asymmetric and symmetric C–H stretching (CH3 and CH2) including four multi-component peaks at ca. 2,967 cm−1, at ca. 2,923 cm−1, ca. 2,894 cm−1, and ca. 2,874 cm−1, respectively (B).
Nutrient composition and availability
Alfalfa hay TCHO were fractionated [19] by traditional wet chemical analysis and in situ nylon bag incubations in combination with modeling of nutrient availability in cattle as described in detail by Yari et al [20]. In summary, i) alfalfa hay carbohydrates were chemically fractionated into five fractions based on ruminal degradation characteristics according to Cornell Net Carbohydrate and Protein System (CNCPS) [19] ii) alfalfa was incubated in nylon bags in the rumen of three fistulated dry cows for 0, 4, 8, 12, 36, and 72 h, which enables the fractionation of carbohydrate into a washout, potentially degradable and undegradable fraction and carbohydrate residues over time were fitted to an exponential model to calculate disappearance kinetics [20]; iii) chemical and nylon bag output data were used to calculate carbohydrate degradation characteristics and nutrient supply in dairy cows with the DVE/OEB feed evaluation system [21] as described in detail by Yari et al [20]. Alfalfa hay lipid content was measured through ether extract procedure in Yari et al [1].
Statistical analysis
Univariate analysis was performed to test the effect of SM and CT on carbohydrate and lipid molecular structures using proc mixed in SAS [22] with the following statistical model:
Where Yijk is the observation of the dependent variable ijk; μ is the fixed effect of population mean for the variable; Bk is the random effect of sample pool (k = 2); CTi is the fixed effect of cutting time (i = 2; 06:00 h and 18:00 h); SMj is the fixed effect of stage of maturity (j = 3; early bud, late bud and early flower); CTi×SMj is the fixed effect of interaction between factor CT at level i and the factor SM at level j and eijk is the random error associated with the observation ijk. Forunivariate analysis, the average of five replicate sub-sample per each alfalfa hay was used (n = 12). Multi-treatment comparisons were performed with the Fisher’s protected least significant difference test by the LSMEAN statement in SAS 9.2 [22] with letter groupings obtained using the SAS pdmix800 macro. For the different statistical tests, significance was declared at p≤0.05 and trends at p≤0.10, unless otherwise stated.
Multivariate analysis CLA and PCA (Cluster analysis [CLA] and principal components analysis [PCA]) were performed on the FT/IR spectra of all sub-samples (n = 60; 12 samples×5 scans/sample) in the structural carbohydrate, NSCHO, lignin and lipid regions in Statistica 6.0 (StatSoft Inc., Tulsa, OK, USA) as described in detail by [16].
Simple statistics including mean, maximum, minimum and standard deviation for the nutrient profile and availability are presented in this paper while detailed results were published before [1,20]. Correlation between carbohydrate or lipid FT/IR molecular structures and nutrient profile and availability in ruminants were determined using the CORR procedure in SAS 9.2 [22] with the Pearson’s correlation coefficient (r).
RESULTS
Summary of alfalfa hays
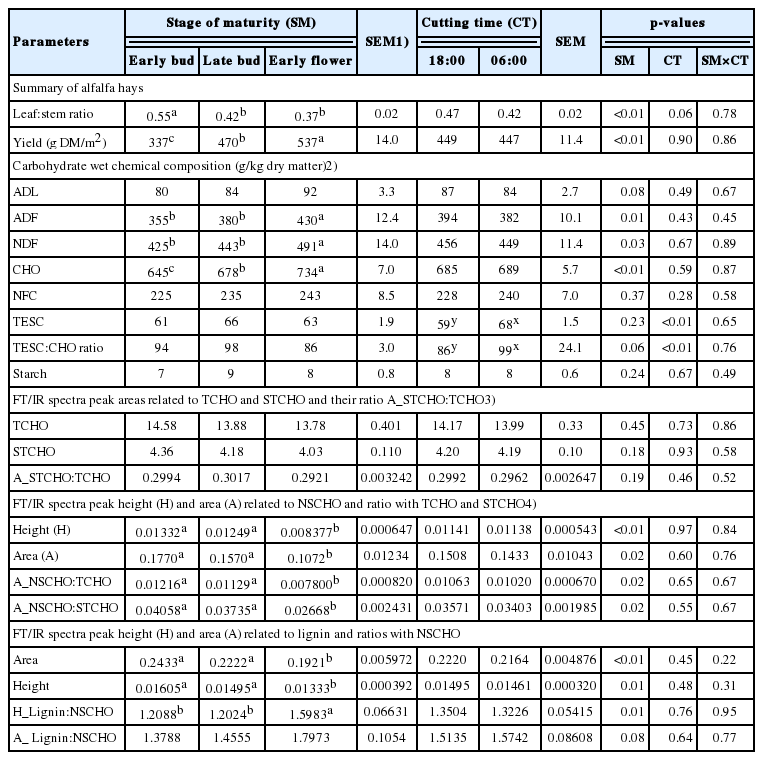
Alfalfa hay leaf to stem ratio decreased while yield (g/m2) increased with advancing SM (p<0.05; Table 1).
Effect of alfalfa stage of maturity and cutting time on FT/IR carbohydrate and lignin molecular structures and relationship with wet chemical nutrient profile
The FT/IR spectroscopic peak area related to TCHO and STCHO and ratio of STCHO to TCHO were similar among the three SM (Table 1). With advancing maturity, peak area and height related to NSCHO (ca.818 to 845 cm−1) and lignin, the ratio between peak area of NSCHO to TCHO and the ratio between peak area of NSCHO to STCHO decreased (p<0.05; Table 1) while ratio between peak height of lignin to NSCHO increased (p<0.05; Table 1) and ratio between peak area of lignin to NSCHO tended to reduce (p = 0.08; Table 1).
For alfalfa hay at the three SM, the spectra in the STCHO (Figure 3B, 3E, 3C ,3F), NSCHO (Figure 4A ,4D, 4C ,4F) and lignin (Figure 5A, 5D, 5C, 5F) region were not separated by CLA and PCA, while spectra in the structural carbohydrate, NSCHO and lignin region of alfalfa hay at early bud were for the largest part discriminated from alfalfa at early flower (NSCHO, Figure 4B, 4E; lignin, Figure 5B, 5E). The FR/IR spectra in the NSCHO (Figure 6A, 6B) region for alfalfa hay cut in the morning and afternoon was not separated by CLA and PCA.
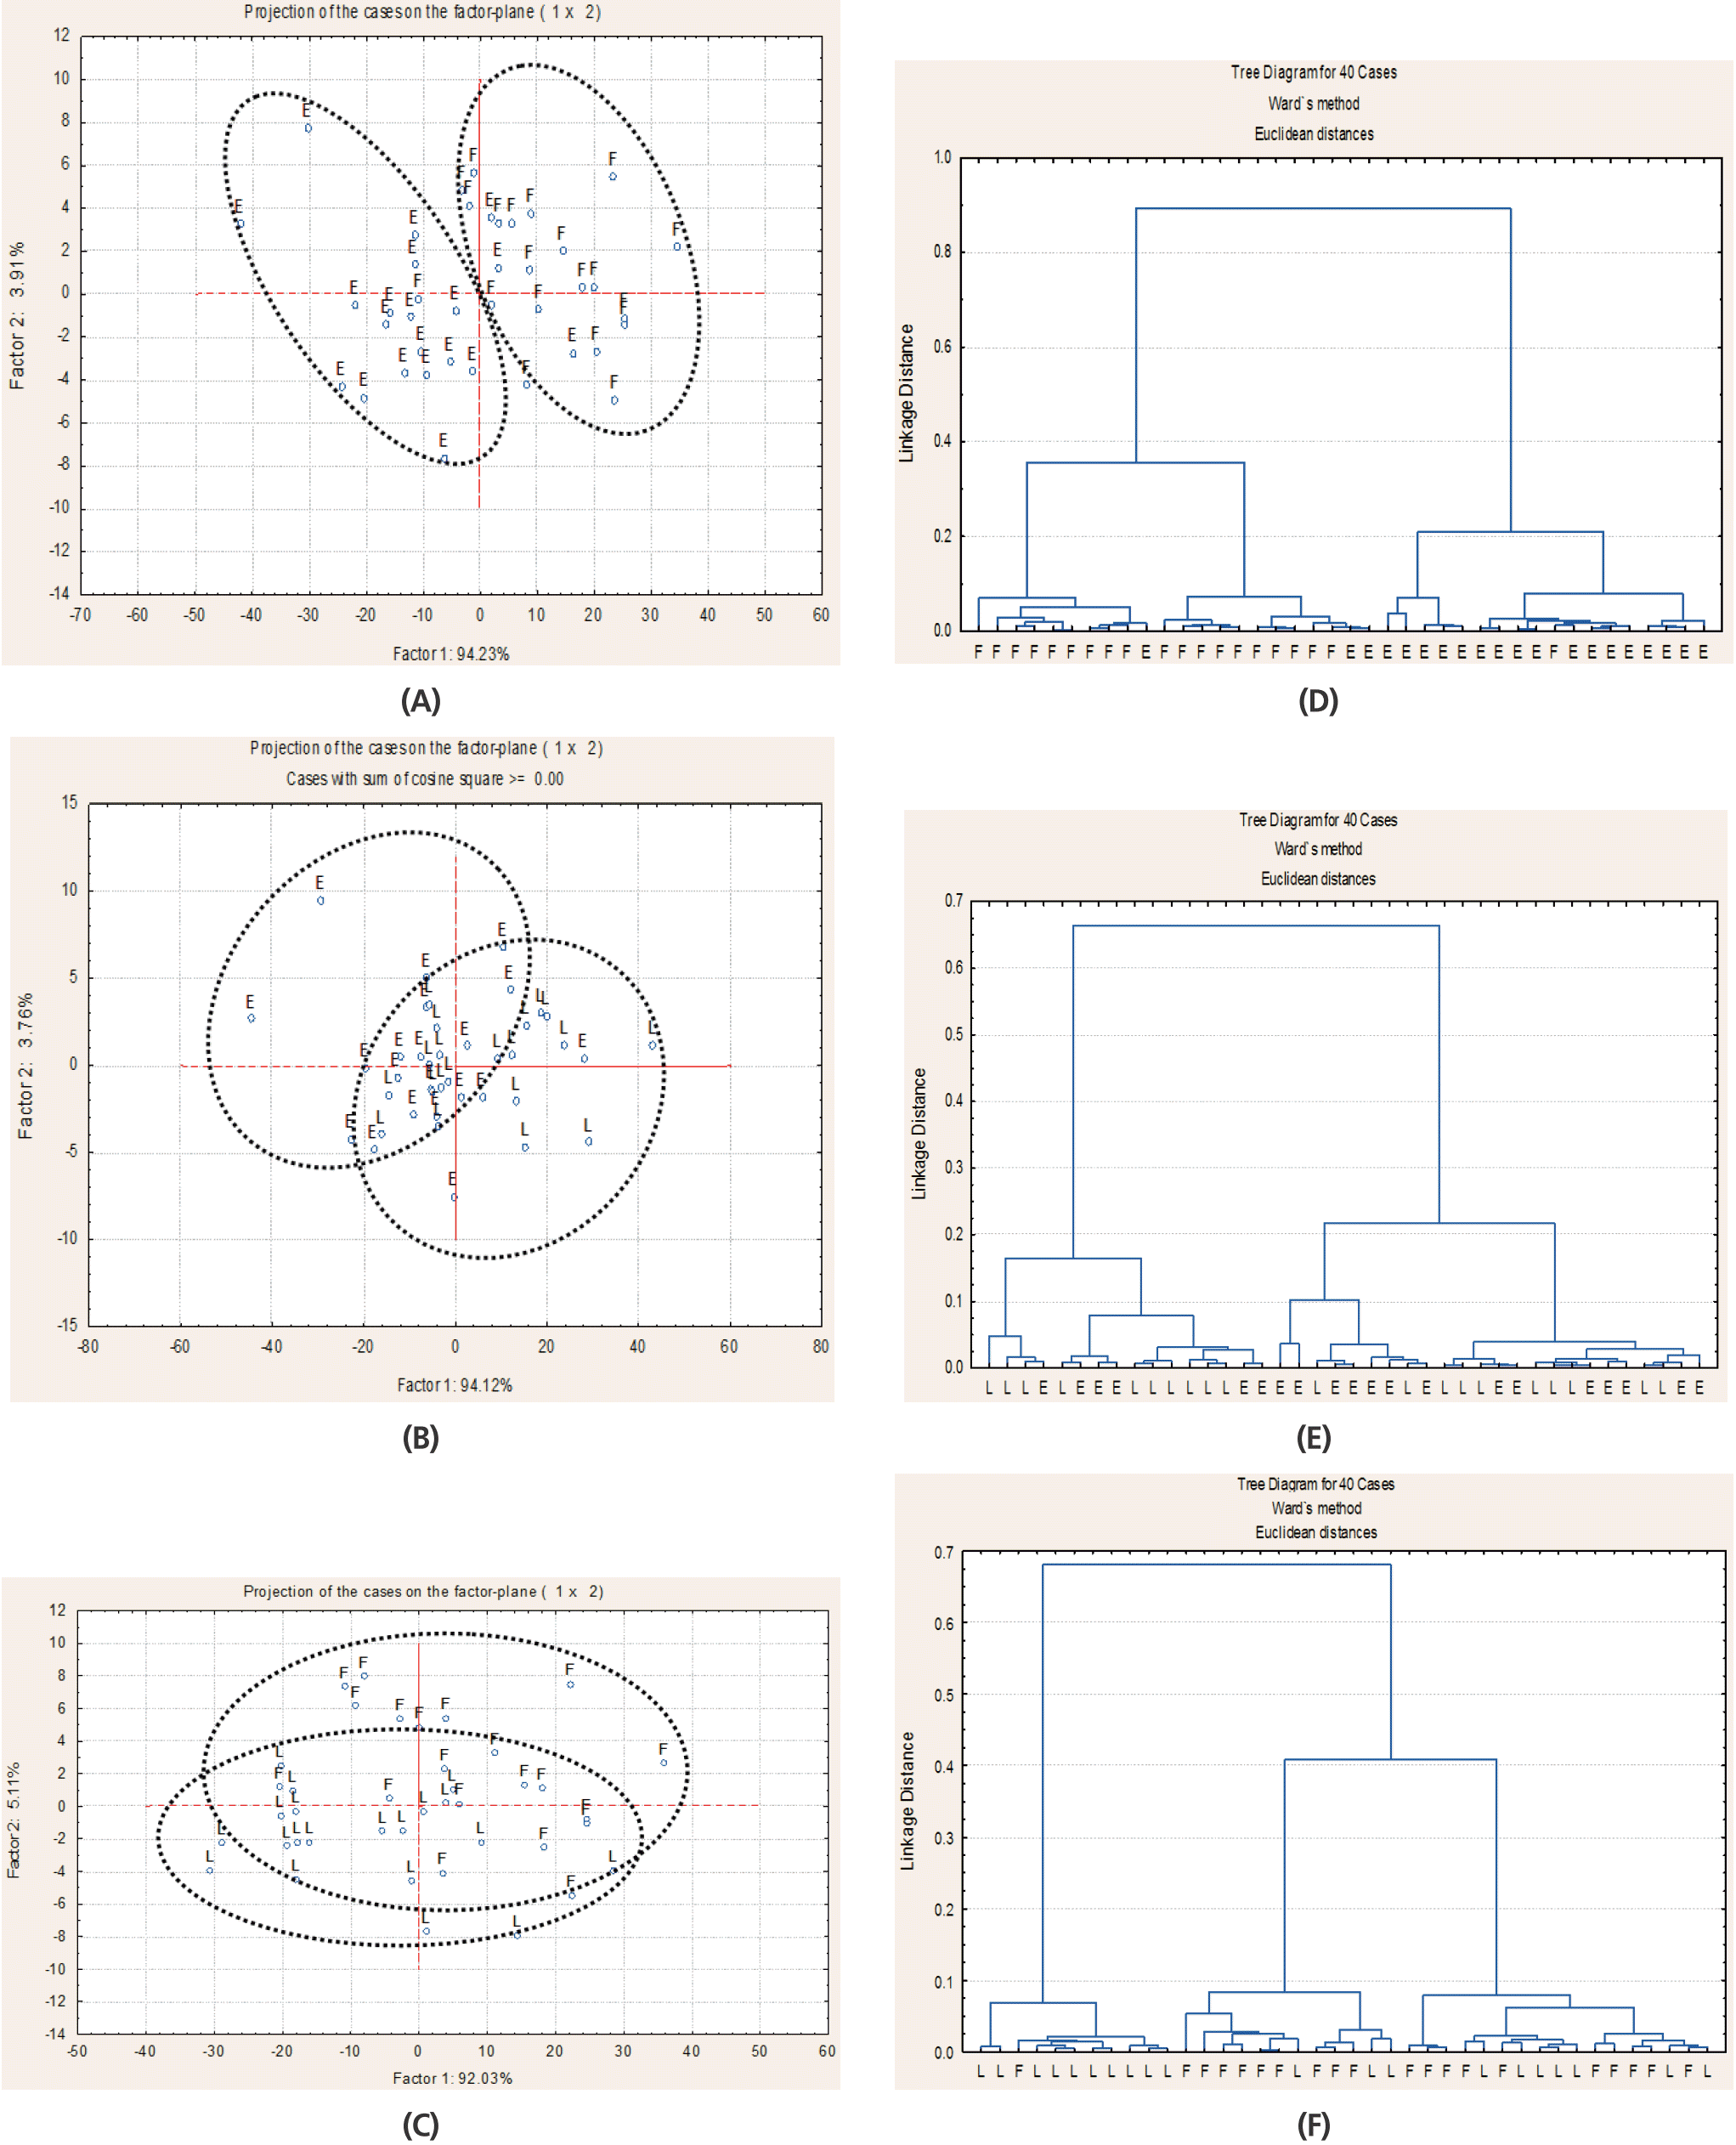
Multivariate analysis of Fourier transform infrared spectroscopy (FT/IR) spectrum in the region related to structural carbohydrates (ca. 1,188 to 1,485 cm−1) of alfalfa hay at early bud (E), late bud (L), and early flower (F) stage by principal component analysis (A, B, C) and cluster analysis (D, E, F); 20 spectra for each alfalfa hay maturity stage were used (2 cutting times×2 pooled blocks×5 sub-sample).

Multivariate analysis of Fourier transform infrared spectroscopy (FT/IR) spectrum in the region related to non-structural carbohydrates (ca. 818 to 845 cm−1) of alfalfa hay at early bud (E), late bud (L), and early flower (F) stage by principal component analysis (A, B, C) and cluster analysis (D, E, F); 20 spectra for each alfalfa hay maturity stage were used (2 cutting times×2 pooled blocks×5 sub-sample).

Multivariate analysis of Fourier transform infrared spectroscopy (FT/IR) spectrum in the region related to lignin (ca.1,504–1,539 cm−1) of alfalfa hay at early bud (E), late bud (L), and early flower (F) stage by principal component analysis (A, B, C) and cluster analysis (D, E, F); 20 spectra for each alfalfa hay maturity stage were used (2 cutting times×2 pooled blocks×5 sub-sample).
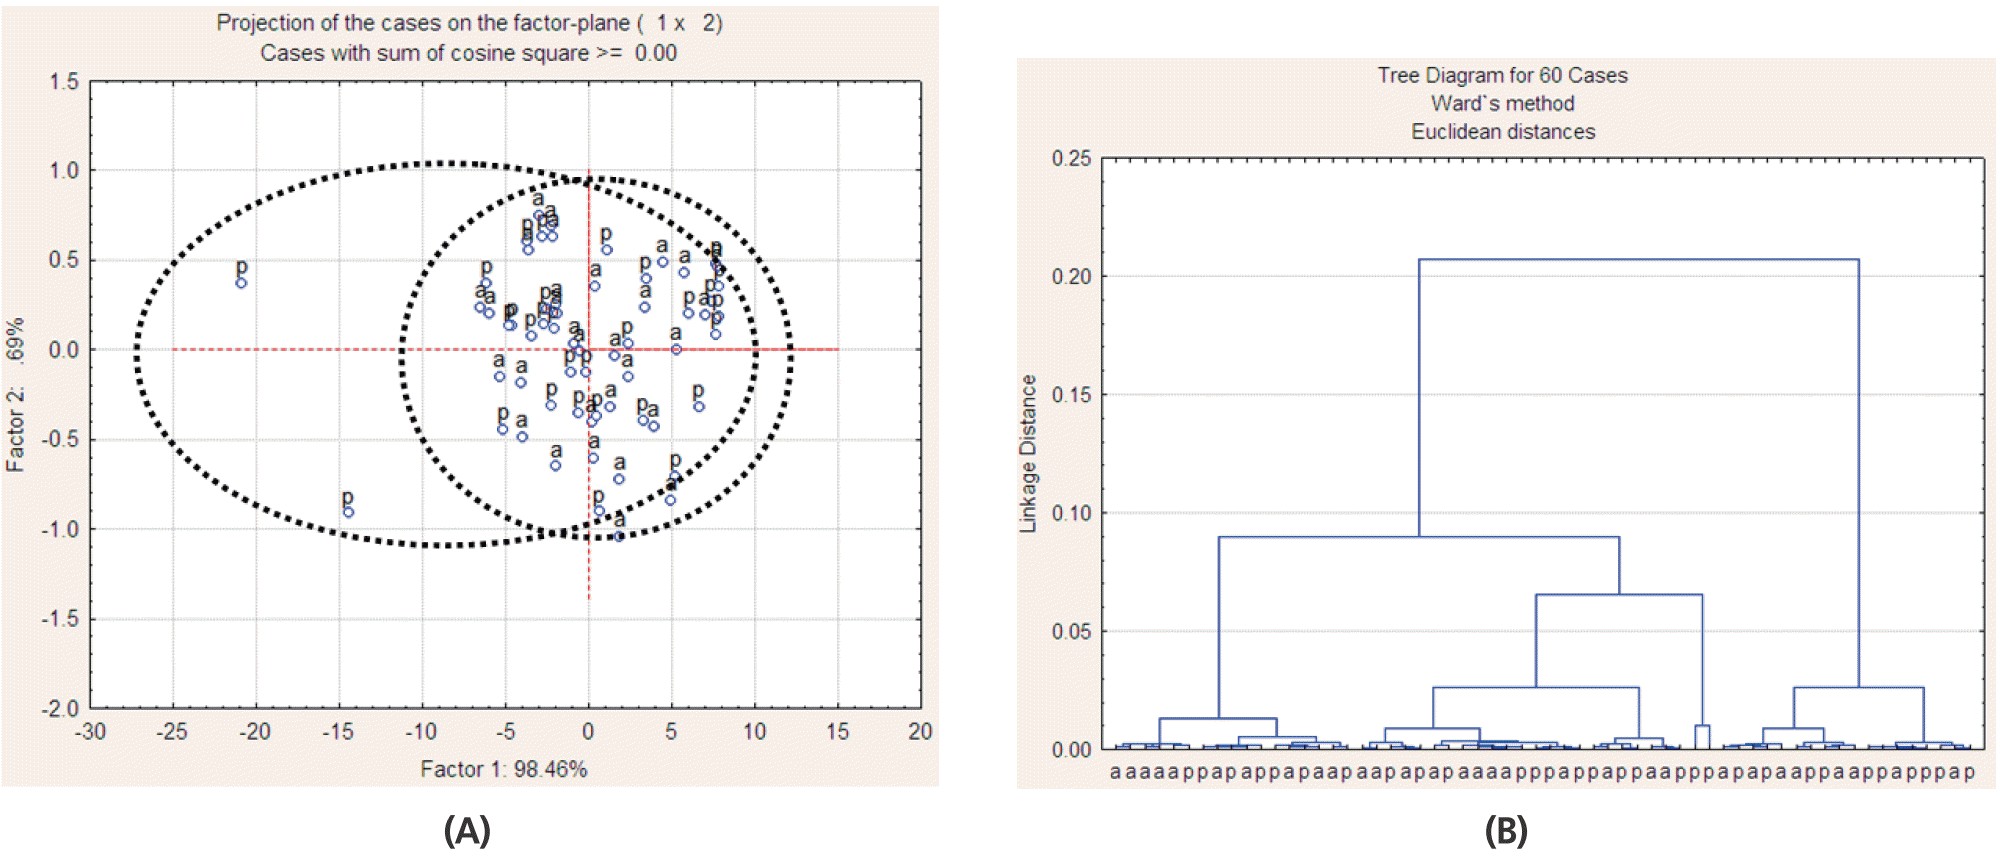
Multivariate analysis of Fourier transform infrared spectroscopy (FT/IR) spectrum in the region related to non-structural carbohydrates (ca.818–845 cm−1) of alfalfa hay cut in morning (a) and in afternoon (p) by principal component analysis (A) and cluster analysis (B); 30 spectra for each alfalfa hay cutting time were used (3 stages of maturity×2 pooled blocks×5 sub-samples).
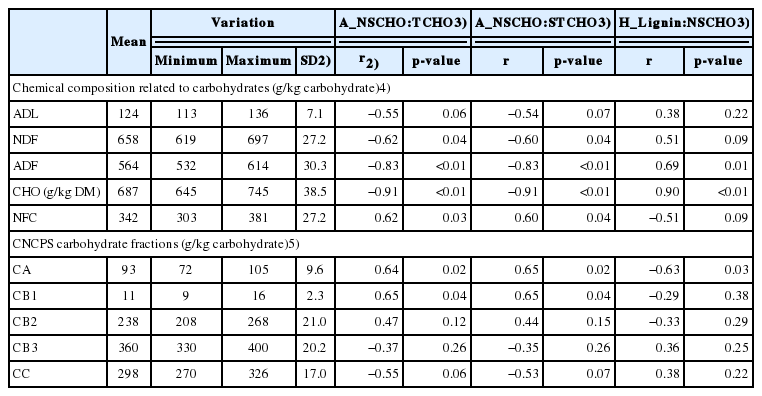
The FT/IR NSCHO to total carbohydrate and NSCHO to structural carbohydrate ratios correlated negatively (r≥−0.62) with neutral detergent fiber (NDF), acid detergent fiber (ADF) and TCHO by wet chemistry (p<0.05), while these ratios correlated positively (r≥0.51) with non-fiber carbohydrates (NFC), rapid ruminal degradable carbohydrate fraction and intermediate degradable carbohydrate fraction (CB1; p<0.05) and tended to have negative correlation with acid detergent lignin (ADL) and undigestible carbohydrate fraction (CC; r≥−0.51, p<0.10; Table 2). The FT/IR lignin to NSCHO ratio had a positive correlation with ADF and TCHO by wet chemistry (r≥0.69; p<0.01), tended to have a positive correlation with NDF (R = 0.51), had a negative correlation with fast degradable carbohydrate fraction (CA; r≤ −0.63; p<0.05) and tended to have a negative correlation with NFC (r = −0.51; p<0.10; Table 2).
Effect of alfalfa stage of maturity and cutting time on FT/IR lipid molecular structures
With advancing alfalfa hay maturity from early and late bud stages to early flowering, FT/IR spectroscopic peak area related to total lipid, peak height related to lipid CH2 asymmetric and symmetric functional groups and peak height ratio of CH3 to CH2 symmetric functional groups increased (p<0.05; Table 3). From early bud to late bud, absorbance intensity related to FT/IR lipid unsaturation group increased (p<0.05; Table 3) and from late bud to early flower it remained stable. Alfalfa hay cut in the afternoon tended to have a higher absorbance peak height related to CH2 symmetric functional group than alfalfa hay cut in the morning (p = 0.12, Table 3).

Chemical composition and FT/IR lipid molecular structures of alfalfa hay cut at three stages of maturity and in the afternoon and next morning
The FT/IR spectra in the lipid region of alfalfa hay at early bud was fully discriminated from alfalfa hay at early flower by CLA and PCA (Figure 7A, 7D), while hay at late bud was partly discriminated from hay at early flower (Figure 7C, 7F) and hay at early and late bud were not discriminated (Figure 7B, 7E).
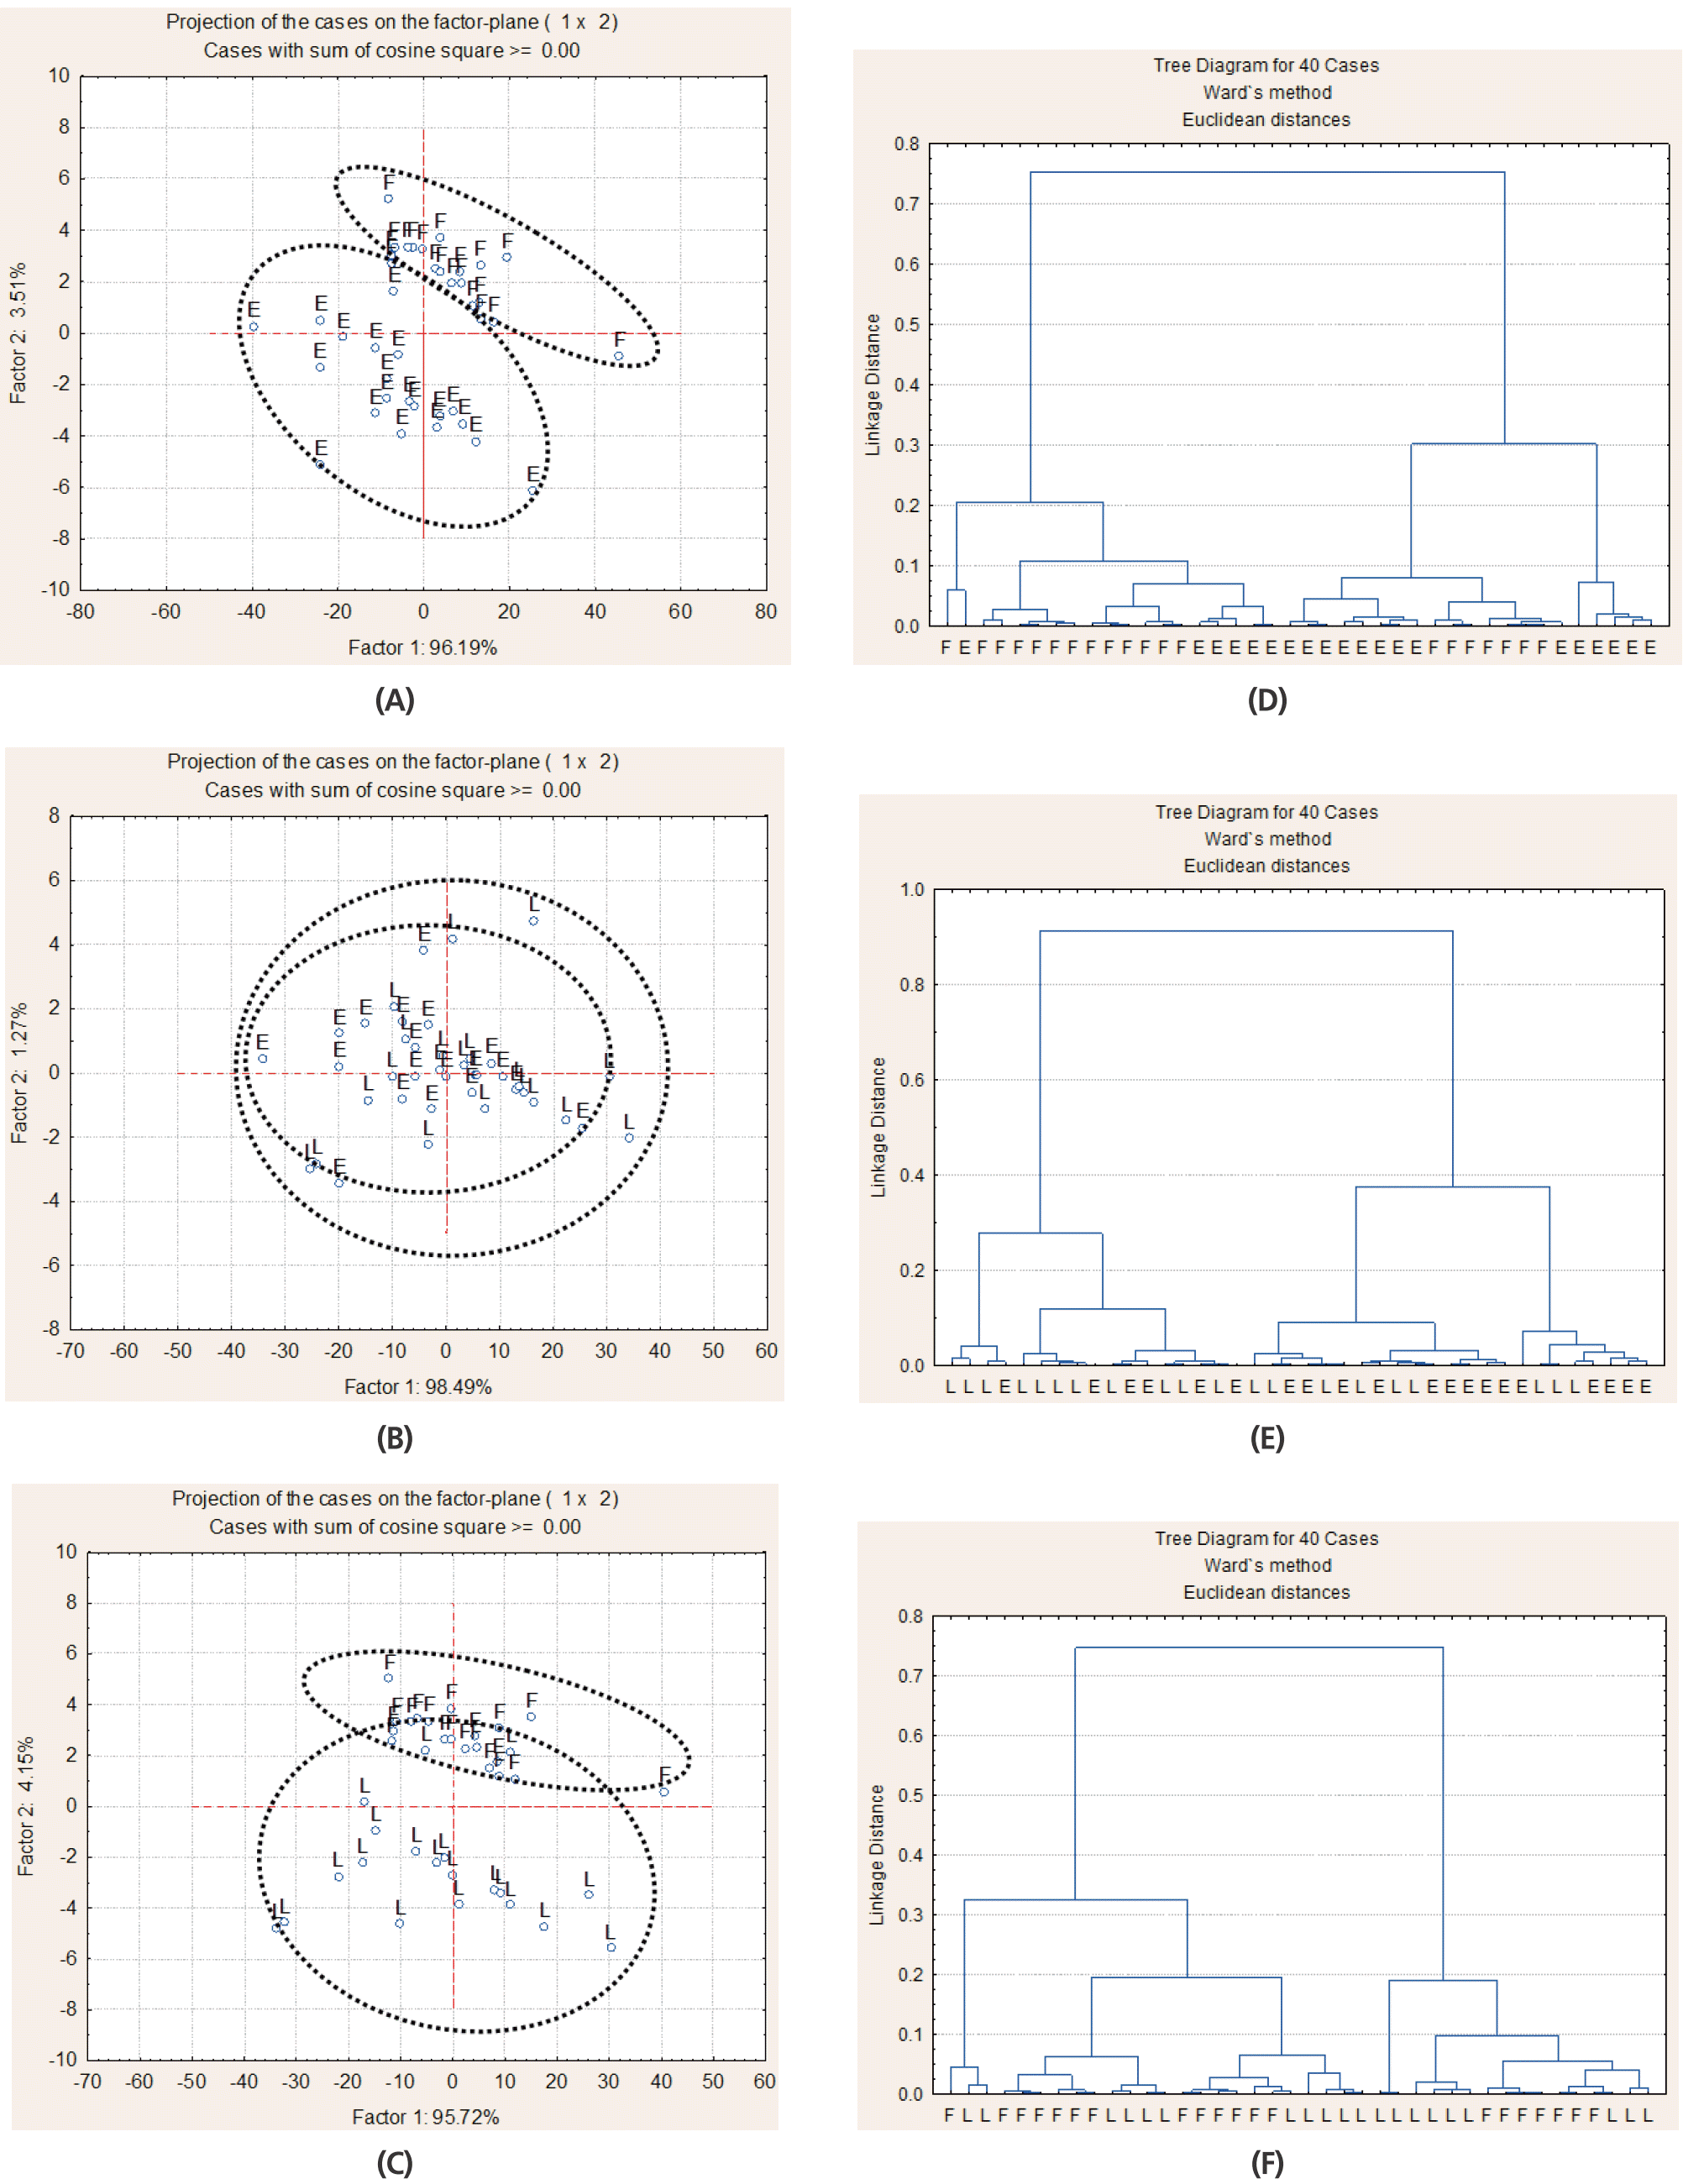
Multivariate analysis of Fourier transform infrared spectroscopy (FT/IR) spectrum in the region related to lipids (ca. 3,000 to 2,770 cm−1) of alfalfa hay at early bud (E), late bud (L), and early flower (F) stages by principal component analysis (A, B, C) and cluster analysis (D, E, F); 20 spectra for each alfalfa hay maturity stage were used (2 cutting times×2 pooled blocks×5 sub-sample).
Correlation of FT/IR spectroscopic features of alfalfa hay with ruminal degradation and predicted nutrient availability in cattle
The FT/IR NSCHO to total carbohydrate and NSCHO to structural carbohydrate ratios had a positive correlation with the in situ potentially degradable carbohydrates (DCHO; r≥0.59; p<0.05), a negative correlation with in situ undigestible carbohydrates (r≥−0.61; p<0.05), and tended to have a positive correlation with effective degradable carbohydrates (r = 0.55; p<0.10; Table 4). The FT/IR lignin to NSCHO ratio had a negative correlation (r≥−0.55) with in situ potential degradable NFC and in situ potential degradable TCHO (DCHO), a positive correlation (r = 0.67) with in situ undigestible total carbohydrate (UCHO) and tended to have a positive correlation with in situ undigestible NDF and the in situ washable fraction of NFC and total carbohydrate (r≥ 0.55; p<0.10; Table 4).

In situ carbohydrate degradation kinetics of alfalfa hay cut at three stages of maturity and in the afternoon and next morning and their correlation with FT/IR carbohydrate molecular structure ratios (n = 12)
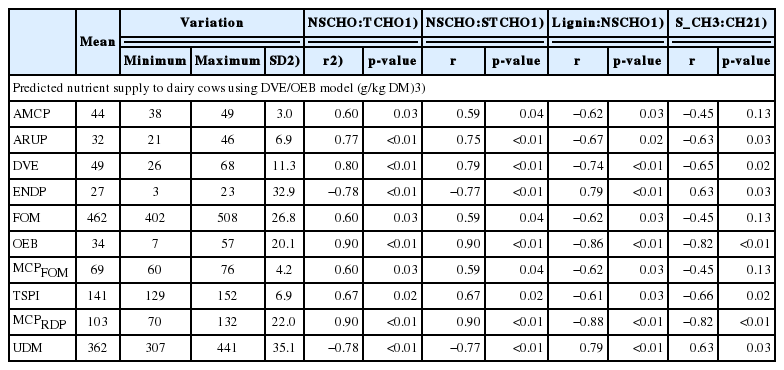
The FT/IR NSCHO to total carbohydrate and NSCHO to structural carbohydrate ratios had a positive correlation (r≥0.60) and FT/IR lignin to NSCHO and symmetric CH2 to CH3 ratios had a negative correlation (r≥−0.60) with predicted absorbed microbial protein (AMCP), absorbed rumen undegradable protein (ARUP), truly digested and absorbed protein in the small intestine (DVE), fermentable organic matter (FOM), degraded protein balance (OEB), microbial crude protein from fermentable organic matter (MCPFOM), true protein supplied to the small intestine (TSPI), and microbial crude protein from rumen degradable protein for cattle (MCPRDP). The FT/IR NSCHO to total carbohydrate and NSCHO to structural carbohydrate ratios had a negative correlation (r = −0.78) and FT/IR lignin to NSCHO and symmetric CH2 to CH3 ratios had a positive correlation (r = 0.78) with endogenous protein losses in the digestive tract and completely un-degradable DM (p<0.05; Table 5).
DISCUSSION
Effect of alfalfa stage of maturity and cutting time on FT/IR carbohydrate and lignin molecular structures and relationship with wet chemical nutrient profile
Results of alfalfa hay botanical traits and chemical composition (Table 1) were discussed in detail by Yari et al [1,20].
Generally, plant fiber and lignin increase with advancing maturity with a consequent reduction in feed digestibility [6]. The fiber fractions NDF and ADF and TCHO (wet chemistry) were lower in early and late bud than early flower alfalfa hay [1,20]. Also, CLA, and PCA separated alfalfa hay at early bud from alfalfa hay at early flower in the STCHO FT/IR spectra region, but alfalfa hay at late bud was not separated from either early bud or early flower hay. By univariate analysis, the FT/IR peak area from STCHO and TCHO and STCHO to total carbohydrate ratio did not differ among SM. The FT/IR peak area absorbance of 10.1 for total carbohydrate, 2.6 for STCHO and STCHO to total carbohydrate ratio of 0.25 for alfalfa at a vegetative stage, which were lower than for current alfalfa samples, has been reported by [23]. These might indicate that the FT/IR STCHO to total carbohydrate peak area ratio increases with advancing maturity as a result of higher structural carbohydrate accumulation due to higher stem proportion in whole alfalfa plant [1,20]. Others have also demonstrated that the results of peak quantification and multivariate analysis of the FT/IR spectrum can differ [16].
Forage NSCHO are easily digestible and readily available for the animal to use and they usually decrease with advancing maturity and increase during the day because of photosynthesis [6]. Current results suggest that FT/IR NSCHO reduced relative to STCHO, TCHO and lignin as alfalfa hay maturity advanced. By wet chemistry, soluble carbohydrates at DM basis did not change with SM or CT, while it decreased as a proportion of TCHO and also the ratios of soluble carbohydrates to NDF and ADF decreased with advancing maturity [20]. Therefore, the FT/IR NSCHO to STCHO and NSCHO to TCHO ratios correlated negatively with NDF, ADF, and total carbohydrate and positively NFC (wet chemistry).
The ADL content of alfalfa hay tended to increase with advancing maturity, which was in accordance with previous reported studies [1,2]. The FT/IR lignin to NSCHO ratio did not correlate with chemical ADL, while it correlated positively with NDF, ADF, and total carbohydrate and negatively with NFC (wet chemistry). The decreasing leaf:stem ratio with advancing maturity may explain changes in FT/IR carbohydrate and lignin molecular structures.
The FT/IR NSCHO and other carbohydrate molecular structures were not affected by alfalfa hay CT, while soluble carbohydrates by wet chemistry were higher in alfalfa hay cut in the afternoon [20]. Also, alfalfa hay cut in the afternoon had higher leaf portion and leaf:stem ratio [1,20] and FT/IR protein molecular structures were affected by CT. Previously, Jonker et al [23] found higher FT/IR vibration intensity in the carbohydrate and protein regions for alfalfa leaves at a vegetative stage cut at 18:00 h compared with alfalfa cut at 07:00 h. However, in this study we used whole alfalfa plant samples at more advanced SM, which might have diluted the effect and the forage was dried for 15 days which might already have degraded the soluble carbohydrates.
Effect of alfalfa stage of maturity and cutting time on FT/IR lipid molecular structures
The lipid content measured as ether extract remained stable with advancing maturity. This was consistent with our previous study with alfalfa hays harvested at the same three SM while field dried [4]. In a western Canadian study, Yu et al [2] reported a similar ether extract concentration for alfalfa hay at early bud to late bud while it decreased from late bud to early flower. Other studies on alfalfa hay forage found no difference in ether extract across SM [24–27]. Unlike the stable ether extract across SM, total lipid vibration intensity peak area, CH2 asymmetric stretching, CH2 symmetric stretching, S_CH3:CH2 symmetric stretching ratio and lipid unsaturation group differed across SM. In some other cases, FT/IR revealed differences for lipid molecular structures, while wet chemical composition analysis did not differentiate between treatments, likely because FT/IR spectroscopy investigate molecular structural features, while chemical composition analysis is a crude measurement [16,18]. Several studies found decreased total fatty acids content and unsaturated fatty acids concentrations with advancing maturity in grasses, probably because leaves usually have higher fatty acids concentration compared with stems and leaf:stem ratio decrease as plant matures [11,12]. A recent meta-analysis revealed that the fatty acid composition of forage changes with advancing maturity [28], which likely affects the FT/IR spectrum. However, data on fatty acids composition of alfalfa leaves and stems and their changes across maturities is not available to our knowledge. Further research is required to determine this and its relationship with FT/IR features related to lipids.
The characteristics of lipid chain length, branching and unsaturation can be investigated by comparing contributions of lipid CH3 and CH2 functional groups [16,18]. With advancing maturity, FT/IR CH3 to CH2 symmetric stretching ratio increased while CH3 to CH2 asymmetric stretching ratio remained similar. Previously, autoclaving flaxseed at 120°C for 20, 40, and 60 min was found to decrease FT/IR CH2 to CH3 asymmetric stretching ratio with increasing autoclaving time [17] while in another study heat treatment (wet vs dry) did not affect CH3 to CH2 asymmetric stretching ratio [18]. In the case of lipids, both FT/IR and chemical analysis revealed similar results for alfalfa hay CT in this study.
Correlation of FT/IR spectroscopic features of alfalfa hay with ruminal degradation and predicted nutrient availability in cattle
The chemical and/or in situ carbohydrate and protein fractionations are commonly used to predict nutrient supply in cattle [20,21]. The molecular structural ratios of NSCHO:TCHO and NSCHO:STCHO correlated positively, and lignin:NSCHO and S_CH2:CH3 ratios correlated negatively, with digestible carbohydrate fractions in situ DCHO, CA, and CB1 and with predicted availability of protein and energy in the rumen and small intestine of cattle (AMCP, ARUP, DVE, FOM, OEB, MCPFOM, TSPI, MCPRDP) and opposite correlations with undigestible fractions UCHO and CC. These findings, indicate that FT/IR spectra of alfalfa hay with more NSCHO relative to total carbohydrate, STCHO and lignin and with more CH2 relative to CH3 symmetric stretching will improve predicted nutrient availability of alfalfa hay in dairy cows. These results are consistent with findings that feeding alfalfa hay cut at earlier maturities as part of a total mixed ration increased intake rate and nutrient supply to high producing dairy cows in early lactation compared with cows fed alfalfa hay cut at later maturities [4]. However, from the point view of agronomy, total forage yield per square meter was lower for alfalfa hay harvested at earlier maturities compared with alfalfa hay cut at later maturities, which needs to be taken into consideration for decision making.
Correlations of the FT/IR molecular structure ratios above were in general greater with nutrient supply predicted according to the DVE/OEB system [21], and also with in situ total CHO degradation characteristics, than with in situ NDF and NFC degradation characteristics in the current study. The in situ NDF and NFC degradation characteristics relate only to the NDF and NFC fraction of the feed, while the DVE/OEB system predicts nutrient supply to the animal based on total organic matter and CP digestion kinetics. Forage protein is in general positively related to total feed digestibility, which both decrease with advancing maturity [1,4]. The FT/IR molecular structure ratio features (i.e. molecular bonds) therefore appear to relate more to overall feed availability of both energy and protein rather than for specific carbohydrate fractions. Previously, we found also that predicted protein and energy availability in the rumen and small intestine of cattle correlated strongly with FT/IR protein molecular structures [13].
Jonker et al [23] found that carbohydrate and lipid spectroscopic molecular structures detected by FT/IR in alfalfa leaves harvested at vegetative stage (common cultivar, cultivar selected for low initial rate of digestibility, and three transgenic populations with enhanced flavonoid pathway) affected in vitro foam formation and stability, in relation to bloat in ruminant. In grain and dried distiller grains with solubles [7,29] reported that FT/IR total carbohydrate, structural carbohydrate, NSCHO and lignin correlated with different CNCPS carbohydrate fractions and ruminal and intestinal nutrient availability in cattle. They suggested that FT/IR spectroscopic carbohydrate molecular features could be used as a quick predictor for the nutritional value of feeds in cattle. The range in feeds and chemical composition was much larger in those studies (different grain types only [high starch, low NDF and CP), dried distilleries grain with soluble only [low starch, high CP, and NDF], and mixtures of the two), while in the current study only alfalfa hay was included. Also, FT/IR spectra of very different feed type cannot necessarily be compared directly [30]. In the case of forage therefore, more information is required to investigate the potential of FT/IR spectroscopy as a rapid method to predict nutrient availability for ruminant nutrition.
In conclusion, The FT/IR spectroscopic features in alfalfa hay related to carbohydrate, lignin and lipid molecular structures changed from early and late bud stages to early flower stage, while these molecular structures remained similar between alfalfa hay cut in the morning and afternoon. The FT/IR carbohydrate, lignin and lipid molecular structures and their ratios in alfalfa hay had mostly low correlations with wet chemistry nutrient profile, but medium to strong correlations with ruminal and intestinal predicted nutrient availability in cattle. Alfalfa hay with more FT/IR NSCHO relative to total carbohydrate, STCHO and lignin and with more CH2 relative to CH3 symmetric stretching will probably resulted in higher nutrient availability for cattle. However, more studies are required to test current findings and against data from animal trials.
ACKNOWLEDGMENTS
The authors would like to thank the staff of the Dairy and Research Farm, Ferdowsi University of Mashhad, for their help with harvesting alfalfa hay. The authors would like to thank Z. Niu (University of Saskatchewan, Canada) for his assistance with chemical composition analysis, in situ trial and FT/IR spectroscopy.
Notes
CONFLICT OF INTEREST
We certify that there is no conflict of interest with any financial organization regarding the material discussed in the manuscript.
