Effects of aging and freezing/thawing sequence on quality attributes of bovine Mm. gluteus medius and biceps femoris
Article information
Abstract
Objective
The effects of aging and freezing/thawing sequence on color, physicochemical, and enzymatic characteristics of two beef muscles (Mm. gluteus medius, GM and biceps femoris, BF) were evaluated.
Methods
Beef muscles at 3 d postmortem were assigned to four different combinations of aging and freezing/thawing sequence as follows; aging at 2°C for 3 wk (A3, never-frozen control), freezing at −28°C for 2 wk then thawing (F2, frozen/thawed-only), aging at 2°C for 3 wk, freezing at −28°C for 2 wk then thawing (A3F2), and freezing at −28°C for 2 wk, thawing then further aging at 2°C for 3 wk (F2A3).
Results
No significant interactions between different aging/freezing/thawing treatments and muscle type on all measurements were found. Postmortem aging, regardless of aging/freezing/thawing sequence, had no impact on color stability of frozen/thawed beef muscles (p<0.05). F2A3 resulted in higher purge loss than F2 and A3F2 treatments (p<0.05). A3F2 and F2A3 treatments resulted in lower shear force of beef muscles compared to F2 (p<0.05). Although there was no significant difference in glutathione peroxidase (GSH-Px) activity, F2A3 had the highest β-N-acetyl glucominidase (BNAG) activity in purge, but the lowest BNAG activity in muscle (p<0.05). GM muscle exhibited higher total color changes and purge loss, and lower GSH-Px activity than BF muscle.
Conclusion
The results from this present study indicate that different combinations of aging/freezing/thawing sequence would result in considerable impacts on meat quality attributes, particularly thaw/purge loss and tenderness. Developing a novel freezing strategy combined with postmortem aging will be beneficial for the food/meat industry to maximize its positive impacts on tenderness, while minimizing thaw/purge loss of frozen/thawed meat.
INTRODUCTION
Freezing has been extensively used as one of the most common preservation methods for long-term storage of meat products. Despite its primary advantage in extending shelf-life, frozen/thawed meat has been often considered to be appearing inadequate meat quality attributes in comparison to never-frozen fresh meat. It has been well documented that freezing results in muscle structural damages by ice crystal formation and subsequent water loss during thawing, which could, in turn, negatively affect color characteristic, water-holding capacity (WHC), oxidation stability, and/or eating palatability [1].
Recent studies have suggested that the quality attributes of frozen/thawed meat could be improved by allowing sufficient postmortem aging of meat prior to freezing. Kim et al [2–4] reported that aging prior to freezing could enhance WHC and tenderness of frozen/thawed meat. Furthermore, Kim et al [2] also reported that aged/frozen/thawed beef was more color stable compared to frozen/thawed-only meat. As an opposite concept, freezing/thawing first then-aging has been suggested as an alternative way to improve WHC and tenderness of frozen/thawed meat [5,6].
Taken together, these previous observations could lead us postulate that not only each aging, freezing and/or thawing process itself has impacts on meat quality attributes, but also the sequence (or combination) of each process may result in different quality characteristics of frozen/thawed meat. In practice, retail cuts from sirloin subprimal (primarily consisted of gluteus medius (GM) and biceps femoris (BF) muscles) are typically used in the foodservice and food retail industries. While inadequate tenderness has been frequently identified as a quality issue of the sirloin cut [7], combination of aging/freezing has been suggested as a possible method to improve tenderness of the sirloin cut [8]. However, there has been no available literature on the effects of different combinations of aging/freezing/thawing sequence on meat quality attributes of frozen/thawed sirloin cut.
Therefore, the objective of this study was to evaluate the effects of different aging and freezing/thawing combination sequences on color, WHC and tenderness of two beef muscles (GM and BF) in the sirloin subprimal. In addition, intracellular enzyme activities in purge and beef muscles were determined to evaluate the degree of intracellular damages induced by different combination with aging/freezing/thawing.
MATERIALS AND METHODS
Raw materials and sampling
Two bovine muscles (M. gluteus medius, GM and biceps femoris, BF) were removed from one side of three steer carcasses (A maturity; United States Department of Agriculture (USDA) Choice quality grade) at 3 d postmortem. Each muscle was cut into four sections (approximately 3 cm thickness) and vacuum-packaged individually. The vacuum-packaged samples were randomly assigned to four different combinations of aging/freezing/thawing treatments as follows; aging at 2°C for 3 wk (A3, never-frozen control), freezing at −28°C for 2 wk then thawing (F2, frozen/thawed-only), aging at 2°C for 3 wk, freezing at −28°C for 2 wk then thawing (A3F2), and freezing at −28°C for 2 wk, then thaw/aging at 2°C for 3 wk (F2A3). All frozen beef samples (F2, A3F2, and F2A3) were thawed in a cold room at 2°C for 24 h. After each assigned aging/freezing/thawing period, purge was collected immediately after opening the vacuum packages to measure enzymatic analyses. The weight of each sample was recorded after blotting with paper towel to calculate the amount of purge/thaw loss. Each section was cut into two steaks (approximately 1.5 cm thickness). To determine color characteristics (initial surface color, bloom development, and color stability), one steak was placed on Styrofoam tray, over-wrapped with a commercial oxygen-permeable PVC film, and displayed for 7 d under continuous fluorescent natural white light (3,500 K) in a 2°C cooler. The other steak was used for physicochemical and enzymatic analyses.
Color measurement
Color measurement was performed using a Hunter MiniScan EZ colorimeter (Hunter, Reston, VA, USA) equipped with a 25 mm (diameter) measuring. The setting for the illuminant was D65 source, and the observer was standard 10°. Calibration of the instrument was conducted according to manufacturer’s standard manual. To determine bloom development, surface color of newly cut steak was measured at 0, 30, and 60 min after PVC-overwrap packaging for display. Color stability was determined daily for 7 d of the simulated retail display. Commission Internationale de l’Eclairage (CIE) L* (lightness), a* (redness), and b* (yellowness) values were taken from three random locations of muscle surface. Hue angle, chroma, and total color change (ΔE) were calculated using the following expression [9,10].
pH measurement
The pH of beef muscles was measured in triplicate using an inserting type pH meter (HI 99163, Hanna Instruments Inc., Woonsocket, RI, USA).
Water-holding capacity
Purge/thaw loss was estimated by calculating differences between initial weight before vacuum-packaging and weight after aging and/or freezing/thawing process. Drip loss was determined according to the procedure described by Honikel [11]. To determine cooking loss, beef steaks were cooked on an electric griddle (surface temperature of 135°C) until the targeted core temperature reached 71°C, which was monitored by using a digital temperature logger (OctTemp2000, MadgeTech, Inc., Warner, NH, USA) with a thermocouple (T-type, Omega Engineering, Stamford, CT, USA). Cooking loss was determined by calculating the weight differences before and after cooking as follows; cooking loss (%) = ([weight of raw sample {g} − weight of cooked sample {g}]/weight of raw sample [g])×100.
Warner-Bratzler shear force
Shear force values of the cooked sample were determined in six cores (1.27 cm diam.) per replicate by using a Warner-Bratzler shear attachment on a texture analyzer (TA-XT Plus, Stable Micro System Ltd., Surrey, UK). Data were collected and analyzed from the shear force values to obtain the maximum force (kg) required to shear through each sample.
Intracellular enzyme activity
Muscle extracts were prepared with the method of Renerre et al [12] described by Kang et al [13]. Briefly, beef muscle (5 g) was homogenized with 50 mM phosphate buffer (pH 7.0) for glutathione peroxidase (GSH-Px) activity assay or 0.1 M sodium citrate buffer (pH 4.5) for β-N-acetyl-glucosaminidase (BNAG) activity assay. The mixture was centrifuged at 1,000×g for 15 min (2°C) and filtered through Whatman paper (No. 1). In terms of enzymatic analyses for purge collected, each purge was diluted with 10 volume (v/v) of each buffer used in the assay. GSH-Px and BNAG activity were measured in accordance with the method of Flohé and Günzler [14] and Benjakul and Bauer [15] described by Kang et al [13]. The results of enzyme activity were expressed as unit/g muscle and unit/mL purge, respectively.
Statistical analysis
The experimental design of this study was spilt-plot design, where the whole plot was used to investigate the muscle type effect (GM and BF), and the sub-plot was for each aging and freezing/thawing treatment with random assignment (A3, F2, A3F2, and F2A3). All data were analyzed using the PROC MIXED procedure of SAS. The model included the fixed effects of muscle type, aging and freezing/thawing treatment, and their interaction, and random effects were animal and animal×aging and freezing/thawing treatment. Regarding bloom development and color stability, bloom time and display time were included as a fixed effect, respectively. Least squares means for all traits were separated (F test, p<0.05) by using least significant differences generated by a probability differences (PDIFF) option.
RESULTS AND DISCUSSION
Color characteristics
Initial surface color (Table 1), bloom development (Figure 1), and color stability (Figure 2) were evaluated to determine the effects of aging and freezing/thawing sequence on color characteristics of frozen/thawed beef muscles (GM and BF).

Initial surface color of beef muscles in different aging and freezing/thawing sequences
Bloom development of two beef muscles in different aging and freezing/thawing sequence. (A) CIE L* (lightness), (B) CIE a* (redness), (C) CIE b* (yellowness), (D) Chroma, and (E) Total color change (ΔE). 1) Treatments: A3 (never-frozen control), aging at 2°C for 3 wk; F2 (frozen/thawed-only), freezing at −28°C for 2 wk and thawing; A3F2, aging at 2°C for 3 wk, freezing at −28°C for 2 wk, and thawing; F2A3, freezing at −28°C for 2 wk, then thaw/aging at 2°C for 3 wk. 2) Muscle type: GM, M. gluteus medius and BF, M. biceps femoris. 3) Blooming time: color measurement time after freshly cutting. a,b Different letters between muscle types are significantly different (p<0.05). x–z Different letters between blooming times are significantly different (p<0.05).
Color stability of two beef muscles in different aging and freezing/thawing sequence. (A) CIE a* (redness), (B) Hue angle (discoloration). A3 (never-frozen control), aging at 2°C for 3 wk; F2 (frozen/thawed-only), freezing at −28°C for 2 wk and thawing; A3F2, aging at 2°C for 3 wk, freezing at −28°C for 2 wk, and thawing; F2A3, freezing at −28°C for 2 wk, then thaw/aging at 2°C for 3 wk.
As seen in Table 1, there was no interaction between aging/freezing/thawing treatment and muscle type on initial surface color (p>0.05). Although freezing/thawing (F2, A3F2, and F2A3) resulted in numerically lower CIE L* (lightness), a* (redness), and b* (yellowness) values of beef muscles compared to the never-frozen control beef samples (A3), no significant differences between the frozen/thawed samples were found. Further, the initial surface color was not affected by muscle types (p>0.05).
In terms of bloom development, no significant interaction between aging/freezing/thawing treatment and muscle type on all color parameters were found. The extent of changes in color parameters during blooming were not affected by the aging/freezing/thawing treatment (Figure 1A–E). Regarding muscle type, GM muscle exhibited slightly higher ΔE (total color change) than BF muscle during blooming (p<0.05). Color parameters, such as redness, yellowness, chroma (indication of saturation) and ΔE rapidly increased during the blooming time (p<0.05), whereas there were no significant changes in lightness (p>0.05).
A decrease in color stability of two beef muscles during simulated retail display was observed, as expected. The surface redness of beef muscles decreased gradually during display (p<0.05; Figure 2A). In particular, a distinct reduction in redness of beef muscles from freezing/thawing treatments (F2, A3F2, and F2A3) compared to never frozen control (A3) was observed after 2 d of display (p<0.05). Following the similar trend of redness, hue angle values (indication of discoloration) of all treatments increased dramatically after 4 d of display (p<0.05; Figure 2B). Although there was no significant difference in hue angle values between all freezing/thawing treatments, beef muscles assigned to A3 showed the least hue angle values followed by F2A3, A3F2, and F2 at the end of display. It has been well established that freezing/thawing results in adverse impacts on color stability, which is likely due to myoglobin denaturation, loss of metmyoglobin reducing activity, and/or the presence of other prooxidant factors, mainly lipid oxidation [1]. However, it is of our interest to note that the beef muscles assigned to F2 (frozen/thawed-only; no aging) showed the numerically highest hue angle values compared to other frozen/thawed treatments. This observation could indicate that postmortem aging might have a positive impact on color attributes of frozen/thawed meat. In fact, Kim et al [2] reported that remaining activity of mitochondrial respiratory enzymes during frozen storage could be related limited myoglobin oxygenation and subsequent formation of metmyoglobin (oxidized form of myoglobin) of frozen/thawed meat. Thus, they further suggested that improved color stability of aged/frozen/thawed meat compared to frozen/thawed only meat might be attributed to the decrease in mitochondrial respiratory enzyme activities through a sufficient aging prior to freezing [2]. A further study to confirm this postulation would be warranted.
pH value
The pH of beef muscles was affected by different combination of aging/freezing/thawing (p = 0.0049) and muscle type (p = 0.0028), but no interaction between those main effects was found. The pH of beef GM and BF muscles was 5.70 and 5.75 (p<0.05), respectively. A3 resulted in a significantly higher pH value compared to other aging/freezing/thawing treatments (F2, A3F2, and F2A3). Leygonie et al [1] suggested that a decrease in pH of frozen/thawed meat could be related to the release of hydrogen ion from denatured proteins and/or an increase in hydrogen ions concentration due to water loss. Our finding indicates that freezing/thawing could slightly decrease the pH of beef muscles, regardless of aging/freezing/thawing sequence.
Water-holding capacity
There were no interactions between aging/freezing/thawing treatment and muscle type on WHC of beef muscles (p>0.05). The different combinations of aging/freezing/thawing significantly affected purge loss (p<0.0001), drip loss (p = 0.0022), and cooking loss (p = 0.0083). Regarding muscle effect, GM muscle exhibited higher purge loss than BE muscle (p<0.05), but no significant differences in drip loss and cooking loss between two muscles were found.
Beef samples assigned to freezing/thawing treatments (F2, A3F2, and F2A3) had a significantly higher purge loss than never frozen control (A3), which was likely associated with the inclusion of additional thaw loss. However, among frozen/thawed beef samples, it is of interest to note that greater purge loss was observed in F2A3 (9.77%) compared to F2 (5.74%) and A3F2 (4.96%) (p<0.05). This observation clearly indicates the impacts of different sequence of aging/freezing/thawing on purge loss of frozen/thawed beef samples. The aged first then-frozen/thawed beef samples (A3F2) had the numerically lowest purge loss among other frozen/thawed beef samples. Previous studies have suggested that aging prior to freezing could improve WHC of frozen/thawed meat, particularly thaw loss [2,3,16,17]. Farouk et al [16] explained this phenomenon as “sponge effect” that aging prior to freezing decreased purge/thaw loss of meat samples through the structural disintegration by proteolysis and subsequent disruption of drip channel, which, in turn, entraps the free water in muscle tissue. However, in this current study, when beef samples were frozen first then-thaw/aged (F2A3), it actually resulted in severe water loss compared to beef samples assigned to F2 (frozen/thawed only) and A3F2. Given that freezing/thawing process causes the cryogenic damage to muscle structure (particularly space between myofibrils and sarcolemma), it could be postulated that proteolysis after freezing/thawing might result in enlarging more drip channels between myofibrils, and consequently inducing more exudates/purge loss from muscle compared to aged and frozen/thawed meat (A3F2).
Conversely, when it comes to drip loss, F2A3 exhibited the lowest drip loss among all treatments (p<0.05). This observation could be explained in that the considerable amount of free water had been already released from meat as purge, and thus there might be relatively less free water remaining in the muscle structure when drip loss was measured. A higher cooking loss of A3F2 (36.5%) and F2A3 (33.5%) was found when compared to that of A3 (31.0%) and F2 (29.1%) (p<0.05).
Tenderness (Warner-Bratzler shear force)
A significant aging/freezing/thawing effect on shear force values of GM muscle was found (p = 0.0297; Table 2). The beef samples assigned to F2 showed the highest shear force values followed by A3F2, F2A3, and A3, which was likely due to aging effect. In addition, although there was no significant difference, freezing/thawing and further aging (F2A3) resulted in a lower shear force than aging prior to freezing/thawing (A3F2). In previous studies, aged and frozen/thawed meat exhibited intermediate shear force value between aged-only and frozen/thawed meats [2,4]. Furthermore, the lower shear force of F2A3 compared to A3F2 indicates that greater disruption of muscle structure occurred in F2A3. According to Crouse and Koohmaraie [5], freezing before aging could improve the efficacy of proteolysis during postmortem aging due to loss of protease inhibitors, which, in turn, contributed to reduced shear force.
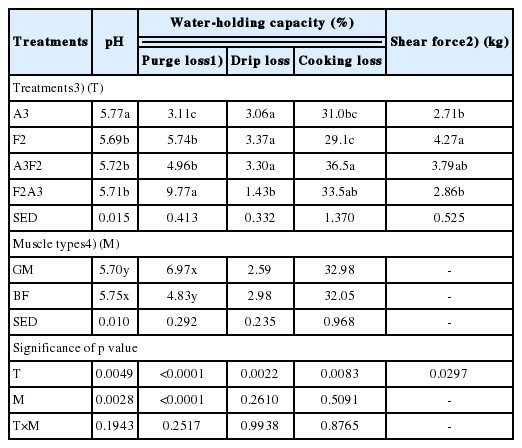
Physicochemical properties of two beef muscles in different aging and freezing/thawing sequences
Intracellular enzyme activity
Enzymatic differentiation for fresh and frozen/thawed meat has been proposed as one of appropriate and accurate analytical methods, which is fundamentally based on the release of cellular enzymes from mitochondria and lysosomes in muscle cell to extracellular or extramuscular matrix [18,19]. In this study, the enzyme activity of GSH-Px and BNAG in both purge and muscle tissue was evaluated to indirectly determine the degree of intracellular damage, based on the enzyme migration from intracellular space to external space of muscle. No interactions between aging and freezing treatment and muscle types on the enzyme activity in both purge and muscle were found (p>0.05; Table 3).
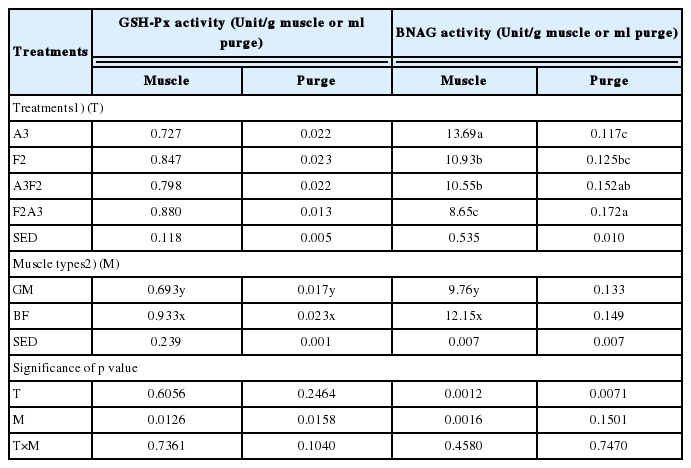
Glutathione peroxidase (GSH-Px) and β-N-acetyl glucoaminidase (BNAG) activity in purge and muscle tissue of two beef muscles in different aging and freezing/thawing sequences
Glutathione peroxidase GSH-Px
Only muscle type affected GSH-Px activity in both purge and muscle (p = 0.0126 and p = 0.0158, respectively). BF muscle (0.933 unit/g meat) had a higher GSH-Px activity than GM muscle (0.693 unit/g meat) (p<0.05), in addition, similar trend was also found in purge (p<0.05). According to Renerre et al [12], high activity of antioxidant enzyme including GSH-Px was observed for beef muscles exposed to oxidative stress (e.g. psoas major and disphragma). They suggested that antioxidant enzyme activity of oxidative muscle increased as a result of the response to oxidative stress. BF muscle had higher proportion of type I myofiber (red and oxidative) than beef GM muscle [20], which could be related to the elevated GSH-Px activity. Although there was no statistical difference, aged-only treatment (A3) had a numerically lower GSH-Px activity than all freezing/thawing treatments.
β-N-acetyl glucominidase
The activity of BNAG in muscle tissue affected by aging and freezing/thawing treatment (p = 0.0012) and muscle type (p = 0.0016). Aged-only treatment had a higher BNAG activity in muscle than all freezing/thawing treatments (F2, A3F2, and F2A3) in the following order; A3 (13.69 unit/g)>F2 (10.93 unit/g) = A3F2 (10.55 unit/g)>F2A3 (8.65 unit/g). In purge, however, completely opposite result was found as follows; F2A3 (0.172 unit/mL)≥A3F2 (0.152 unit/mL)≥F2 (0.125 unit/mL)≥A3 (0.117 unit/mL). Regarding muscle type, BF muscle had a higher BNAG activity than GM muscle (p>0.05). In previous studies, the activity of BNAG between fresh and frozen/thawed meat was inconsistent, which was likely due to methodological difference in preparation for meat exudates [13,19,21]. In this current study, contrasting change of BNAG activity between purge and muscle could signify the migration of BNAG from intracellular space to extra matrix of muscle. This suggestion might indicate the considerable disruption of muscle structure in F2A3, which could be responsible for the high purge loss and low shear force as discussed previously.
CONCLUSION
In this current study, the different combinations of aging and freezing/thawing had little influence on color characteristics of frozen/thawed beef muscles. In terms of WHC and tenderness, however, freezing/thawing and further aging resulted in high purge/thaw loss and low shear force compared to aging prior to freezing/thawing combination. These results indicate considerable structural changes in frozen/thawed and further aged meat. This observation was supported by the opposite changes of intracellular enzyme activity between purge and muscle. Therefore, the results from this present study indicate that aging and freezing/thawing sequence considerably influences WHC, particularly on thaw/purge loss. In addition, the WHC and color stability of two beef muscles contained in beef sirloin are similarly affected by aging and freezing/thawing process. To precisely investigate structural change in frozen/thawed and further aged meat, further researches determining various freezing and thawing conditions (rate, temperature, and period) and those impacts on quality attributes of frozen/thawed meat would be warranted. Furthermore, developing a novel freezing strategy combined with postmortem aging will be beneficial for the food/meat industry to maximize its positive impacts on tenderness, while minimizing thaw/purge loss of meat.
ACKNOWLEDGMENTS
Thanks are given to Mr. Brandon Meyers for him help in the preparation and analysis of samples. This work was supported by the USDA National Institute of Food and Agriculture, Hacth-Multistate project 1006773.
Notes
CONFLICT OF INTEREST
We certify that there is no conflict of interest with any financial organization regarding the material discussed in the manuscript.