Effects of Physically Effective Neutral Detergent Fiber Content on Intake, Digestibility, and Chewing Activity in Fattening Heifer Fed Total Mixed Ration
Article information
Abstract
The objective of this study was to determine the effects of physically effective neutral detergent fiber (peNDF) content in total mixed ration (TMR) on dry matter intake, digestibility, and chewing activity in fattening Hanwoo (Bos taurus coreanae) heifers. The experiment was designed as a replicated 3×3 Latin square using 12 heifers. Fattening heifers were offered one of three diets [high (T1), medium (T2), and low (T3) peNDF] obtained by different mixing times (3, 10, and 25 min) for the same TMR feed. The peNDF content of TMR was determined by multiplying the proportion of dry matter retained by a 1.18 mm-screen in a Penn State Particle Separator by the dietary NDF content. The peNDF1.18 content was 30.36%, 29.20%, and 27.50% for the T1, T2, and T3 diets, respectively (p<0.05). Dry matter intake was not affected by peNDF content in TMR. Total weight gain in T1 group was significantly higher (p<0.05) than in T2 and T3 groups. However, weight gain did not differ between T2 and T3 groups. The feed conversion ratio decreased with an increase in the peNDF content (T1: 12.18, T2: 14.17, and T3: 14.01 g/g). An increase in the peNDF content of TMR was associated with a linear increase in the digestibility of dry matter, crude protein, crude fiber, neutral detergent fiber, and acid detergent fiber (p<0.05). Also, an increase in peNDF content of the TMR resulted in a linear increase in the number of chews in eating and ruminating (p<0.05), and consequently in the number of total chews (p<0.05). These results indicate that peNDF content affects digestibility and chewing activity. Consequently, the peNDF content of TMR should be considered for improving feed efficiency, digestibility, body weight gain, and performance in fattening heifers.
INTRODUCTION
Digestibility of fiber is important in ruminants such as cattle and sheep that evolved as forage consumers. Plant cell walls, which is measure as fiber, cannot be digested by animals but must be fermented by microorganisms (Mertens, 1988). Digestion of fiber requires more energy and complex mechanisms, and ruminants have developed attributes that result in efficient digestion. In addition, to perform well and to avoid metabolic disorders, ruminants need adequate dry matter (DM) intake, energy, and appropriate fiber content in their rations. Thus, it is necessary to accurately estimate how much dietary fiber cattle require, because forages and roughage are lower in digestibility and available energy than grains and other concentrates, and reducing fiber to minimum levels in the diet is often desirable for high-performance dairy cows and beef cattle (Mertens, 1997). Mertens (1997) defined physically effective neutral detergent fiber (peNDF) as the fraction of neutral detergent fiber (NDF) that stimulates rumination and contributes to a proper ruminal digesta mat consistency. The peNDF system is based on measuring feed particle size and NDF content of forage to accurately predict the chewing response (Grant and Colenbrander, 1990).
According to critical size theory, particles longer than 1.18 mm have the greatest resistance to passage and are largely responsible for stimulating chewing and rumination (Poppi et al., 1981). Digestibility is directly proportional to the digestible fraction of fiber and rate of fiber digestion, but it is inversely related to the rate of release of particles from the nonescapable to escapable fiber pool and the rate of escape. Particle size reduction increases the release rate from the nonescapable fraction which in turn results in reduced digestibility. Ruminal particulate matter is mostly below the threshold size for escape, and particle size reduction may not be the rate-limiting step in clearance from the reticulorumen. Therefore, an adequate particle size of fiber should be an integral part in the diet of ruminants to take advantage of their unique digestive capability (Mertens, 1997).
Although various methods are available to measure particle size in diets, the Penn State Particle Separator (PSPS) has become widely accepted as a quick and practical method for routine use on farms to evaluate the particle size of forages and total mixed ration (TMR) (Lammers et al., 1996). Mertens (1997) defined peNDF as the proportion of DM retained by a 1.18-mm screen multiplied by the dietary NDF (peNDF>1.18) by using a dry-sieving technique. However, little information is available on the physical properties of TMR, which is widely used in dairy and beef cattle production in Korea. Therefore, an accurate evaluation of the physical characteristics of TMR is necessary to improve beef cattle production.
The objective of this study was to determine the effects of peNDF content on feed intake, digestibility, and chewing activity in fattening heifers fed TMR.
MATERIALS AND METHODS
Animals and diets
Fattening heifers of Hanwoo (Bos taurus coreanae, average 460.5±45.6 kg) were used to investigate the effects of the peNDF content of TMR on feed intake, digestibility, and chewing activity. Twelve heifers were assigned to treatments in replicated 3×3 Latin square design. Animals were housed in individual tie stalls and were fed TMR once a day at 0800 hours. This encouraged ad libitum intake. Animals had free access to fresh water and mineral blocks at all times.
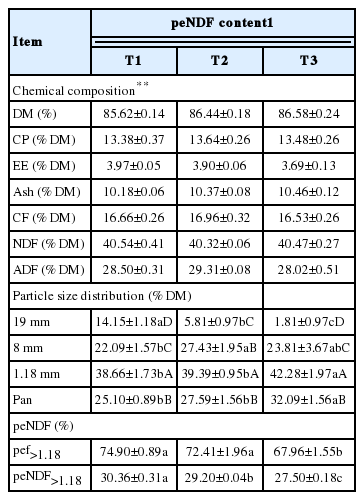
Each period consisted of 14 days of adaption to diets and 7 days of experimental measurements. The amount of feed offered and refused were measured and recorded daily during the last 7-d of the period to calculate feed intake and apparent nutrient digestibility. All animal-based procedures were approved by the Institutional Animal Care and Use Committee at Konkuk University (KU11058). Each heifer was offered one of three diets based on same chemical formula but differing in peNDF content. The three dietary peNDF levels were obtained by different mixing times of TMR diets: 3 min (T1), 10 min (T2), and 25 min (T3). The experimental TMR diets which were mixed with perennial ryegrass hay (10% fresh matter [FM]), annual ryegrass hay (10% FM), tall fescue hay (5% FM), and other feedstuffs (75% FM) including corn gluten feed, wheat husk, ground corn grain, corn flake, cotton seed, and etc. were produced with the commercial formula for beef cattle recommended by the Institute of Bio Feed (Seoul, Korea). The chemical composition of the experimental diets is shown in Table 1.

Chemical composition and particle size distribution of the total mixed ration (TMR) measured using the Penn State Particle Separator
Feed samples were collected once a week, and refusals were collected daily and DM intake determined. The collected samples were dried in an oven at 65°C for 48 h and ground through a 1-mm mesh screen (Model 4, Thomas Scientific, Swedesboro, NJ, USA) for analysis of chemical composition (AOAC, 1990). Particle size distributions for experimental TMR diet were determined using the PSPS (Lammers et al., 1996) containing three sieves (19, 8, and 1.18 mm) and a pan, and physically effectiveness factors (pef) were calculated as the sum of the DM portion retained on three sieves (19, 8, and 1.18 mm). The peNDF1.18 content of TMR was calculated by multiplying NDF content of the TMR by pef1.18 (Kononoff and Heinrichs, 2003a). The proportion of sample DM collected in a ≥1.18 mm sieve is commonly used as the physical effectiveness factor in the equation (Mertens, 1988).
Apparent digestion and chewing activity
Total fecal collections were made for the apparent digestibility between days 15 and 21 of each period. Fecal sample of each heifer was collected immediately after every excretion, and each sample was mixed daily and then divided into three subsamples. One subsample from each sample used to form a combined sample and then dried at 65°C and ground before chemical analysis and digestion coefficient calculation.
Chewing activities were monitored continuously for 48 h. Six digital video cameras (SDC-435, Samsung, Seoul, Korea) and two multiplexers (PDR-XM3004, Egpis, Goyang, Korea) were used to monitor the behavior of each heifer. Cameras were carefully arranged to avoid blind spots.
Statistical analysis
The main effects of treatments were subjected to one-way analysis of variance using the general linear model procedure of SAS (Version 9.2, SAS Institute, Cary, NC, USA). When a statistically significant difference was recognized in the analysis, Duncan’s multiple range test was used to detect statistical significance (p<0.05) among treatment groups.
RESULTS
Chemical composition, particle size distribution, and peNDF content
The chemical composition of the experimental diets was similar for high (T1), medium (T2), and low (T3) peNDF groups, because they had the same formulation and ingredients (Table 1), with only different mixing times. However, particle distribution was largely affected by mixing time. The proportion of particles retained on the 19-mm sieve decreased with increasing mixing time of TMR (T1: 14.15%, T2: 5.18%, and T3: 1.81%) and those retained on the 1.18-mm and pan sieves and the pan were significantly increased (T1: 38.66% and 25.10%, T2: 39.39% and 27.59%, and T3: 42.28% and 32.09%) (p<0.05). The peNDF>1.18 content of TMR decreased (p<0.05) linearly with increasing mixing time of TMR. The peNDF>1.18 content of the experimental diets was 30.36%, 29.20% and 27.19% for T1, T2 and T3, respectively (p<0.05). The peNDF content calculated using actual chewing time (Mertens, 2002) was similar to these results.
Intake, average daily gain, and digestibility
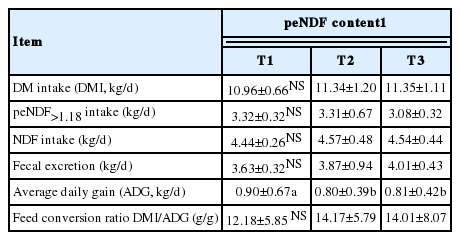
The DM intake was 10.96±0.66, 11.34±1.20, and 11.35±1.11 kg/d for T1, T2, and T3, respectively, and there was no significant difference. The NDF and peNDF intakes were not affected by the peNDF content of the experimental diets (Table 2). Fecal excretion was 3.63±0.32, 3.87±0.94, and 4.01±0.43 kg/d for T1, T2, and T3, respectively, and there was no significantly difference.

Effects of peNDF content DM intake, feces excretion, average daily gain, and feed conversion ratio in fattening heifers
Average daily gain (ADG) with T1 was significantly higher (p<0.05) than with T2 and T3. Feed conversion ratio was decreased by increasing the peNDF content (12.18±5.85, 14.17±5.79, and 14.01±8.07 in T1, T2, and T3, respectively).
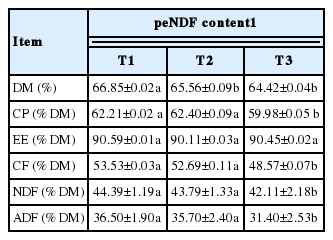
The apparent digestibility of DM was significantly higher (p<0.05) in T1 than in T2 and T3 (Table 3). Nutrient digestibility except for the ether extract was significantly affected (p<0.05) by peNDF content. The apparent digestibility of crude protein (CP), crude fiber (CF), NDF, and acid detergent fiber (ADF) in T1 and T2 was significantly higher (p<0.05) than in T3.
Chewing activities
The number of eating, rumination, and total chews increased linearly with increasing peNDF content (p<0.05) (Table 4). Ruminating time and total chewing time were also significantly affected (p<0.05) by the peNDF content of TMR. However, the eating time was not affected by peNDF content in T2 and T3. Eating rate, ruminating efficiency and chewing efficiency were significantly decreased (p<0.05) with an increase in the peNDF content.
DISCUSSION
The PSPS is based on the properties of Standard S424 of the American Society of Agricultural Engineers (ASAE, 1998) and has been proven to generate similar results to the vertical oscillating sieving method (Lammers et al., 1996; Buckmaster, 2000; Teimouri Yansari et al., 2004). It is generally understood by nutritionists that the physical characteristics of the diet, including forage chopping length, are important elements for reducing the risk of acidosis. In this study, the peNDF content of the TMR diets was reduced with increased mixing times of TMR. The peNDF>1.18 values (30.36%, 29.20%, and 27.50% for T1, T2, and T3) of the TMR in the present study were higher than the recommended minimum ranges (19% to 21% and 18.9% to 21.2%) from Mertens (1997) and Einarson et al. (2004), probably because of a higher NDF content (above 40%) and the formulation based on various hays in this study. In addition, when measured using the PSPS with three sieves (19, 8, and 1.18 mm), the proportion of peNDF primarily depends on the mixing time of TMR and its particle size because the proportion of T3 was greatly decreased compared to other diets at the19-mm sieve.
In this study, peNDF content did not affect DM intake and neutral detergent fiber intake. Based on the results from a previous study (Yang and Beauchemin, 2006), dairy cows may intentionally select long feed particles when ruminal pH is low due to low intake of peNDF. Other studies have reported no effects on DM intake and NDF intake from reduced peNDF (Soita et al., 2000; Beauchemin et al., 2003; Calberry et al., 2003). The DM intake can be regulated by many factors such as physical characteristics and ingredient and nutrient composition (Allen, 1997), and an interaction between dietary peNDF content and the forage-to-concentrate ratio may affect DM intake. For example, when high concentrate diets are fed to lactating dairy cows, a metabolic, rather than a physical factor places a constraint on feed intake. A reduction of peNDF content resulting in a higher particulate passage rate from the rumen would allow for a greater feed intake (Allen, 1997). A small increase in feed intake due to low peNDF content was also observed in cows fed a high concentrate diet (58%) when forage was coarse (Theoretical cut length = 19 mm; Einarson et al., 2004).
In this study, ADG of T1 was significantly higher than that of T2 and T3 (p<0.05). Feed conversion ratio was decreased by increasing the peNDF content (12.18, 14.17, and 14.01 g/g). The effects of peNDF content on body weight and feed conversion ratio have been substantially investigated, but there is limited information on the effects of peNDF content in TMR.
The apparent digestibility of DM, CP, CF, NDF and ADF was linearly increased with increasing dietary peNDF content (Table 3), and these results accord with some previous reports (Yang et al., 2002; Schwab et al., 2003; Kononoff and Heinrichs, 2003b). The difference in response between our study and that of Kononoff and Heinrichs (2003b) was probably related to the differences in peNDF contents of the TMR (range of 15.6% to 18.4% vs 30.36% to 27.50%). Whether forage particle length affects fiber digestibility appears to depend upon the concentration of peNDF in the diet. For example, fiber digestibility was observed to be reduced with smaller forage particle length of alfalfa silage when peNDF content was decreased to a minimum of 7.2% (Yang et al., 2002), but the effect was not observed when the peNDF content was 9.5% (Yang et al., 2001).
Reducing the peNDF content of TMR increases surface area available for microbial attack, thereby accelerating digestion, but fine particles often have a faster passage rate from the rumen such that digestibility is reduced. In addition, long particles are reduced in size during ingestive mastication, thereby eliminating the effects of particle length. Michalet-Doreau et al. (2002) reported that mean particle length markedly decreased after ingestive mastication.
Eating time in this experiment gradually declined with decreased peNDF content. Beauchemin et al. (2003) found that, although eating time (min/kg of DM) was similar, the number of chews per kilogram of DM intake during the eating period increased linearly (p<0.05) with increasing dietary peNDF; that is, the chewing rate increased. The authors suggested that cows could efficiently reduce long particles by increasing their chewing rate during the eating period. For example, Brouk and Belyea (1993) observed that chewing time was similar, but chewing rate was higher for cows fed long chopped alfalfa hay, and other researchers have reported both increased chewing rate and chewing time with increasing forage particle size (Kononoff and Heinrichs, 2003a). Therefore, cows likely increase their chewing activity through either chewing rate, chewing time, or both in relation to increased peNDF intake (Yang et al., 2006). In the present study, increased total chewing time with higher dietary peNDF content resulted in increased rumination time rather than increased eating time.
CONCLUSION
Physical characteristics of diets are critical for obtaining proper chewing activity as well as for animal production. In this study, reducing the peNDF content decreased total chewing activity, ruminating time, and total chewing time of fattening heifers. Average daily gain in T1 group was significantly higher than in T2 and T3 groups. Thus level of peNDF greater than 30% may be better for the optimal performance of fattening heifers. Feed conversion ratio was decreased by increasing the peNDF content. Digestibility in the total tract, especially for DM, CP, CF, NDF, and ADF was decreased with decreasing peNDF content. Interestingly, increased content of peNDF did not affect the DM intake significantly, but it did increase the digestibility. Therefore, the PSPS is the most useful tool that can be used on the farm to evaluate fiber adequacy in forages and TMR. The values obtained can be used to determine the physical effectiveness of fiber, which is a good indicator of the ruminal potential of the feed.
ACKNOWLEDGMENTS
This work was carried out with support from the “Cooperative Research Program for Agriculture Science & Technology Development (project No. PJ011999)”, Rural Development Administration, Republic of Korea.
Notes
CONFLICT OF INTEREST
We certify that there is no conflict of interest with any financial organization regarding the material discussed in the manuscript.

