Accuracy of genomic breeding value prediction for intramuscular fat using different genomic relationship matrices in Hanwoo (Korean cattle)
Article information
Abstract
Objective
Intramuscular fat is one of the meat quality traits that is considered in the selection strategies for Hanwoo (Korean cattle). Different methods are used to estimate the breeding value of selection candidates. In the present work we focused on accuracy of different genotype relationship matrices as described by forni and pedigree based relationship matrix.
Methods
The data set included a total of 778 animals that were genotyped for BovineSNP50 BeadChip. Among these 778 animals, 72 animals were sires for 706 reference animals and were used as a validation dataset. Single trait animal model (best linear unbiased prediction and genomic best linear unbiased prediction) was used to estimate the breeding values from genomic and pedigree information.
Results
The diagonal elements for the pedigree based coefficients were slightly higher for the genomic relationship matrices (GRM) based coefficients while off diagonal elements were considerably low for GRM based coefficients. The accuracy of breeding value for the pedigree based relationship matrix (A) was 13% while for GRM (GOF, G05, and Yang) it was 0.37, 0.45, and 0.38, respectively.
Conclusion
Accuracy of GRM was 1.5 times higher than A in this study. Therefore, genomic information will be more beneficial than pedigree information in the Hanwoo breeding program.
INTRODUCTION
Owing to reduction of genotyping cost and availability of high density single nucleotide polymorphism (SNP) panels, genome assisted selection method has become a popular selection method in animal breeding. The genomic estimated breeding values are used in genomic selection to predict the genetic merit of the candidate. Genomic selection refers to incorporation of DNA marker information, often the whole genome SNP data, to predict the genomic breeding values (genomic estimated breeding values, GEBV) used to make selection decisions. Genomic prediction is believed to provide better genetic gain for quantitative traits than could be achieved by phenotypic data alone [1]. Selection based on genomic data can be applied to young animals without sacrificing the selection candidates, which is apparently the most important advantage of this method. Bayesian methods for GEBV have proven to be accurate and efficient for phenotypes controlling few genes with large effects; however, the high-density SNP data sets demand computation power for the parameter estimation algorithms. The accuracy of genomic prediction using different methods (genomic best linear unbiased prediction [GBLUP] and Bayesian methods) depends on the genetic structure controlling the phenotypes [2]. Recently many reports suggested genomic selection to be better than traditional best linear unbiased prediction (BLUP) in terms of breeding value prediction accuracy [3,4]. One of the most important components of GEBV is the size and structure of reference population and the linkage disequilibrium between SNP and quantitative trait loci (QTL). Both of these factors affect the prediction accuracy considerably.
So far, in order to identify causative mutations and QTL controlling economic traits, genome wide association studies have been performed in many cattle breeds. There are various statistical models to detect QTL, such as single-marker regression and interval mapping. Since economic traits are likely to be influenced by many loci with small effects, whole genome SNP data will be more accurate detecting QTL than statistical models that analyse few SNP markers of candidate gene. In animal breeding, estimated breeding value (EBV) has been calculated using phenotype and pedigree data using a statistical model called BLUP and it has been one of the important criteria that animal breeders use to select genetically superior animals. Although the traditional BLUP model has been successfully used to select animals, it also has some drawbacks such long generation interval and pedigree error of breeding animals. Moreover, pedigree error can decrease reliability of EBV. In the present study we report genomic prediction for intramuscular fat and compare the accuracy of genomic breeding values using BLUP and GBLUP from different genomic relationship matrices. The accuracies thus obtained were compared to the accuracies obtained by using deterministic prediction equations given by Goddard [5] and Daetwyler [6].
MATERIAL AND METHODS
Data
The data set included a total of 778 animals (706 animals with phenotypes, genotypes and pedigree, 72 animals were bulls of 706 animals) that were genotyped with BovineSNP50 BeadChip (Illumina, Inc, San Diego, CA, USA). Descriptions of phenotypic records for genotyped animals are shown in Table 1. The data set was split into training and validation data sets for the genetic prediction. The training data set consisted of 706, and the validation data set consisted of 72 genotyped animals with no phenotype information. The phenotype consisted of chemically measured intramuscular fat.
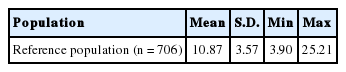
Summary statistics for intramuscular fat
Genomic relationship matrices
In the final dataset, SNP were removed if the call rate was less than 95%, if the Illumina Gen train score was less than 0.7, if the minor allele frequency was less than 0.01, if the SNP was not in Hardy-Weinberg equilibrium (a p-value cut-off of 1×10⁻¹⁵), if the genome location was unknown or if the SNP showed complete linkage disequilibrium (r2>0.99) with another SNP on the chip. Missing genotypes were imputed using fastPHASE [7]. BLUP and GBLUP model were used to predict genomic values (GBV) for validation animals using imputed genotypes. ASREML4 [11] was used to solve mixed model equation. The G matrices were supplied to ASREML as a user defined relationship matrix.
Comparisons involved several genomic relationship matrices. First, G was obtained following equation [3]:
Where M is an allele-sharing matrix with m columns (total number of markers) and n rows (genotyped animals), P is a matrix containing the frequency of the second allele (pj), expressed as 2(pj). Instead the frequencies used above equation, genomic relationship matrices were constructed using allele frequencies equal to 0.5 (G05), equal to observed frequencies (GOF), and Yang’s algorithm [3,8,9].
The accuracies obtained by these different methods were compared to the accuracies obtained by prediction equations given by Goddard [5] and Daetwyler [6]. The results were validated using ten different sets of randomly resampled data consisting of 70 animals each.
Genomic prediction
Pedigree BLUP and GBLUP were used to estimate the GEBV
The GBLUP method uses a genomic relationship matrix derived from the SNP markers instead of the pedigree based numerator relationship matrix. The GBLUP method was given by VanRaden [3] and Habier [10]. The model equation used was
Where y is a vector of phenotypes, X is a design matrix relating the fixed effects to each animal, b is a vector of fixed effects, Z is a design matrix allocating records to genetic values, g is a vector of additive genetic effects for an individual and e is a vector of random normal deviates with variance σe2. var (g) = Gσg2 where G is the genomic relationship matrix and σg2 is the genetic variance for this model. Vector g contains animals with phenotypes but can be extended to animals with no phenotypes. For all GBLUP analyses, the validation animals were included in the genomic relationship matrices (GRM) but had unknown phenotypes in the calculation of GEBV. ASReml was used for the GBLUP analysis [11].
Accuracy of genomic breeding value was calculated in two different ways (cross validation and prediction error variance), firstly, 10 validation sets (n = 70, 10%) were randomly sampled from reference population, then calculated correlation between GEBV and phenotypes (Cor[GEBV, Phenotypes]) as an accuracy. The second way was calculated by
RESULTS AND DISCUSSION
Statistics of pedigree and genomic relationship coefficients for 778 genotyped animals (706 steers and 72 bulls) are shown in Table 2. In genomic relationship matrices (GOF, G05, and Yang), average of diagonal element was quite similar to the coefficient of the pedigree based relationship matrix (A) (Table 2). The average minor allele frequency was 0.33. The distribution of the minor allele frequencies varied from 0 to 0.5 (Figure 1). The average off-diagonal coefficients for GOF and Yang was less than coefficient of A, but in G05, the average off-diagonal coefficients was greater than that of A. In GOF and Yang, the average of off-diagonal coefficients equal to zero allowed a matrix with average diagonal elements equal to 1 (Table 2). For genomic relationship matrices (GOF, G05, and Yang), variance of diagonal coefficients was greater than elements of A (Table 2). A larger variance of G than A would be expected because genomic relationships reflect a realized relationship which is the actual gene fraction shared between individuals. However, a pedigree-based coefficient is the average expected value (Supplementary Figure S1). In this study the range of relationships calculated by genomic data was continuously distributed from 0 to 0.5 in half-sib families while the relationship from pedigree data was not.
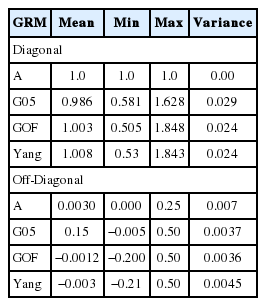
Statistics of relationship coefficients estimated using pedigree and genomics
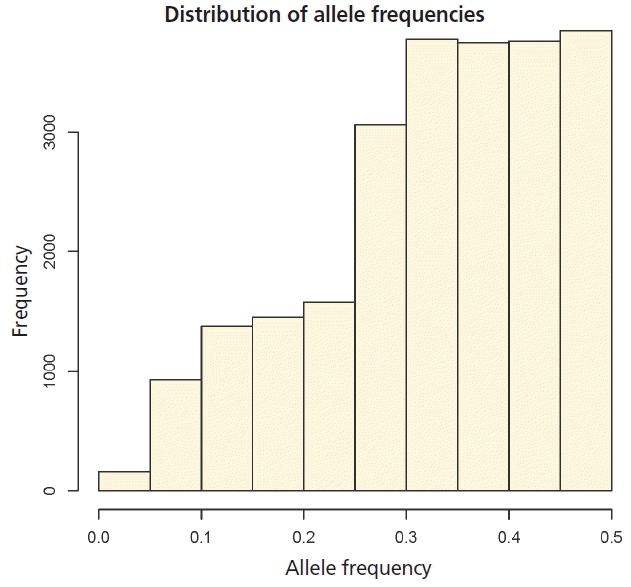
Distribution of allele frequencies. Observed frequencies of the minor alleles.
Additive variance of GRM was slightly higher than that of A whereas residual variance of GRM was two times higher than that of A (Table 3). Compared to estimates obtained with A, most of the additive variance estimates using GRM in the smaller dataset were inflated. The inflation was approximately inversely proportional to the difference between the average diagonal and the off-diagonal elements of G. The range of co-variance of G (relationships between individuals) showed even continuous distributed than that of A (Supplementary Figure S1) which allowed co-variance of G (relationships between individuals) to be larger within families because residual variance of G would be bigger than A with a shallow pedigree information (only sire side pedigree).
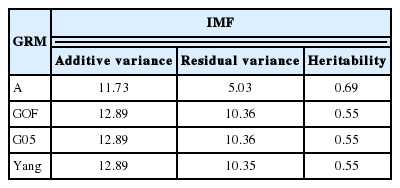
Variance components estimates for intramuscular fat (IMF) and marbling score (MS) using pedigree and genomic relationship coefficients
Estimates of breeding values of three genomic relationship matrices (GOF, G05, and Yang) for genotyped animals (n = 778) were on average similar for the three genomic relationship matrices. However, correlation between A and G, was quite low (0.28 to 0.45) for genotype bulls with only genotypes and no phenotypes (Table 4). However, a high Correlation among G was observed for intramuscular fat traits in Hanwoo cattle. No drastic difference between estimated breeding values between the three different GRM’s was observed.
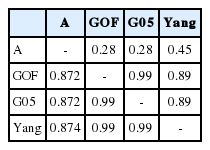
Correlations between estimated breeding values for intramuscular fat (IMF) using different relationship matrices
Only Yang’s [8] genomic relationship matrix showed a high correlation between pedigree-based EBV and Genomic-based EBV in this study (Table 4). Statistics for breeding values with three GRM’s and A for genotyped steers (n = 706, genotype, phenotypes, and pedigree) are tabulated in Table 5 and 6. The means of A and G05, GOF, and Yang were −0.018, −0.026, 0.028, and 0.03 respectively. However, variance of breeding value calculated by A was much larger than GRM (Tables 5, 6). The scale of breeding value calculated by A would be a larger range than that of GRM. Statistics on computed breeding values for genotyped bulls (n = 72, only genotypes and no phenotypes) also showed that smaller value for mean and bigger variance between A and GRM. Estimates of accuracy for genotyped bulls (n = 72) calculated using prediction error variance with different genomic matrices are in Table 7. On average, the accuracy of breeding value for A was 13% and for three GRM’s (GOF, G05, and Yang) was 0.37, 0.45, and 0.38, respectively. It showed that the accuracy of GRM was 1.5 times higher than A. The accuracy of breeding value for cross validation (n = 70) i.e. 10 sets of randomly sampled data, differed only by 2% difference between A and GRM.
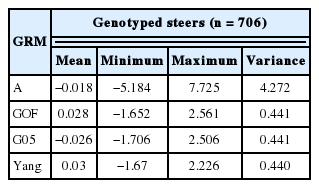
Statistics of estimated breeding values for intramuscular fat (IMF) using pedigree and genomic information in genotyped steers (n = 706)
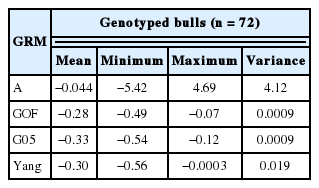
Statistics of estimated breeding values for intramuscular fat (IMF) using pedigree and genomic information in genotyped bulls (n = 72)
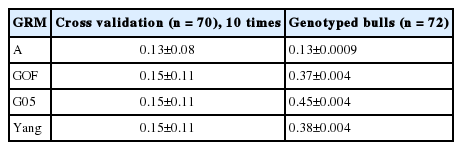
Average accuracy estimates for breeding values using pedigree and genomic relationship coefficients
The accuracy of GEBV prediction relies on many factors, for examples size of reference population, marker density, heritability of the trait, QTL effects, the extent of linkage disequilibrium (LD) between markers and the QTL, and the LD phase persistence between the reference population and the validation population [1,6,12]. In terms of LD and effective population size (Ne), Li and Kim [13] reported that the Korean cattle population has a larger effective population size (Ne = 600). Therefore, closer relationship between reference and validation set showed higher accuracy of GEBV (Table 7). In this study, the GEBV of genotyped bulls showed higher accuracy than the randomly sampled validation set because of their close relatedness.
In Australian cattle populations, Bolorma [14] investigated an accuracy between molecular breeding value estimated using a panel of 14 SNPs and real intramuscular fat (IMF) phenotypes. Molecular breeding value estimated 14 SNPs explained 5.6% and 15.6% of the phenotypic and genetic variance of IMF, respectively. This study tells us genome-wide associate study cannot capture most of genetic and phenotypic variation. Therefore, genomic BLUP would capture more variation from the quantitative traits such as IMF with polygenic characteristics.
Heritability estimated using the genotype relationship matrix was 0.55 for IMF which is similar to marbling score in Hanwoo [15]. The accuracy of GEBV for genotyped bulls was 0.37 (GOF), 0.45 (G05), and 0.38 (Yang) in Hanwoo using the 50K SNP panel, whereas the accuracy of normal BLUP was 0.13 (A).
A similar study has been performed by Forni [8] in a pig population where there was no large difference in accuracy between GRM and A. The accuracy between A and GRM was from 0.791 to 0.799 and scale of estimated breeding value and genomic breeding value was also similar. The differences between Forni’s work and this study would be a size of reference population (three times bigger reference population size) and use of deep pedigree (n = 338,346). As the constitution and size of the reference dataset and the methods used to predict the breeding value are a major factor in achieving accuracy in breeding strategies [12], in this study very limited reference population (n = 706) and genotyped bulls (n = 72) were used to estimated GEBV, hence a considerable difference was observed in accuracy between A and G. We found that three different GRM were very constant in statistics on GRM and scale of genomic breeding value.
CONCLUSION
In the present study the GBLUP method performed better than the BLUP for the prediction of accuracy of estimated breeding value for intramuscular fat. Inflated breeding value prediction accuracies were observed with the genotype relationship matrices. We considered only small reference population and even very shallow pedigree information for BLUP in this study, however it would be interesting to see the results if we include bigger reference population and very deep pedigree information in the training and validation dataset. Our study supports the use of GBLUP for attaining better prediction accuracy. We also conclude that the design and size of the reference population plays a major role in achieving accuracy for the breeding schemes.
Supplementary Data
ACKNOWLEDGMENTS
This study was partly supported by awards from the Molecular Breeding Program (PJ01134903) of Next Generation BIOGREEN21 project of NIAS, RDA and Research Grants from Chungnam National University, Korea.
Notes
CONFLICT OF INTEREST
We certify that there is no conflict of interest with any financial organization regarding the material discussed in the manuscript.