Carcass and Meat Quality Traits in an Embden×Toulouse Goose Cross Raised in Organic Dehesa
Article information
Abstract
This study assessed the influence of genetic type (Embden-Anser anser, EE; Toulouse-Anser anser, TT and F1 cross, ET) for meat characteristics (carcass, meat quality and fatty acid (FA) profiles), of domestic geese “Anser anser domesticus” raised in dehesa as an alternative, organic feeding system. Carcass and breast muscle weight (p<0.01) were greater for the ET group at the same live weight. None of the groups showed differences in the production of fatty liver with this type of feeding. Higher values were found for maximum Warner–Bratzler shear force (between 7.62 and 8.87 kg/cm2), which implies the improvement of this parameter. High levels of oleic FAs were obtained, especially for the TT group. The polyunsaturated/saturated FA ratio was highest for the ET group (p<0.001), reflecting the optimum nutritional values as a component of a healthy consumer diet.
INTRODUCTION
The importance of breeding livestock in integrated production systems is gaining increased recognition as a way of providing sustainable growths in food (FAO, 1990). Moreover, the demand for high quality traditional products, such as those obtained from free-range animals, has grown considerably over the last few years. In this regard, the domestic goose (Anser anser domesticus), fits well into these types of systems for its great capacity for adapting to different environments, and its distribution is almost worldwide, providing high quality meat from natural grazing (Liu and Zhou, 2013). However, although goose breeding and production go back to ancient times, nowadays it is poorly exploited in Europe and only represents around 13% of total waterfowl production (Guémené et al., 2012).
The wild species of this animal is native to Western Europe and has produced a number of subspecies or domestic breeds (Andres and Kapkowska, 2011), the most familiar, widely-recognized of which is Anser anser domesticus. However, some domestic breeds derived from the Swan goose, (Anser cygnoides) of Asian origin, are also frequent. In particular, Chinese geese are highly regarded in Southeast Asia and are greatly prized by local farmers for the production of lean meat (National Research Council, 1991).
In contrast, the Toulouse (Anser anser) is a heavy breed originating in France which is mainly used for egg and foie gras production (Batty, 1996), and the Embden (Anser anser) breed originates from the area around the North Sea, especially the Netherlands and Germany. This latter breed is characterized by its ability to gain weight rapidly and these geese are good foragers (Jacob and Pescatore, 2013). They have therefore been popular as stock for generating hybrid crosses for meat production (i.e., the offspring between a Toulouse goose and an Embden gander grow rapidly and have good fleshing qualitie, Jacob and Pescatore, 2013). Besides, some European breeds such as Embden or Toulouse, have also been introduced successfully in tropical countries (National Research Council, 1991), and the crossbred offspring are specially recommended for warm climates, as long as water is available.
Traditional rearing conditions differ widely across the world, but primarily, geese are produced on specialized commercial farms. However, demands for alternative rearing systems are emerging in Eastern and Western countries (Guémené et al., 2012), one of which is the so-called dehesa, a distinctive ecosystem populated by evergreen Quercus oaks, with a total extent of around 200,000 Km2 in the Iberian Peninsula. The animals are fed on this natural resource all year long, with the plentiful addition of acorns in the winter months (Recio et al., 2013). This free-range management system with feeding in the organic dehesa gives the meat those unique, exceptional characteristics which differentiate it from other commercial meats on the market (Rey et al., 2006; Bouderoua et al., 2009; Keddam et al., 2010).
Considering all these advantages, it is expected to obtain higher productive performance and better meat quality of the Embden×Toulouse cross comparing to parental lines under the specific conditions of natural grazing in the dehesa. For this reason, it is of special interest to analyse the influence of genetic type in the production characteristics (carcass, meat quality and fatty acid [FA] profiles) of geese (Anser anser) raised in the dehesa as an alternative, organic feeding system. Our objectives are, therefore, first, to compare the productive carcass traits for the two subpopulations or genetic groups and their F1 cross (Embden: EE; Toulouse: TT; F1 cross Embden×Toulouse: ET), under the same fattening regime, and secondly, to differentiate the quality of the meat and the FA profiles of the three genetic groups, in animals of both sexes and of the same ages.
MATERIAL AND METHODS
The current system and rearing methods used conform to the EU regulations (EC no 834/2007, UNE-EN 45011-ISO/65) on organic farm animal production, certified by the official organism Sohiscert (Sociedad Hispana de Certificación SA). The experimental protocols using meat geese in this study were followed according to Spanish rules and regulations for animal care (EU Council Directive 86/609/EEC). The slaughtering process was also carried out according to the European regulations for the Protection of Animals at Slaughter or Killing (93/119/EC D, 1993). The three genetic groups were fattened under identical feeding and handling conditions. Feeding was ad libitum with natural grazing, water, acorns and a supplement of maize once a day (approximately 250 to 300 g/d; Table 1). No vaccination process was used under organic conditions.

Chemical composition and nutritive value of the supplementary feed (yellow maize) during the free-range period
Animals
For the carcass and meat characterization of the goose population, fifty geese of three different genotypes (20 Embden-Anser anser, EE; 10 F1 cross, ET; 20 Toulouse-Anser anser, TT; Table 2) were analyzed. All the animals were supplied by the companies Inddeco S.L. and Tierras de Ganso Ibérico S.L., and the two parental breeds came from a certified farm. During the first 6 weeks, the animals were grown under controlled conditions in an air-conditioned house. Thereafter, the birds lived free-range in the dehesa in the South of Spain for a period of seven months. When the animals reached 30 to 32 weeks (with an average live weight of 5.3 kg, Table 2), they were transported to an officially approved abattoir (approximately 1 hour away and under 100 km from the farm) the afternoon before slaughter. Travel conditions and handling were the same for all the animals.

Description of sampled geese raised in the dehesa system and live weight (mean±standard error) per genotype group and sex
Carcass and meat quality analysis
After slaughter, the carcasses were stored in a chilling room (4°C for 10 days) for ageing. Several traits were measured: carcass weight (CW), carcass length (CLe), carcass width (CWi), breast muscle weight (BW), liver weight (LW), thigh muscle width (TW) and thigh muscle length (TL). Afterward, the pH and color of the breast muscle were recorded. The pH was measured with a portable pH-meter (Model Hanna HI9025, Hanna Instruments, Woonsocket, RI, USA) equipped with a glass electrode suitable for meat penetration and an automatic temperature compensator. A meat color analysis (L* = lightness, a measure of the light reflected (100 = white; 0 = black); a* = redness, measures positive red and negative green; and b* = yellowness, measures positive yellow, negative blue) was carried out using a portable spectrophotometer (Model CM-2600d, Konica Minolta Co., Osaka, Japan) (illuminant: D65; visual angle: 10°; measurement aperture: 8 mm). The color was taken from breast muscles of each animal. Color coordinates were expressed as L*, a*, and b*, following the L*a*b* system (CIE, 1986).
In addition, the water-holding capacity was measured by drip loss (DL) and cooking loss (CL). DL was determined from a 2 cm thick sample of the breast muscle, which was weighed and then attached to a fish hook that was secured to the lid of an air tight container to avoid evaporation (with no contact between sample and container). The sample was left 24 h in a chilling room (4°C) and reweighed afterwards. The percentage of DL was calculated as the difference between the weights of the fresh and chilled samples relative to the fresh pre-chilling weight ([{raw weight–chilled weight}/raw weight]×100). To determine CL, the breast muscle was cut into 1 thick sample weighting about 70 to 80 g from each goose, which were then boiled individually in polyethylene bags immersed in an 80°C water bath until they reached an internal temperature of 70°C. The temperature was continually monitored by a Type K flexible high-temperature thermocouple (Model HH501DK, Omega, Laval, QC, Canada) inserted into the geometric center of each steak. The cooked samples were put into individual bags, and cooled at room temperature for 30 min. After equilibrating to room temperature, the cooked samples were weighed and the percentage of CL recorded. CL was calculated as the percentage weight difference between the fresh and cooked samples (after gently blotting on filter paper) relative to the weight of the fresh samples using the following equation:
Furthermore, a 5 cm length of breast muscle was cut to assess Warner–Bratzler shear force (WBSF). The WBSF was measured perpendicular to the muscle fibres using a Texture Analyser (Model TA.XT-2, Texture Analyser, Stable Micro Systems Ltd, Surrey, UK) equipped with a Warner-Bratzler shear device (25 kg load cell) and a crosshead speed of 200 mm/min. Down stroke distance was 3 cm (the probe should cut the meat completely). The parameter recorded was the maximum resistance of the sample to shearing or the maximum shear force that is the highest peak (recorded in kg) of the curve. Seven peak shear forces were recorded per sample and averaged. The DL, CL, and WBSF were taken 10 days postmortem.
Fatty acid profile analysis
The total FA composition was extracted, methylated and analyzed at the General Agricultural Research Service, University of Seville (Spain), using a modification of the method described by Aldai et al. (2006). Separation and quantification of the FA methyl esters was carried out using a gas-chromatograph (Model Agilent 6890N, Agilent Technologies Spain, S.L., Madrid, Spain) equipped with a flame ionization detector automatic sample injector HP 7683, and using an HP-88 JandW fused silica capillary column (100 m, 0.25 mm i.d., 0.2-mm film thickness, Agilent Technologies Spain, S.L., Madrid, Spain). Individual FAs were expressed as the percentage of the total FAs identified and grouped as follows: saturated fatty acid (SFA), monounsaturated fatty acid (MUFA), polyunsaturated fatty acid (PUFA), ω6 and ω3. The PUFA/SFA and ω6/ω3 indices were also calculated.
Statistical analysis
The statistical analysis was carried out using the Statistica for Windows 8.0 (Statsoft Inc., 2007) software. A descriptive statistics analysis was performed for carcass, meat and FA characteristics. Analysis of variance (including the live weight as a covariate for carcass traits) for the effects of genetic group, sex and the interaction between genetic group×sex were carried out. When a significant effect was detected (p<0.05), least square means were compared using Fisher’s least significant difference test.
RESULTS AND DISCUSSION
Carcass characteristics
Geese are usually sold to the commercial market as whole carcasses. However, for this study, the carcasses were quartered to characterise the main commercialized parts of the geese (breast muscle and liver). Furthermore, measurements of whole carcass and thigh muscle were also taken for the analysis. The analysis of variance (ANOVA) and descriptive parameters of carcass traits from the animals involved in the three genetic groups are presented in Table 3. The results show that differences were obtained between the three genetic groups analyzed for the main traits studied. The ET group obtained the highest CW at the same live weight.
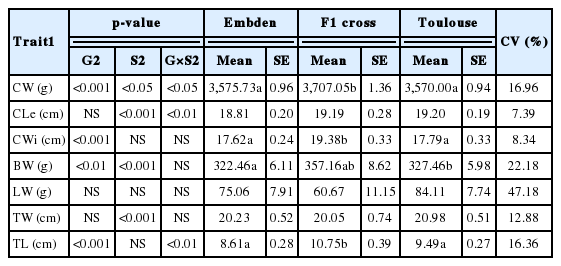
ANOVA, descriptive parameters (LS mean and SE) and coefficient of variation of meat quality traits for the three genetic groups of geese raised in the dehesa system analyzed
Moreover, the values for live weight of the animals studied (Table 2) were below that obtained in other goose breeds (>5,000 g: Huang et al., 2010; Murawska et al., 2010). These differences may well be due to the differences in feed composition (i.e. amino acid contribution) supplied in intensive breeding systems. For example, animals diets based on yellow dent maize require more amino acid supplementation than diets based on other cereal grains (Cervantes-Pahm et al., 2014). In order to achieve higher growth rates, it is therefore recommendable to check both the management and the composition of the feed supplied (i.e. oats; Murawska et al., 2010).
As regards the CW, the values obtained were in the range of that obtained in other European goose breeds (between 3.6 and 3.9 kg; Murawska et al., 2010). The CWi, BW and TL presented statistically significant differences for the genetic group (0.01>p<0.001). The results also showed that, at the same live weight, the ET genetic group presented the highest BW and even better than in other domestic geese breeds (<259 g; Arroyo et al., 2013), which reflects better aptitude for meat production. However, for LW, only the covariate live weight was found significant (p<0.05), and the TT genetic group was the only one which showed increased LW. This reflects its orientation towards fatty liver production, although the differences were not statistically significant, probably due to the type of feeding used.
As regards the effect of sex, the results of the ANOVA showed that there were significant differences (0.001>p<0.05) between sexes for CW and CLe, BW and TW. In general, males obtained higher values for all the traits except for breast muscle, where females obtained the highest values (data not shown). Moreover, genetic group×sex interaction was found to be significant (0.01>p<0.05) for CW, Cle, and TL. In addition, an intermediate value for the other two traits studied was also obtained. The results therefore show that the ET group is the one with the best adaptability for meat production aptitude in an organic dehesa system.
Finally, the lower coefficients of variation were obtained with carcass and thigh muscle traits (from 7.4% to 17%), which indicates that production is carried out with fairly acceptable levels of homogeneity. Also notable is the high variability for breast muscle and LW traits (coefficient of variation [CV] 22.2% and 47.2%), suggesting a highest environmental influence in the production characteristics of these traits but opens up the possibility of genetic improvement by selection.
Meat quality characteristics
The ANOVA and descriptive parameters of meat quality traits for the three geese genetic groups analyzed are presented in Table 4. Regarding the effect of genotype on the physical and chemical characteristics of the breast meat, only the lightness (L*) color parameter, drip loss, and WBSF at 10 days were significantly different. Although the values were measured at 10 days of ageing, the parameters were within the normal ranges compared to those obtained in other related poultry species with shorten chilling process (i.e. 24 hours) (between 34.90 and 53.11 for L*, between 4.33 and 18.80 for a*, between 7.26 and 12.07 for b*, between 0.23% and 0.40% for DL, and between 23.67% and 35.52% for CL, Omojola, 2007; Has-Schön et al., 2008; Arroyo et al., 2013; George et al., 2014; Heo et al., 2015).
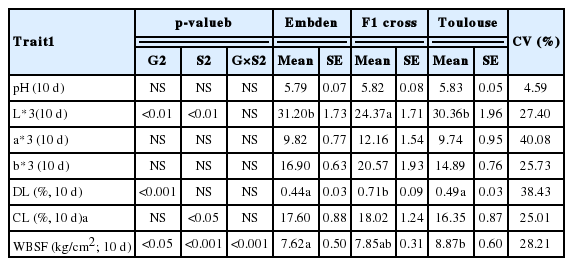
ANOVA, descriptive parameters (mean and SE) and coefficient of variation of meat quality traits for the three genetic goose groups raised in the dehesa system analyzed
In comparison, in other poultry species such as ducks, some breeds had been linked to the production of more tender meat, although sex did not affect texture traits (Omojola, 2007). Nevertheless, the results obtained in the present study shown a significant effect of the sex in terms of meat tenderness (p<0.001). It is noteworthy that both sexes of the ET group obtained medium levels for the WBSF trait (data not shown), which shows a good orientation of the cross for meat tenderness. However, slightly lower tenderness was observed in comparison with other specialized poultry meat species (Omojola, 2007; Heo et al., 2015). However, the mid-high CV value observed for tenderness and the other meat characteristic traits (ranging from 25.7% to 40.1%; Table 4), make it recommendable for improvement by selection.
Fatty acid profiles
The ANOVA and descriptive parameters for FA traits from the animals involved in the three genetic groups are presented in Table 5. The results show significant differences between the three genetic groups from the viewpoint of breast muscle FAs. The high percentage of unsaturated oleic acid observed is worthy of note (between 43% and 45%), higher than that observed in other species raised in extensive conditions (32% to 36%, Mamani-Linares and Gallo, 2013; Turner et al., 2015) or in commercial hatcheries (25% to 40%, Okruszek, 2012; Kwon et al., 2014). However, high values of saturated palmitic acid (21% to 25%) were also observed, although values were similar or lower than those ones found in other goose breeds (24% to 32%, Okruszek, 2012; Liu and Zhou, 2013; Chen et al., 2014).

ANOVA and descriptive parameters (mean and SE) of the main fatty acid traits for the three genetic goose groups raised in the dehesa system analyzed
It is well known that the dietary intake of PUFAs is effective in lowering blood lipid levels (Grundy and Denke, 1990). In this regard, Wood and Enser (1997) mentioned a minimum recommendation of 0.45 for the PUFA/SFA ratio. In the current study, acceptable levels of total PUFA/SFA have been observed (0.42 to 0.66, Table 5), similar to those reported in other poultry species fed on acorns (0.7 in broilers; Bouderoua et al., 2009) and higher than that reported in other livestock species (0.15 in lambs, Keddam et al., 2010; or 0.39 in goats, Turner et al., 2015). Thus, the PUFA levels and the PUFA/SFA ratio of geese raised in the organic dehesa system were similar to the recommended ratio. This meat could therefore be recommended for its optimum nutritional values as a component of a healthy consumer diet.
Increased ratios for ω6/ω3 are known to be favoured in nutritional recommendations for reducing the risk of coronary heart disease (Food and Agriculture organization, 1994), although, in contrast, a high ω6/ ω3 ratio has been found to promote the pathogenesis of many chronic illnesses (Liu and Zhou, 2013). Besides, high content of unsaturated fatty acids (i.e. ω-3 PUFA) causes earlier rancidity and color deterioration due to a rapid oxidation (Wood et al., 2003). Thus, the correct balance between dietary ω-6 and ω-3 fatty acids is an important consideration, both, for cardiovascular health and for the shelf life and storage quality of the meat. The general consensus is that this corresponds to a ω6/ω3 ratio of ~6:1 (Wijendran and Hayes, 2004). In the goose meat produced, higher values for the ω6/ω3 ratio (20:1) were observed compared to other poultry species (between 8:1 and 18:1, Has-Schön et al., 2008; Bouderoua et al., 2009; Liu and Zhou, 2013). Therefore, it is recommendable to introduce alternative supplements into the diet, such as linseed or high oleic sunflower seeds, which help to reduce the ω6/ω3 ratio (Azcona et al., 2008). However, when considering lifelong dietary eating habits which affect cardiovascular health, the primary consideration should be the absolute mass of essential fatty acids consumed, rather than the ω6/ω3 ratio (Wijendran and Hayes, 2004).
CONCLUSION
According to these results, the ET crossed group shown to have higher carcass weight and breast weight than other animals although live weight was lower, whereas water-holding capacity (by drip loss) was lower in ET compared with Embden and Toulouse. The ET cross has therefore shown, a relatively appropriate meat production aptitude. In contrast, none of the groups showed any differences for the production of fatty liver, probably because they were not subjected to any kind of forced feeding or high-energy diet. The higher values found for the WBSF suggest the need for further study to improve this parameter.
The high percentages of unsaturated oleic acid obtained should be noted. The level of PUFA/SFA ratio was higher in the ET genetic group, which reflects its optimum nutritional values as a component of a healthy consumer diet. In general, higher productive performance and better meat quality traits of the ET group have been obtained comparing to parental lines EE and TT. Therefore, the Embden x Toulouse cross has shown suitable adaptability to the organic dehesa environment, which could be a positive factor for its commercial use.
ACKNOWLEDGMENTS
The authors would like to thank Inddeco S.L. and Tierras de Ganso Ibérico S.L. for their contribution to this study.
Notes
CONFLICT OF INTEREST
We certify that there is no conflict of interest with any financial organization regarding the material discussed in the manuscript.