Effects of Rice Straw Supplemented with Urea and Molasses on Intermediary Metabolism of Plasma Glucose and Leucine in Sheep
Article information
Abstract
An isotope dilution method using [U-13C]glucose and [1-13C]leucine (Leu) was conducted to evaluate the effects of rice straw supplemented with urea and molasses (RSUM-diet) on plasma glucose and Leu turnover rates in sheep. Nitrogen (N) balance, rumen fermentation characteristics and blood metabolite concentrations were also determined. Four sheep were fed either mixed hay (MH-diet), or a RSUM-diet with a crossover design for two 21 days period. Feed allowance was computed on the basis of metabolizable energy at maintenance level. The isotope dilution method was performed as the primed-continuous infusion on day 21 of each dietary period. Nitrogen intake was lower (p = 0.01) for the RSUM-diet and N digestibility did not differ (p = 0.57) between diets. Concentrations of rumen total volatile fatty acids tended to be higher (p = 0.09) for the RSUM-diet than the MH-diet. Acetate concentration in the rumen did not differ (p = 0.38) between diets, whereas propionate concentration was higher (p = 0.01) for the RSUM-diet compared to the MH-diet. Turnover rates as well as concentrations of plasma glucose and Leu did not differ between diets. It can be concluded that kinetics of plasma glucose and Leu metabolism were comparable between the RSUM-diet and the MH-diet, and rumen fermentation characteristics were improved in sheep fed the RSUM-diet compared to the MH-diet.
INTRODUCTION
The economic point of view and sustainable environmental concerns encourage investigating the possibility of using the crop residue as animal feed. Rice straw is abundantly available crop residues in most tropical and sub-tropical countries and commonly used as a diet for ruminants, although it is low crude protein (CP) content and fermented poorly in the rumen (Alam et. al., 2010; Sarnklong et al., 2010). Supplementation of nitrogenous substrates to rice straw is reported to recover its CP deficiency and improve its digestibility through providing necessary ammonia (NH3) for rumen microbial activities which is essential for better rumen fermentation characteristics (Wanapat et al., 2009). It was also reported that supplementation of nitrogen (N) sources in combination with energy substrates to straw diets improved feed intake, digestive function along with ruminal characteristics in ruminants through influencing rumen microbial growth (Rooke and Armstrong, 1989; Can et al., 2004; Wu et al., 2005). In most of the tropical countries it is a common practice to use urea and molasses as the sources of N and soluble carbohydrate, which provide required NH3 and energy substrates for rumen microbial activities (Toppo et al., 1997; Tedeschi et al., 2002; Zinn et al., 2003). However, the effect of rice straw supplemented with urea and molasses (RSUM-diet) on intermediary metabolism of plasma nutrient kinetics in ruminant is scanty.
Glucose is an important energy source for the brain and body tissues and it is particularly important for growth and lactation. Leucine (Leu) is an essential amino acid and requirements of it in ruminants are met from microbes grown in the rumen. It could be expected that the RSUM-diet might influence plasma glucose and Leu metabolism in sheep through providing required NH3 and energy for rumen microbial activities to increase the dietary carbohydrate fermentation. Therefore, the present study was designed to evaluate the effect of the RSUM-diet on turnover rates (TR) of plasma glucose and Leu using the isotope dilution methods along with the determination of N balances rumen characteristics and blood metabolite concentrations in sheep.
MATERIALS AND METHODS
Animals, diets and management
Experimental procedures including animal cares, cannulation and blood sampling were reviewed and approved by the Animal Care Committee of Iwate University. Four sound healthy crossbred (Corriedale× Suffolk) shorn sheep (Ovis aries) weighing 46.6±2.2 kg of body weight (BW) were used. Two dietary treatments were tested; one was mixed hay (MH-diet) of orchardgrass (Dactylis glomerata) and reed canarygrass (Phalaris arundinacea), other was rice straw (Oryza sativa) supplemented with urea and dried molasses. Feed allowance was computed on the basis of maintenance level metabolizable energy (ME). Chemical composition of experimental feed is shown in Table 1. The ME was assumed 1.73 kcal/g for mixed hay (NRC, 1985); 1.30 kcal/g for rice straw and 2.62 kcal/g for molasses (NARO, 2006). Feed allowance was mixed hay 57.8 g/kg0.75/d for the MH-diet and rice straw 59.7 g/kg0.75/d supplemented with urea 0.84 g/kg0.75/d and molasses 7.6 g/kg0.75/d for the RSUM-diet. Crude protein supply was given for both diets on dry matter (DM) basis. Urea and molasses were mixed and given on chopped (3 to 4 cm) rice straw immediately before feeding. Feed was given twice a day at 08:00 h and 20:00 h and fresh drinking water was available ad libitum. The experiment was performed using crossover design with two 21 days period. Two sheep were fed the MH-diet during the first period and then the RSUM-diet during the second period, and the other two sheep were fed in the reverse order. The sheep were housed in individual pens in an animal barn during the adjustment period (first two weeks), and on day 15, the sheep were moved to a controlled house at an air temperature of 23°C±1°C with lighting from 8:00 h to 22:00 h and maintained in wooden metabolism stalls designed for total collection of feces and urine. The sheep were weighed on day of starting the experiment and every 7 days intervals of each dietary period. All experimental procedures were carried out without noticeable stress to the animals.
Nitrogen balance
Nitrogen balance trial was conducted for 5 days (from day 16 to day 20) of each dietary period as described previously (Alam et al., 2010). Total fecal output was collected daily from each sheep before night feeding. Feces were dried at 60°C in a forced air oven for 48 h and placed at room temperature for 5 days. Then the air dried samples were weighed for measuring the moisture contents and sub-samples were ground to pass through a 1 mm screen, kept them into plastic container and stored at room temperature until analysis. Urine was collected from each sheep every 24 h in a plastic bucket containing 50 mL of 6 N H2SO4 solution to prevent the escape of NH3. Total volume of daily urine output was recorded by measuring cylinder, then the urine was shaken properly and sub-samples (50 mL) were stored at −30°C until analysis.
Collection of rumen fluid
Rumen fluid was collected from each sheep at 2 h after feeding with orally inserted stomach tube on day 20 of each dietary period. The pH value was measured by a pH-meter (HM-10P, Toa Electronics Ltd., Tokyo, Japan) immediately after collection of rumen fluid. A sub-sample was centrifuged at 8,000×g for 10 min at 2°C (RS-18 IV, Tomy, Tokyo, Japan) and then an aliquot of 1 mL supernatant was acidified by 1 mL of 0.1 N HCl for measuring the rumen NH3 concentration. Finally the prepared samples and residual of rumen fluid were kept frozen at −30°C for later analysis.
Isotope dilution method
Isotope dilution methods using [U-13C]glucose and [1-13C]Leu were conducted to determine the TR of plasma glucose and Leu on day 21 of each dietary period. Two catheters, one for isotope infusion and another for blood sampling were inserted into the left and right jugular veins on the morning of each isotope dilution method. The catheters were filled with sterile solution of tri-sodium citrate (0.13 mol Nacl/L). At 12:00 h, 3.2 μmol/kg0.75 of [U-13C]glucose (D-glucose-13C6, 99 atom% excess 13C; Cambridge Isotope Laboratories, Tewksbury, MA, USA) and 7.2 μmol/kg0.75 of [1-13C]Leu (L-leucine-1-13C, 99 atom% excess, 13C; Cambridge Isotope Laboratories, USA) dissolved in saline solution (9 g/L) were injected as priming dose injection through the jugular infusion catheter. Immediately after the priming dose injection, [U-13C]glucose and [1-13C]Leu were continuously infused at rates of 3.2 and 7.2 μmol/kg0.75/h, respectively, for 4 h through a multichannel peristaltic pump (AC-2120, Atto Co. Ltd., Tokyo, Japan). Blood samples were collected through the sampling catheter immediately before the priming dose injection (10 mL) and every 30 min intervals (5 mL) over the last 2 h of the primed-continuous infusion of [U-13C]glucose and [1-13C]Leu. The collected blood samples were transferred to the heparinized tubes and stored in crushed ice until centrifugation. Blood samples were centrifuged at 10,000×g for 10 min at 2°C and the plasma samples were then stored at −30°C for further analysis.
Chemical analysis
Dry matter, CP and crude ash contents of the experimental diets were measured according to AOAC (1995). Nitrogen contents in diets, feces, urine and feed refusals were analyzed by Kjeldahl method with the Foss Keltech System (Tecator Digester System and Kjeltec 2300, Foss Tecator, Hoganas, Sweden). Crude fiber, neutral detergent fiber, acid detergent fiber, and acid detergent lignin in diets were determined according to van Soest et al. (1991) using Foss Analytical FiberCap System (Foss Tecator, Sweden). Concentrations of rumen total volatile fatty acid (VFA) were determined by titrating the steam distillate of rumen fluid with 0.1 N NaOH. The titrated distillate was dried and then individual VFA concentrations were determined using gas chromatography (5890A, Hewlett Packard, Avondale, PA, USA). Concentration of rumen NH3 was determined by colorimetric method (Weatherburn, 1967).
In pre-infusion period of isotope dilution method, plasma free amino acids, NH3 and urea were determined using an automatic amino acid analyzer (JLC-500/V, JEOL, Akishima, Japan). Plasma concentrations of non-esterified fatty acid (NEFA) were determined enzymatically using a diagnostic kit (NEFA C, Wako Pure Chemicals, Osaka, Japan).
To determine the concentrations and enrichments of plasma glucose and Leu, plasma [U-13C]glucose and isotope enrichments were measured by the procedure of Tserng and Kalhan (1983) with slight modifications as described previously by Sano et al. (1996). The enrichment of plasma [U-13C]glucose was determined using the selected ion monitoring with gas chromatography mass spectrometry system (GC/MS) (QP-2010, Shimadzu, Kyoto, Japan). Concentrations of plasma glucose were determined enzymatically using the method described by Huggett and Nixon (1957). Plasma amino acids were separated and converted to N-methyl-N-t-butyl-dimethylsilyltrifluroacetamide (MTBSTFA; Funakoshi, PCC48920, Tokyo, Japan) derivatives according to the procedures of Calder and Smith (1988) as described previously (Sano et al., 2004). Isotopic enrichments of plasma [1-13C]Leu and concentration of plasma Leu were measured by the selected ion monitoring using the GC/MS.
Calculation
Results were presented as mean values with standard error of the mean. For the isotope dilution methods, the TR of plasma glucose and Leu was calculated using the equation described by Tserng and Kalhan (1983) as follows:
Where, I is the infusion rate of [U-13C]glucose and [1-13C]Leu isotopes and E is the plasma isotopic enrichments of [U-13C]glucose and [1-13C]Leu during the steady state, respectively.
Statistical analysis
All data were statistically analyzed using analysis of variance with the MIXED procedure of SAS (1996). The least square means statement was used to test the effects of period and diet. Results were considered significant at the p<0.05 level, and a tendency was defined as 0.05≤p<0.10. The repeated measures statement and the Tukey adjustment were used for the time course of changes and the significance level was p<0.05.
RESULTS AND DISCUSSION
Daily profile and nitrogen balance
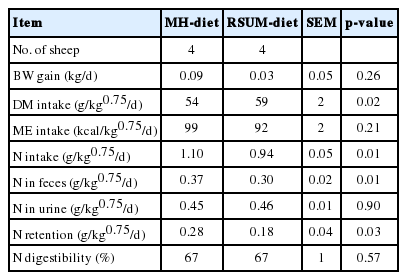
The sheep consumed the RSUM-diet more slowly than the MH-diet. The daily BW gain did not differ (p = 0.26) between the diets (Table 2). It was meant that no adverse effect was found on BW gain in sheep throughout the experiment for RSUM-diet. A similar trend was found in lambs fed urea treated rice straw supplemented with molasses (Hue et al., 2008). Dry matter intake was greater (p = 0.02) for the RSUM-diet compared to the MH-diet due to difference in feed allowance. The present result was supported by the findings of Singh et al. (1995). Estimated ME intake did not differ (p = 0.21) between diets. Nitrogen intake and N excretion through feces were lower (p = 0.01) for the RSUM-diet than the MH-diet. Lower N intake for the RSUM-diet might be due to loss of some N through residue of rice straw. Nitrogen excretion through urine did not differ between diets and N retention was lower (p = 0.03) for the RSUM-diet than the MH-diet. No significant difference (p = 0.57) occurred in N digestibility between diets in the present study. Can et al. (2004) reported the lower N digestibility in lambs fed only wheat straw than wheat straw supplemented with urea and molasses. Similar results were obtained in our previous study (Alam et al., 2010). It can be said that N intake as well as N digestibility were improved in sheep fed RSUM-diet than rice straw only. This is probably be due to addition of urea and molasses to rice straw which supplies required NH3 and energy for microbial activities in the rumen of sheep.
Rumen fermentation characteristics
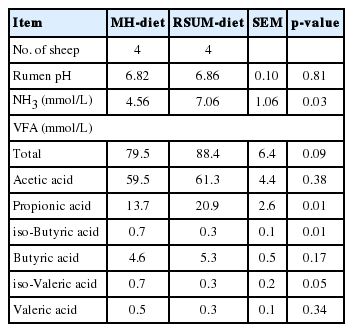
Rumen pH determined at 2 h after feeding did not differ (p = 0.81) between dietary treatments (Table 3). The pH values were within the normal range for both the diets. Similar rumen pH between diets was an indication of balance between the concentrations of VFA and NH3 in the rumen as described previously (Alam et al., 2010). The numerical values of rumen pH of the present findings were comparable with the data reported in sheep fed urea supplemented diet (Sano et al., 2009). Leng (1990) reported that the critical level of NH3 is between 2.9 and 14.7 mmol/L of rumen liquor for promoting the rumen fermentation. In the present study rumen NH3 concentration was within the normal range for promoting the rumen fermentation. Concentration of rumen NH3 was higher (p = 0.03) for the RSUM-diet than the MH-diet in the present study. The higher rumen NH3 concentration for the RSUM-diet was likely due to the presence of urea and molasses, because the urea is rapidly hydrolyzed and provides NH3 and molasses provides the required energy substrate for microbial activities in the rumen. This is in accordance with the results of Srinivas and Gupta (1997) and Jain et al. (2005), who reported that in ruminants, supplementation of urea and molasses to low quality roughage diets made better rumen environment for dietary carbohydrate fermentation through supplying adequate NH3 and energy for rumen microbial growth. Concentrations of rumen total VFA tended to be higher (p = 0.09) for the RSUM-diet than the MH-diet. Acetate concentration in the rumen did not differ (p = 0.38) between diets, whereas propionate concentration was higher (p = 0.01) for the RSUM-diet than the MH-diet. A tendency of higher rumen total VFA for the RSUM-diet has indicated well fermentation of dietary carbohydrate in the rumen. Similarly Jain et al. (2005) observed that rumen VFA concentrations were affected by urea, molasses and mineral granules supplementation with rice straw in goat kids. Propionate concentration in the rumen was affected by the readily fermentable carbohydrate in the diets (van Houtert, 1993). Higher concentration of ruminal propionate for the RSUM-diet was due to presence of molasses as a source of water soluble carbohydrate. Supplementation of molasses to rice straw might activate the microbes which produce propionate in the rumen. The present results were supported by Broderick and Radloff (2004), who mentioned that molasses supplementation to diets influenced the propionate concentration in the rumen.
Blood metabolites
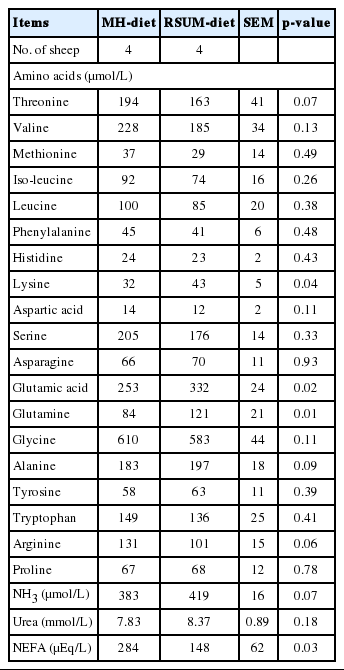
Plasma free amino acid concentration is influenced by the several factors such as dietary types and frequency of feeding, protein degradation, microbial protein synthesis and amino acid absorption (Leng and Nolan, 1984; Alam et al., 2013). Plasma free amino acids determined at pre-infusion of isotope dilution did not differ (p>0.10) between diets, except that lysine, glutamic acid and glutamine were higher (p<0.05) for the RSUM-diet compared to the MH-diet (Table 4). The observation might be due to adequate supply of NH3 and easily fermentable energy substrates for microbial protein synthesis for the RSUM-diet. Concentrations of plasma NH3 tended to be higher (p = 0.07) for the RSUM-diet compared to the MH-diet, and plasma urea concentration did not differ (p = 0.18) between diets. Concentration of NH3 in plasma is positively associated with the production of NH3 in the rumen (Nolan and Leng, 1972; Milano and Lobley, 2001). A tendency of higher plasma NH3 concentration for the RSUM-diet might be reflected by rapid absorption of NH3 from the rumen. The present result is in accordance with the results by Sano et al. (2009), who suggested that when urea was supplemented to the basal diet, the postprandial plasma NH3 increased temporally because a large part of the NH3 produced from the supplemental urea in the rumen and directly absorbed into portal blood. Concentration of plasma NEFA was lower (p = 0.03) for the RSUM-diet than the MH-diet. Plasma NEFA concentration is the indicator of energy status in ruminants (Fox et al., 1991), because plasma NEFA is mobilized to supply the metabolic needs of animal, primarily the need of energy. In the current study, lower plasma NEFA concentration for the RSUM-diet indicated its improved nutritional status due to nitrogenous substrate and soluble carbohydrate supplementation.
Plasma glucose and leucine kinetics
Plasma glucose concentration and [U-13C]glucose enrichment remained constant during the latter half of the isotope infusion (Figure 1), which indicated the steady state condition. Concentration of plasma glucose determined during the last 2 h continuous infusion of isotope dilution did not differ (p = 0.51) between the RSUM-diet and the MH-diet (Table 5). The numerical values of plasma glucose concentration were similar with the data previously reported in sheep fed rice straw supplemented with corn starch as energy source (Zhang et al., 2009). In ruminants gluconeogenesis takes place mainly in liver and rates of plasma glucose turnover (TR) were influenced with several factors such as the type of diet, energy intake and supply of gluconeogenic substrate to the liver (Ortigues-Marty et al., 2003; Sano and Fujita, 2006). In previous studies it was suggested that the precursor availability is an important factor in regulating gluconeogenesis (Schmidt and Keith, 1983; Oba and Allen, 2003). Plasma glucose TR in the present study did not differ (p = 0.31) between the RSUM-diet and the MH-diet, although the rumen propionate concentration, a major glucose precursor, was higher for the RSUM-diet. This is in accordance with Seal and Parker (1994), who reported that increasing supply of glucogenic substrates did not influence the plasma glucose TR in steers. Although the isotope dilution method was different, the numerical values of plasma glucose TR of the present findings were comparable to the data reported in sheep fed plantain herb (Al-Mamun et al., 2007).
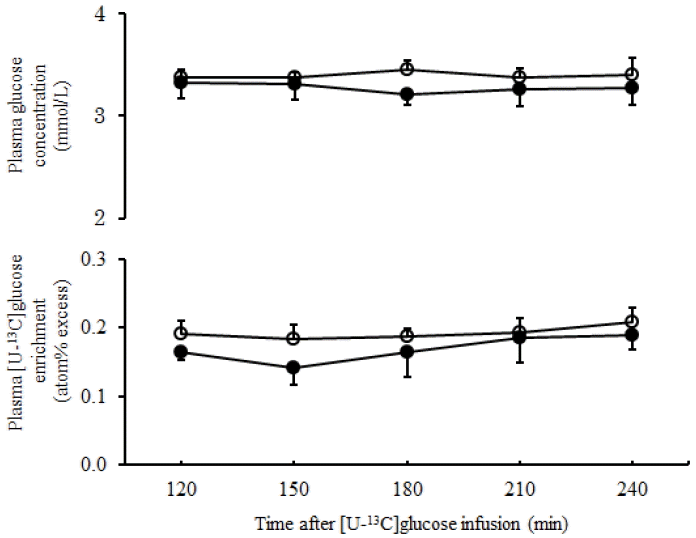
Time course changes in plasma glucose concentration and enrichment of [U-13C]glucose during 120 to 240 min of the primed-continuous infusion of [U-13C]glucose in sheep (n = 4) fed the RSUM-diet (●) and the MH-diet (○) (Means±standard error of the mean).
Plasma Leu concentration and [1-13C]Leu enrichment were stable during the latter half of the isotope infusion (Figure 2) which indicated the steady state condition. Concentration of plasma Leu determined during the last 2 h of the primed-continuous infusion did not differ (p = 0.11) between diets. In the present study, although N intake was lower for the RSUM-diet than the MH-diet, plasma LeuTR did not differ (p = 0.76) between diets. The present results were supported by Sano et al. (2009), who reported that supplementation of urea and soybean meal to roughage-based diets did not influence the plasma LeuTR in sheep. Moreover, numerical values of plasma LeuTR of the present findings were greater than the data previously found in sheep fed rice straw only (Alam et al., 2010), because the N and ME intake were also greater in sheep fed the RSUM-diet.
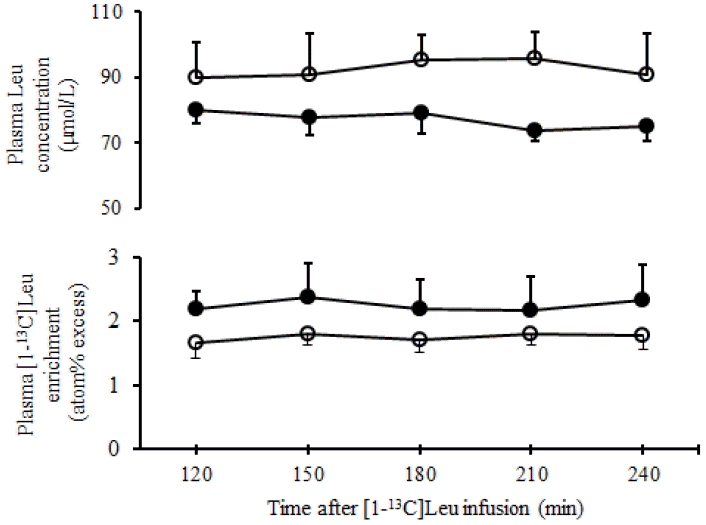
Time course changes of plasma leucine concentration and enrichment of [1-13C]Leu during 120 to 240 min of the primed-continuous infusion of [1-13C]Leu in sheep (n = 4) fed the RSUM-diet (●) and the MH-diet (○) (Means±standard error of the mean). RSUM, rice straw supplemented with urea and molasses; MH, mixed hay.
In conclusion, RSUM-diet showed improved performance than mixed hay on rumen fermentation characteristics and comparable performance to mixed hay on TR of plasma glucose and Leu in sheep. It can be suggested that rice straw supplemented with nitrogenous substrates in combination with soluble carbohydrate can be used for raising the livestock production as like as mixed hay.
Notes
CONFLICT OF INTEREST
We certify that there is no conflict of interest with any financial organization regarding the material discussed in the manuscript.

