Effects of Tributyrin on Intestinal Energy Status, Antioxidative Capacity and Immune Response to Lipopolysaccharide Challenge in Broilers
Article information
Abstract
This study was carried out to investigate the effects of tributyrin (TB) on the growth performance, pro-inflammatory cytokines, intestinal morphology, energy status, disaccharidase activity, and antioxidative capacity of broilers challenged with lipopolysaccharide (LPS). A total of 160 one-day-old Cobb broilers were allocated to 1 of 4 treatments, with 4 replicated pens per treatment and 10 birds per pen. The experiment consisted of a 2×2 factorial arrangements of treatments with TB supplementation (0 or 500 mg/kg) and LPS challenge (0 or 500 μg/kg body weight [BW]). On days 22, 24, and 26 of the trial, broilers received an intraperitoneal administration of 500 μg/kg BW LPS or saline. Dietary TB showed no effect on growth performance. However, LPS challenge decreased the average daily gain of broilers from day 22 to day 26 of the trial. Dietary TB supplementation inhibited the increase of interleukin-1β (in the jejunum and ileum), interleukin-6 (in the duodenum and jejunum), and prostaglandin E2 (in the duodenum) of LPS-challenged broilers. Similar inhibitory effects of TB in the activities of total nitric oxide synthase (in the ileum) and inducible nitric oxide synthase (in the jejunum) were also observed in birds challenged with LPS. Additionally, TB supplementation mitigated the decrease of ileal adenosine triphosphate, adenosine diphosphate and total adenine nucleotide and the reduction of jejunal catalase activity induced by LPS. Taken together, these results suggest that the TB supplementation was able to reduce the release of pro-inflammatory cytokines and improve the energy status and anti-oxidative capacity in the small intestine of LPS-challenged broilers.
INTRODUCTION
With high stocking intensity and high yield in modern poultry production, birds are inevitably exposed to considerable stress during their productive lifetime (Panda et al., 2009). Of particular note, is the immune stress that commonly occurs in broiler production. Lipopolysaccharide (LPS), a membrane glycolipid produced by gram-negative bacteria, can cause a strong immune response in animals and significant physiological changes (Wu et al., 2013). Orally or abdominally injected LPS can increase the production of pro-inflammatory mediators, induce inappropriate inflammatory responses and oxidative stress (Hou et al., 2013), and alter the intestinal dysfunction (Blikslager et al., 2007; Hou et al., 2013).
Previous studies have reported plant extracts and probiotics as alternatives to antibiotic growth promoters to counteract problems derived from endotoxin exposure (Wu et al., 2013; Zhang et al., 2013). Recently, butyrate derived from the fermentation of non-starch polysaccharides was also considered as a potential alternative to antibiotic growth promoter (Czerwiński et al., 2012; Zhang et al., 2013) due to the fact that butyric acid can act as an energy source for animals (Mahdavi and Torki, 2009), inhibit enteric pathogens (Namkung et al., 2011), reduce the expression of pro-inflammatory cytokines (Zhang et al., 2011), and promote gut health (Claus et al., 2007) and development (Zhang et al., 2011). However, it is difficult to use butyrate directly for animal production because it is volatile, corrosive, and quickly absorbed before arriving at the small intestine in addition to its offensive odour (Mallo et al., 2012). Butyrins (including both mono-butyrate and tri-butyrate glycerides) have, therefore, been developed to overcome the drawbacks of butyrate in application. Butyrate can be released from tributyrin (TB) by the intestinal lipase, and then be absorbed by the small intestine. Studies have shown that 2,000 mg/kg butyric acid (as mono-, di-, and triglyceride) could help to maintain the performance and carcass quality of broilers especially in vaccinated birds challenged with coccidiosis (Leeson et al., 2005). Similarly, monobutyrin (3,000 mg/kg) was tested for its antimicrobial activity against Salmonella typhimurium or Clostridium perfringens from poultry (Namkung et al., 2011). However, there were few studies to investigate the effects of TB on intestinal energy status and immune response in poultry.
The objectives of the present study were to investigate the effect of TB on intestinal energy status, oxidative capacity, and immune response in LPS-challenged broilers. The changes in pro-inflammatory cytokines, intestinal morphology, and disaccharidase activities in the small intestine were determined in particular.
MATERIALS AND METHODS
Chickens
The animal protocol used in the present study was approved by the Animal Care and Use Committee of Hubei Province, China. One hundred and sixty healthy one-day-old male Cobb chicks (45.1±0.5 g, Jingzhou Zhengkang Poultry Co., Hubei, China) were housed in stainless-steel cages in an environmentally controlled room with 60% relative humidity and a 24-h photoperiod. The environmental temperature was maintained at 32°C to 33°C, 30°C to 32°C, and 26°C during the first week, the second week, and the last two weeks, respectively. The broilers had free access to food and water during the feeding experiment, but the feed intake was restricted to 80 g/d in LPS- or saline-treated experiment. The maize- and soybean meal-based diet (Table 1) was formulated to meet National Research Council (NRC, 1994) recommended requirements for all nutrients.
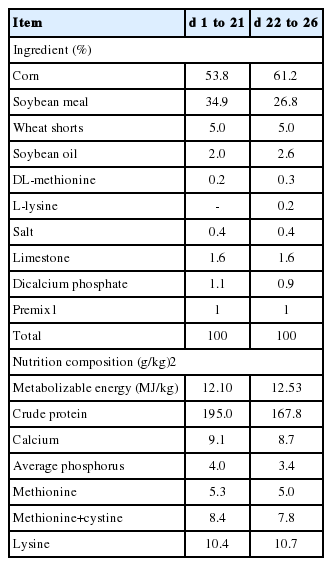
Composition and nutrient level of basal diet
Experimental design
The 2×2 factorial arrangement of treatments was used in a randomized design to determine the effects of TB supplementation (0 or 500 mg/kg diet), LPS challenge (0 or 500 μg/kg body weight [BW]), and their interaction. One-day-old broilers were assigned randomly into four treatment groups: i) control group, fed the basal diet and receiving intraperitoneal administration of sterile saline; ii) TB group, fed basal diet supplemented with 500 mg/kg TB and receiving intraperitoneal administration of sterile saline; iii) LPS group, fed the basal diet and receiving intraperitoneal administration of LPS; iv) TB+LPS group, fed basal diet supplemented with 500 mg/kg TB and receiving intraperitoneal administration of LPS (Zhang et al., 2011). Each group consisted of four replicates (cages) with ten birds per cage. BW and feed intake of broilers were recorded weekly. LPS (Escherichia coli O55: B5, Sigma Chemical Inc., St Louis, MO, USA) was dissolved in sterile saline for challenging birds. TB (Purity>98%, Wuhan Pan-China Biotechnology Co., Wuhan, Hubei, China) was mixed well with the basal diet. The dosage of 500 mg/kg TB (approximate equivalent to 1,500 mg/kg butyrate) was chosen according to the study of Jerzsele et al. (2012), who have shown that 1,500 mg/kg sodium butyrate improved the intestinal morphology of broilers. On days 22, 24, and 26 of the trial, broilers intraperitoneally administrated with LPS (500 μg/kg BW) (Zhang et al., 2013) or a same volume of sterile saline that served as a control. The dose of LPS used in the present study was determined according to our preliminary study (Figure 1), which determined the effects of three levels of LPS (0.25, 0.5, and 1 mg/kg BW) on broiler immune response by measuring the serum concentrations of pro-inflammatory cytokines and the growth performance. On day 27 of the trial, all broilers were killed for collecting intestinal samples at 24 hours post-injection of LPS or saline.
Preliminary study to determine the dose of lipopolysaccharide (LPS) used in inducing broilers immune stress. Twenty four 22-day-old male Cobb broilers were randomly assigned to four groups (control, 0.25 mg/kg body weight [BW] LPS, 0.5 mg/kg BW LPS, and 1 mg/kg BW LPS). At the age of 22, broilers in the 0.25 mg/kg BW LPS, 0.5 mg/kg BW LPS, and 1 mg/kg BW LPS groups were intraperitoneally injected with LPS at the dose of 0.25, 0.5, and 1 mg/kg BW, respectively, whereas those in the control groups were intraperitoneally injected with saline at the dose of 0.25 mg/kg BW. Blood samples were taken from a wing vein puncture at 24 h post LPS or saline injection and serum interleukin-1β (IL-1β) levels were determined. The feed intake was recorded from the ages of 22 to 28. Data were expressed as mean values with standard error of mean (n = 6). a,b,c Means with different superscripts in IL-1β levels differ significantly (p<0.05). A,B Means with different superscripts in average daily feed intake (ADFI) differ significantly (p<0.05).
Intestinal sample collection
The broiler abdomen was opened and the whole gastrointestinal tract was immediately exposed. The small intestine was dissected and placed on a chilled stainless steel tray. The 3- and 5-cm segments were cut at mid-duodenum, mid-jejunum, and mid-ileum, respectively. The 3-cm segments were immediately flushed gently with cold physiological saline, and then fixed in 4% paraformaldehyde over night at 4°C for histological examination (Hou et al., 2010). The 5-cm segments were opened longitudinally and the contents were flushed with cold physiological saline. Mucosae were collected by scraping using a sterile glass microscope slide, rapidly frozen in liquid nitrogen, and then stored at −80°C. All samples were collected within 10 minutes after killing.
Intestinal morphology
The 3-cm intestinal samples were dehydrated and embedded in paraffin, and then sectioned at 4-μm stained with hematoxylin and eosin. Intestinal morphology was examined with a light microscope with a computer-assisted morphometric system (BioScan Optimetric, BioScan Inc., Edmonds, WA, USA). The villus height was measured from the villus tip to the valley between individual villus. The crypt depth was measured from the valley between individual villus to the basolateral membrane. The 10 longest and straightest villi and associated crypts were measured from each segment (Xu et al., 2003).
Determination of proinflammatory cytokines
Frozen intestinal mucosal samples were homogenized, and the homogenates were centrifuged to obtain the supernatant. Interleukin-1β (IL-1β), interleukin-6 (IL-6), and prostaglandin E2 (PGE2) in the mucosal supernatant were analyzed using commercially available 125I RIA kits (Beijing North Institute of Biological Technology, Beijing, China). The detection limit for IL-1β was 0.1 pg/mL, and the coefficients of variation (CV) intra- and inter-assay were less than 10% and 15%, respectively. The detection limits for IL-6 and PGE2 analyses were 5.0 pg/mL and 0.12 pg/mL, respectively. The CV for intra- and inter-assays were less than 7% and 15% for IL-6, and less than 7.5% and 10.5% for PGE2, respectively.
Measurement of disaccharidase activity
Disaccharidase activities were determined according to the method of Zhu et al. (2014). In brief, the supernatant was collected after homogenizing and centrifuging (3,000 g, 10 min, 4°C). A volume of 100 μL diluted supernatant was then dispensed into a glass test tube and incubated with respective substrate (sucrose, maltose or isomaltose; 100 μL, 0.056 mol/L) at 37°C for 60 min. The reaction was terminated by submerging the tubes in boiling water for 2 min. When the tubes were cooled, the released glucose was determined by the glucose oxidase method (Bergmeyer, 1984). The protein concentrations were determined using the Coomassie Brilliant Blue G-250 reagent with bovine serum albumin as a standard and disaccharidase activities were expressed as U/mg protein.
Measurement of adenosine triphosphate, adenosine diphosphate, and adenosine monophosphate
The concentrations of adenosine triphosphate (ATP), adenosine diphosphate (ADP), and adenosine monophosphate (AMP) in mucosal samples were analyzed by HPLC (Hou et al., 2011). Briefly, frozen mucosal samples (0.1 to 0.2 g) were homogenized with 2 mL 1.5 mol/L cold perchloric acid, and centrifuged at 3,000×g for 10 min at 4°C. The supernatant (1 mL) was then neutralized with 0.4 mL of 2 M-potassium carbonate on ice, and the solution was centrifuged at 3,000 g for 10 min at 4°C. The supernatant was stored at −80°C until analysis.
The chromatographic system consisted of the Waters Breeze HPLC system (Waters Co., Milford, MA, USA), including 1525 binary HPLC pumps, a 2,487 Dual-λ Absorbance Detector, a 717 plus autosampler and Breeze system software, and a chromatographic column (Waters XBridge C18; 5 μm, 4.6 mm×150 mm). The mobile phase (50 mM-K2HPO4-KH2PO4 buffer solution and methanol; 77:23, v/v; pH 7.0) was filtered through a 0.45 μm filter membrane and degassed 15 min before use. The detection wavelength was 260 nm, the column temperature was 35°C and the pump flow rate was 1.0 mL/min. The frozen sample was filtered through a 0.20 μm filter membrane after being thawed at room temperature, and the injection volume was 20 μL. Peaks were identified by their retention times using authentic standards (Sigma Chemical Inc., USA). Total adenine nucleotide (TAN) and adenylate energy charges (AEC) were calculated according to the following equation (Yi et al., 2014). TAN = ATP+ADP+AMP, while AEC = (ATP+0.5 ADP)/(ATP+ADP+AMP).
Determination of oxidative and antioxidative parameters
Frozen intestinal mucosal samples (~0.1 g) were powdered under liquid nitrogen and then homogenized with cold physiological saline. After centrifuged (3,000×g, 10 min, 4°C), the supernatant was obtained for analysis. The malondialdehyde (MDA) and the activities of catalase (CAT), glutathione peroxidase (GSH-Px), total nitric oxide synthase (TNOS), and inducible nitric oxide synthase (iNOS) were determined using commercial kits (Nanjing Jiancheng Bioengineering Institute, Nanjing, China) following the instructions of the manufacturer (Zhang et al., 2011).
Statistical analysis
Results were expressed as mean values with pooled standard error of the mean. The data were analyzed using the general linear model procedure in SPSS version 17.0 (SPSS Inc., Chicago, IL, USA) in a 2×2 factorial arrangement with TB supplementation and LPS challenge as the main effects. The differences among treatments were evaluated by the least significant difference post hoc multiple comparisons test. Probability values of 0.05 were taken to indicate significance.
RESULTS
Growth performance
During the 26-day experimental period, there was no significant difference in average daily feed intake (36.7±3.2 g vs 38.0±4.0 g) and average daily gain (ADG) (26.1±2.6 g vs 27±3.1 g) between the control and TB groups. However, compared with the control group, LPS challenge decreased the ADG (23.7±2.5 g vs 19.6±1.8 g; p<0.05) of broilers from day 22 to day 26 of the trial.
Concentrations of proinflammatory cytokines
Broilers challenged with LPS exhibited higher (p<0.05) concentrations of IL-1β (in the small intestine), IL-6 (in the duodenum and jejunum), and PGE2 (in the duodenum) than that of broilers in the control group (Table 2). However, dietary supplementation of 500 mg/kg TB decreased (p<0.05) the level IL-6in the jejunum as compared with the control group (Table 2). Additionally, significant interactions between TB and LPS were observed at the levels of IL-1β (in the jejunum and ileum), IL-6 and PGE2 (in the duodenum and jejunum). Dietary supplementation of 500 mg/kg TB significantly reduced the levels of IL-1β (in the jejunum and ileum), IL-6 (in the duodenum and jejunum), and PGE2 (in the duodenum) in broilers challenged with LPS (Table 2).
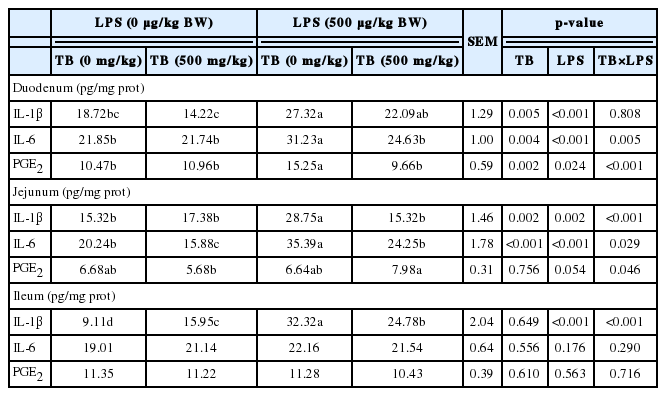
Effects of TB on the levels of pro-inflammatory cytokines in intestine of broilers challenged with LPS
Intestinal morphology
Data on small intestinal morphology are shown in Table 3. Compared with the control group, broilers in LPS group exhibited an increase (p<0.01) in crypt depth in the ileum, and a decrease (p<0.01) in villus height in the duodenum and in the ratio of villus height to crypt depth in the duodenum and ileum. Interestingly, dietary supplementation of 500 mg/kg TB reduced (p<0.01) the villus height and the ratio of villus height to crypt depth in the duodenum as compared with the control group (Table 3).

Effects of TB on intestinal morphology of broilers challenged with LPS
Activities of disaccharidase
Compared with control group, broilers receiving TB diet had higher (p<0.05) activity of sucrase in the duodenum (Table 4). Activity of isomaltase was decreased in the ileum of LPS-challenged broilers (p<0.01). Additionally, a significant interaction between TB and LPS was observed in the activity of maltase in the duodenum. The result showed that broilers receiving TB diet had the highest activity of maltase in the duodenum compared with other groups when challenged with LPS (Table 4).
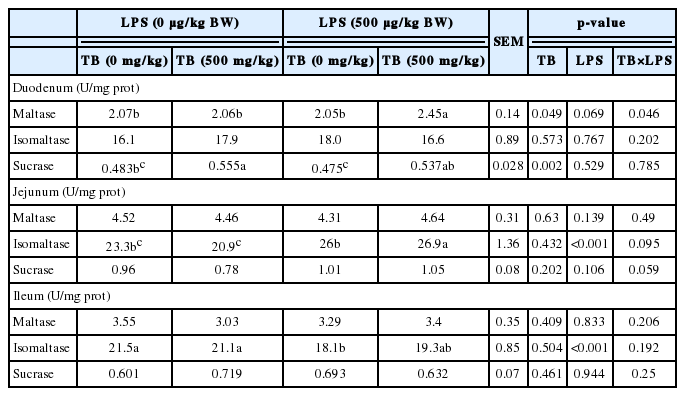
Effects of TB on the activities of disaccharidase in the intestine of broilers challenged with LPS
Energy status
As shown in Table 5, LPS administration decreased (p<0.05) the levels of ATP, but increased (p<0.05) the ratio of AMP/ATP in the ileum of broilers in comparison with the control group. However, compared with the control group, dietary supplementation of 500 mg/kg TB increased (p<0.05) the levels of ATP (in the duodenum and ileum), ADP (in the ileum) and TAN (in the duodenum), whereas reducing (p<0.05) the ratio of AMP/ATP (in the duodenum) of broilers. Moreover, significant interactions between LPS and TB were observed at the levels of ATP, ADP, and TAN in the ileum of broilers (p<0.05). The results showed that broilers receiving TB diet exhibited higher levels of ATP, ADP, and TAN in the ileum when birds were challenged with LPS (Table 5).

Effects of TB on energy status in the small intestine of broilers challenged with LPS
Oxidative capacity
Compared with the control group, LPS challenge significantly increased (p<0.05) the level of MDA, whereas decreasing (p<0.05) the activities of GSH-Px (in the duodenum) and CAT of broilers. Dietary supplementation of 500 mg/kg TB increased (p<0.05) the activities of CAT (in the ileum) and GSH-Px (in the jejunum, p = 0.055) in comparison with the control group (Table 6). Additionally, there were significant interactions between LPS and TB in the activities of CAT (in the jejunum), TNOS (in the ileum), and iNOS (in the jejunum). The results showed that broilers receiving 500 mg/kg TB had lower activities of TNOS (in the ileum) and iNOS (in the jejunum), but higher activity of CAT (in the jejunum) post administration of LPS (Table 6).
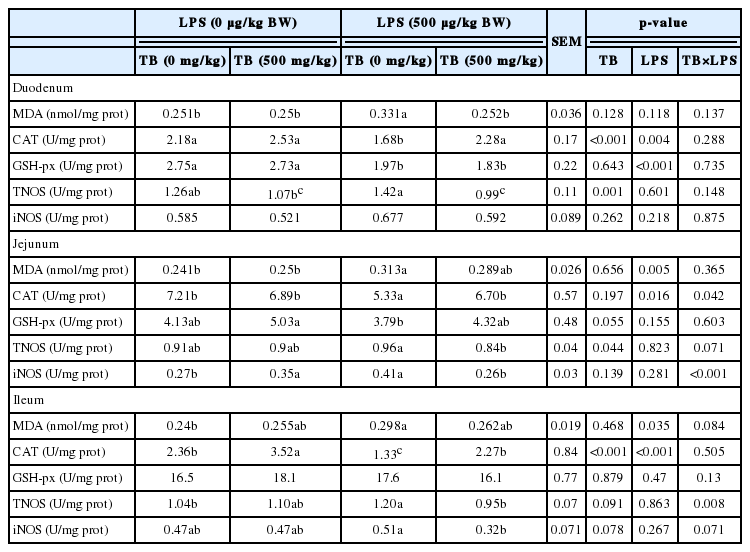
Effects of TB on parameters related to intestinal oxidative capacity in LPS-challenged broilers
DISCUSSION
Butyrate has been reported to improve animal performance by enhancing intestinal development (Lu et al., 2008), inhibiting the growth of pathogenic bacteria (Mallo et al., 2012), modulating immune response (Jerzsele et al., 2012), and increasing the carcass weight and breast meat of broilers (Leeson et al., 2005). Over the last decade, however, there were inconsistence reports regarding the efficiency of butyrate on animal growth performance. Available evidence showed that an additive level of butyrate (or sodium butyrate) higher than 3,000 mg/kg in diet was likely to work (Leeson et al., 2005; Manzanilla et al., 2006; Panda et al., 2009; Czerwiński et al., 2012; Jerzsele et al., 2012). In the present study, dietary 500 mg/kg TB, that on a molar basis TB was equivalent to 3-fold butyrate, did not affect the growth performance of broilers, which may be attributed to the low level of TB supplementation. Though the concentration of butyrate released from TB in the intestine of broilers was not determined in the current study, Davis (1930) has reported that the average digestibility of TB in poultry was 86.9 per cent, inferring that more than 86 percent of dietary TB will be absorbed in the intestine of broilers. On the other hand, broilers challenged with LPS exhibited lower ADG than other groups, and TB (500 mg/kg) diet did not improve the ADG. Again, the possible explanation was the low level of TB supplemented in the diet.
As expected, LPS challenge increased the levels of the pro-inflammatory cytokines (IL-1β, IL-6 in the duodenum and jejunum, and PGE2 in the duodenum) in broilers (Table 2). The effects of LPS were due, in part, to its ability to stimulate macrophages to synthesize and secrete proinflammatory cytokines (Lehmann et al., 2008). The reduction of proinflammatory cytokines by dietary supplement of TB in the present study (Table 2) indicates that TB can alleviate the effect of LPS in increasing production of the cytokines in broilers. This observation was in agreement with the results reported by Zhang et al. (2011), in which dietary sodium butyrate not only decreased the serum IL-6 and TNF-α in LPS-challenged chickens but also reduced those concentrations in normally-reared birds. Inhibition of the release of pro-inflammatory cytokines by sodium butyrate in vitro and in vivo has also been reported by others (Nancey et al., 2002; Ogawa et al., 2003; Lu et al., 2008).
The villus height and crypt depth are closely associated with absorptive capacity of intestine tract (Manzanilla et al., 2006). A larger ratio of villus: crypt reflects higher capacity for digestion and absorption (Hou et al., 2010). Our results showed that villus height and villus: crypt were decreased in duodenum, but crypt depth was increased in the ileum of LPS-challenged chickens, which were well in line with the previous study showing that duodenal and jejunal villus height decreased after LPS administration (Hu et al., 2011; Zhang et al., 2013). Interestingly, dietary supplementation of 500 mg/kg TB also decreased the villus height and villus height: crypt in the duodenum of broilers. The reasons for the observation were unknown. Jerzsele et al. (2012) found that 1,500 mg/kg protected sodium butyrate increased the villus length, but did not affect the ratio of villus: crypt in broilers. Similarly, Czerwiński et al. (2012) also observed only villus height were increased (in the jejunum) in broilers received 300 mg/kg sodium butyrate. However, Manzanilla et al. (2006) reported that 3,000 mg/kg butyrate didn’t affect the villus height, but decreased the ratio of villus: crypt ratio by increasing the crypt depth. A high level of disaccharidase may indicate an improvement of the digestive activity of small intestine (Claus et al., 2007). In the present study, dietary supplementation of TB significantly increased the activity of sucrase in the duodenum of broilers. Previous studies reported that butyrate elevated the activity of sucrase in pigs, neutralized the decreased in sucrase activity elicited by LPS (Claus et al., 2007), and stimulated intestinal epithelial cells to synthesize disaccharidase through regulating DNA transcription and histone acetylation (Chung et al., 1985; Fusunyan et al., 1999). In this regard, a dietary supplement of TB is beneficial for improving the activities of digestive activities of small intestine in broilers. In the present study, the activity of isomaltase was increased in the jejunum, but decreased in the ileum of LPS-challenged broilers when compared with the control group, indicating the regional difference of intestinal isomaltase in response to LPS challenge.
LPS challenge can result in mitochondrial injury in intestinal cells, reduce the oxidation of fatty acid (Feingold et al., 2008), and alter cellular energy metabolism (Hou et al., 2011). In the present study, a reduction in ATP level and an increase in AMP/ATP ratio were observed in the jejunum and ileum of LPS-challenged broilers. Similarly, Hou et al. (2011) observed that LPS treatment reduced ATP and AEC and altered the cellular energy status in mucosa, indicating alterations in intestinal energy metabolism post administration of LPS. Since butyric acid can act as an energy source by undergoing β oxidation to acetyl-CoA and generating ATP (Donohoe et al., 2011), diet supplementation of protected butyrate or ester form may improve intestinal energy metabolism. Indeed, our results showed that dietary supplementation with TB increased the levels of ATP (in the duodenum and ileum), ADP and TAN (in the ileum), while decreasing the ratio AMP/ATP (in the duodenum and ileum) of broilers. Moreover, broilers receiving TB diet exhibited higher levels of ATP, ADP, and TAN in the ileum when challenged with LPS. Therefore, dietary supplementation of TB alleviated intestinal energy depletion induced by LPS in broilers. Further studies are warranted to determine the concentrations of butyrate released from TB in the small intestine.
MDA is well known as an indicative of lipid peroxidation (Kotunia et al., 2004), while the CAT, superoxide dismutase (SOD), and GSH-Px are anti-oxidative enzymes scavenging the free radicals. Our results showed that LPS challenge increased the concentration of MDA in the jejunum and ileum, but reduced the activities of CAT and duodenal GSH-Px, indicating that LPS challenge induced the oxidative stress in the small intestine. These results were in a good agreement with our previous study (Hou et al., 2013). Additionally, iNOS produces a quantitatively larger amount of nitric oxide (NO), whereas the constitutive form of NOS (cNOS) generates relatively a small amount of NO in the small intestine (Wang et al., 2009). LPS administration also induced an increase in the activities of TNOS and iNOS in the present study. Previous studies have reported that LPS challenge increased the intestinal NOS activity, and this may be attributed, at least in part, to an increase in NOS II mRNA and protein abundance (Weisbrodt et al., 1996; Zhang et al., 2013). A dietary supplement of butyrate reduced the level of MDA and increased serum activities of SOD and CAT in chickens (Zhang et al., 2011). Our results also demonstrated that a dietary supplement of 500 mg/kg TB increased the activity of CAT in the ileum. Moreover, it was noteworthy that broilers receiving TB diet exhibited a higher activity of jejunal CAT but lower activities of ileal TNOS and jejunal iNOS when challenged with LPS (Table 6). Butyrate was reported to enhance the human-catalase (hCAT) expression (Sauer et al., 2007) and suppress iNOS gene expression (Parka et al., 2005). It was apparent that TB affected the activity of CAT and iNOS in the intestine by modulating the gene expressions of these enzymes. Collectively, our results suggested that dietary supplementation of TB may attenuate the intestinal oxidative stress induced by LPS. The underlying mechanisms need to be further studied.
In conclusion, dietary supplementation of 500 mg/kg TB inhibited the proinflammatory cytokines release, improved the intestinal energy status, and enhanced the intestinal anti-oxidative capacity in LPS-challenged broilers.
ACKNOWLEDGMENTS
This work was jointly supported by National Key Technology R&D Program of China during the 12th five-year plan period (2012BAD39B04) and China Spark Program (2013GA760002).
Notes
CONFLICT OF INTEREST
We certify that there is no conflict of interest with any financial organization regarding the material discussed in the manuscript.