Genetic Analysis of Milk Yield in First-Lactation Holstein Friesian in Ethiopia: A Lactation Average vs Random Regression Test-Day Model Analysis
Article information
Abstract
The development of effective genetic evaluations and selection of sires requires accurate estimates of genetic parameters for all economically important traits in the breeding goal. The main objective of this study was to assess the relative performance of the traditional lactation average model (LAM) against the random regression test-day model (RRM) in the estimation of genetic parameters and prediction of breeding values for Holstein Friesian herds in Ethiopia. The data used consisted of 6,500 test-day (TD) records from 800 first-lactation Holstein Friesian cows that calved between 1997 and 2013. Co-variance components were estimated using the average information restricted maximum likelihood method under single trait animal model. The estimate of heritability for first-lactation milk yield was 0.30 from LAM whilst estimates from the RRM model ranged from 0.17 to 0.29 for the different stages of lactation. Genetic correlations between different TDs in first-lactation Holstein Friesian ranged from 0.37 to 0.99. The observed genetic correlation was less than unity between milk yields at different TDs, which indicated that the assumption of LAM may not be optimal for accurate evaluation of the genetic merit of animals. A close look at estimated breeding values from both models showed that RRM had higher standard deviation compared to LAM indicating that the TD model makes efficient utilization of TD information. Correlations of breeding values between models ranged from 0.90 to 0.96 for different group of sires and cows and marked re-rankings were observed in top sires and cows in moving from the traditional LAM to RRM evaluations.
INTRODUCTION
In dairy production, genetic change and improvements in milk production performance are realized when the parents of the next generation of animals are accurately chosen. For a dairy herd, this means choosing the sires and dams on the basis of their estimated genetic merit for mating to produce potential replacement heifers that have high expected genetic merit. Therefore, accurate estimation of the genetic merit of dairy animals has long been the subject in many studies and great advances have been made in the last decades.
In most tropical environments, milk production is an important part of livestock farming (de Leeuw et al., 1999). As a result, improving the genetic potential of dairy cows has been taken as one of the options to increase milk productivity in local herds. However, factors related to lack of performance recording, small herd size, insufficient artificial insemination services and lack of clearly defined breeding objectives have been the main problems (Kefena et al., 2011). Furthermore, there is still a gap in the use of advances for the estimation of the genetic merit of animals especially applying modern methodologies. Particularly, in dairy cattle, the selection for milk yield in most countries is based on the use of the traditional 305-d lactation records (Hammoud and Salem, 2013; Goshu et al., 2014). In this method, incomplete lactations or part lactations are extended to 305-d leaving a room for introduction of some errors. Moreover, the arbitrary standardization of lactation yields to 305-d and the simple compilation of test-day (TD) records into 305-d lactation records, as practiced in most countries, suffers from lack of correction for short term environmental effects (Schaeffer et al., 2000). Thus, with 305-d lactation average models (LAM) short term changes in environment during lactation are usually ignored, and a simple herd-year-season effect is often used to account for the average of environmental effects on each TD (Bilal and Khan, 2009). In most cases, the projection factors used to extend incomplete or part lactations assume a standard shape of the lactation curve for a cow of a particular breed and lactation number. With such an assumption, cows that have greater persistency could generally be underestimated, whilst those that are less persistent could be overestimated which would cause a bias in sire evaluation (Bilal and Khan, 2009).
Recently, records from single and early lactation TDs have been used in animal evaluations which enable farmers to make an earlier selection decisions (Negussie et al., 2008). The use of TD records directly as opposed to 305-d accounts for all the factors affecting milk yield on each TD, which improves the accuracy of genetic evaluation and provides better modeling and extending of part lactation is no longer needed. It also avoids the use of factors to extend partial lactation records (Wiggans and Goddard, 1996). A genetic analysis based on LAM does not utilize all information in the data, as it does not allow simultaneous estimation of stage of lactation effects (Odegard et al., 2003). Evaluation of the genetic merit for milk yield may benefit from analyses based on the TD models.
So far, in Ethiopia selection of dams and potential bull calves have been based on 305-d lactation milk yields. Meanwhile a dairy herd performance recording system is established in Ethiopia which will allow genetic evaluations that utilizes all TD data from herds under recording. So far, Gebreyohannes (2013) worked on Ethiopian multi breed dairy cattle population as first step for the application of random regression TD model (RRM) for the estimation of genetic parameters based on TD records. However, still there is limited information on the applicability of TD model evaluation methods in the tropical diary production systems and particularly estimates of genetic parameters and breeding values for Ethiopian Holstein Friesian fitting TD models are in general lacking. The use of accurate model definitions in genetic analyses and accurate estimates of parameters contributes to increased efficiency of selection programs. Therefore, the objectives of this study were to assess the relative performance of the traditional lactation average and the random regression animal model in estimating genetic parameters and predicting the genetic merit of Holstein Friesian in Ethiopia.
MATERIALS AND METHODS
Data
Data for this study consisted of TD milk yield records of first-lactation Holstein Friesian cows that calved from 1997 to 2013 and belonged to two different herds. The data were extracted from the recently established Ethiopian national dairy cattle milk recording database. Records from all other herds were still too few to be included into the analyses. For this study, two different data sets were prepared and the first data set was the 305-d lactation records and the second was TD records. The standard 305-d milk yield for each animal was estimated from TD milk yield records using test interval method as described by Sargent (1968) as follows:
Where,
M1, M2 … Mn = TD milk yield (kg);
I1, I2 … In−1 = the intervals between recording dates (days);
I0 = the interval between the lactation period start date and the first recording date (days) and
In = the interval between the last recording date and the 305th lactation (days).
With the interval method, 305-d lactation data from 800 cows with records were prepared with an average milk yield of 3,396.9±1,021.7 kg (Table 1). To keep consistency the TD data was also prepared by following certain data edition rules. The TD data was edited in such a way that records prior to days in milk (DIM) 5 and after DIM 305 and cows with less than 5 TD records were excluded for the estimation of genetic parameters. In addition, records of cows with age at calving less than 20 months or greater than 54 months were excluded. Age at calving was grouped into five classes (in months). These included cows less than 27, 28 to 33, 34 to 39, 40 to 45 and above 45 months of age at first calving. The calving season was divided into three distinct seasons of long dry (October to February), short rainy (March to May) and long rainy (June to September). The TD data included 6,850 milk yield records from 800 cows with an average of 8.5 TD milk records per cow. The average TD milk yield was 11.1±3.9 kg (Table 1). The final data set used in the study included 800 cows which were daughters of 149 sires. The pedigree file contained 1,779 animals. Detailed description of the data is presented in Table 1.
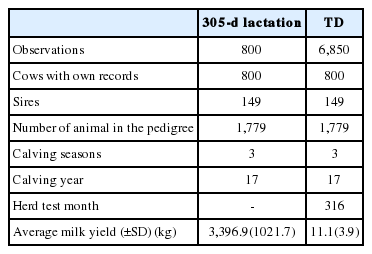
Description of statistics of the 305-d lactation and test-day (TD) milk yield data sets
Models
Lactation average model (LAM)
The LAM is a single trait animal model, which is based on 305-d lactation milk yield records. In this study, LAM was used to compare its performance against the RRM in the evaluation of the genetic merit of sires and cows.
The description of the LAM used for the analysis of 305-d milk yield was:
Where,
ÿijksl = lactation milk yield record;
hi = fixed effect of herd;
csj = fixed effect of calving season;
agk= fixed effect of age at calving;
sys = random effects of sire×calving year interaction;
al = random animal genetic effect and
ɛijsl = residual effect
Random regression test-day model (RRM)
The RRM for the analysis of TD milk yield was selected because of its ability to model correctly changes in mean and dispersion with time (Meyer, 2003). In this analysis, the permanent environmental and genetic animal effects were modeled by Legendre polynomials of order two. The main reason for this was that preliminary comparative analysis involving several different TD models have shown that for the data and population in question a RRMs with second order Legendre polynomial for permanent environmental and additive genetic effects were found to be the best by most model selection criteria.
In this analysis, the fixed lactation curve for the TD model on DIM (d) was modeled by a combination of Legendre polynomial and Wilmink function (Wilmink, 1987). Wilmink function with exponential term −0.05 along with combinations of orthogonal Legendre polynomials for milk yield trait have also been used by several authors (Lidauer et al., 2003; Negussie et al., 2008; Santos et al., 2013).
The RRM used for the analysis of the TD data can be described as:
Where,
yijklmo= milk yield records on TD o;
hi = fixed effect of herd;
bjn = vector with fixed regressions coefficient specific to calving season subclass j and measured on DIM (d);
agp = fixed effect of age at calving;
syk = random sire×calving year interaction;
html = random herd test month effect;
pm = vector with random permanent environmental random regression coefficients specific effects of cow m;
am = vector with additive genetic random regression coefficients specific to the animal effect of cow m and
ɛijklmo = residual effect
The variance structure for the random effects of the model was as follows:
Where, I is the identity matrix, σs2 and σh2 is the variance of the random sy and htm effect, respectively, A is the matrix of additive genetic relationships among animals, ⊗ is the Kronecker product, P and G are covariance matrices for permanent environmental and additive genetic effects, respectively, R is the diagonal matrix of the form Iσe2, and σe2 is the residual variance.
Estimation of genetic parameters
Variance components for both LAM and RRM were estimated by Average Information Restricted Maximum Likelihood method using DMU program (Madsen and Jensen, 2013).
Heritability
Lactation average model (LAM)
Estimate of heritability for a 305-d milk yield was calculated as a ratio of genetic variance (
Random regression test-day model (RRM)
In the RRM the additive genetic variance for DIM
Where, G is the covariance matrix of the random additive genetic regression coefficient and d is DIM.
Similarly, the permanent environmental variance for DIM
Where, Pe is the covariance matrix of the random permanent environment regression coefficient and d is DIM.
Heritability for a particular DIM d in lactation were calculated by dividing the estimated genetic variance
Genetic and phenotypic correlations
The genetic correlation between two days in lactation di and dj was calculated by dividing the additive genetic covariance between days di and dj by the product of the square root of the genetic variances of the days di and dj.
Similarly, the phenotypic correlation was calculated dividing the phenotypic covariance between days di and dj, divided by the product of square root of phenotypic variances of day di and dj.
Where, P is the covariance matrix of the phenotypic regression coefficient
Estimation of breeding value
For the estimation of breeding values for both models, mixed model equations were solved by the preconditioned conjugate gradient method with iteration on data techniques as shown in Strandén and Lidauer (1999). Solutions for additive genetic (â) effects were then used to form estimated breeding value (EBV) corresponding to 305-d.
For the LAM, EBVs for 305-d for animal l was calculated as:
For the RRM, EBVs for animal l was calculated as:
Comparison of model performances
The performance of LAM and RRM was compared in terms of EBVs and evaluation of the genetic merit of breeding animals. The EBVs from the two models were analyzed to understand the actual differences between LAM and RRM in assessing the genetic merit of breeding animal’s. The analysis was done in terms of standard deviation (SD) of EBVs, correlation between EBVs and also by assessing the difference between the models in the ranking of top sires and cow. The analyses of breeding values involved two groups of sires and one group of cows. The two groups of Holstein Friesian sires considered were: i) sires with less than 15 daughters and ii) sires with greater or equal to 15 daughters. In the analyses of breeding values of cows for milk yield, cows born after 2007 were used.
RESULTS AND DISCUSSION
Average milk yield and test-day production trends
The overall average TD milk yield during first-lactation for Holstein Friesian cows in Ethiopian herds was 11.1 (±3.9) kg. On the other hand, the average milk yield for 305-d calculated with the interval method was 3,396.9 (±1,021.7) kg (Table 1). Previous studies on part of the same data have reported a lactation mean of 3,084 and 3,661 kg by Goshu et al. (2014) and Ayalew (2014), respectively. The slight difference in the mean lactation yield between the current study and the above reports could be related to the type and size of dataset, calving year and the methods and functions used for adjusting the phenotypic 305-dmilk yield.
The phenotypic trend for TD milk yield showed that during the beginning of lactation milk yield was lower and peaks up immediately at DIM 30 to 35. After peak lactation milk yield showed a gradual but consistent gentle decline until the end of lactation period (Figure 1). A more or less similar trend has been reported for Holstein cattle by Shadparvar and Yazdanshenas (2005) and Abdullahpour et al. (2010). One interesting result was the peak of the lactation period attained very early in lactation as compared to other populations. For instance, in Holstein cows in Brazil peak lactation were attained in the second month of lactation (Santos et al., 2013).
Average test-day milk yield (kg) at different stages in first-lactation Holstein Friesian cow.
Estimates of genetic parameters
Heritabilities
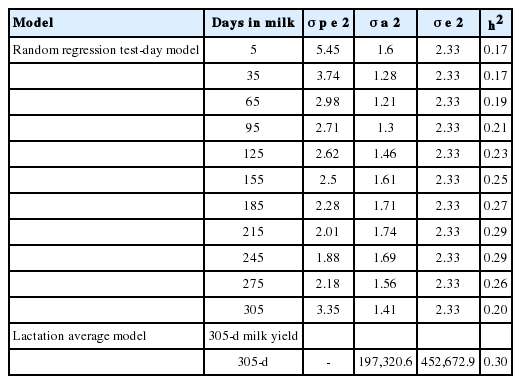
Heritabilities for daily TD milk yields are presented in Table 2. The estimates of heritabilities for TD milk yield had more or less a similar trend with additive genetic variance across the different stages of lactation (Figure 2). Estimates in general were lower at the beginning of lactation and then it increased consistently towards the end of lactation before starting to decline in late lactation. The main reasons for the slightly lower heritabilities observed at both ends of the lactation trajectory could be due to the higher estimates of permanent environmental effects (Figure 2). Such a trend of lower heritability values at both ends of the lactation trajectory has been reported by Druet et al. (2003) for French Holstein cattle, Negussie et al. (2008) for Nordic Red cattle and Abdullahpour et al. (2010) and Cobuci et al. (2011) for Iranian Holstein cattle and Brazil Holstein cattle, respectively. However, Cobuci et al. (2005) and Gebreyohannes (2013) working on Brazil Holstein and Ethiopian multi breed cattle population, respectively, reported an increasing trend for heritability of milk yield from the start to the end of lactation. On the other hand, Shadparvar and Yazdanshenas (2005) and Abdullahpour et al. (2013) have reported no trend for heritability estimates working on first-lactation Holstein cattle.
Estimates of permanent environmental (
Estimated of additive genetic, permanent environmental and residual variances across first-lactation for Holstein Friesian from the random regression test-day model.
In literature, some differences between heritability estimates of LAM and RRM have been reported. In the current study, the estimate for first-lactation milk yield from the LAM was 0.30 whilst estimates from the RRM ranged from 0.17 to 0.29 (Table 2). The estimate of 0.30 from LAM is slightly higher than the estimates by Akbaş et al. (1999), Shadparvar and Yazdanshenas (2005), Santos et al. (2013) and Goshu et al. (2014). In general, in the current study, the heritability of milk yield from LAM was slightly higher than the estimates from the TD model. Strabel and Szwczkowski (1997) and Kim et al. (2009) reported heritability estimates of milk yield that were slightly lower than estimates from a comparable TD model whilst Akbaş et al. (1999), Lidauer et al. (2003) and Shadparvar and Yazdanshenas (2005) for Holstein and Santos et al. (2013) for Guzerat cattle reported higher heritabilities for LAM than for the TD model. The main reasons contributing to these differences could be differences in the data set, types of functions, number of observation and data edition criteria.
Genetic and phenotypic correlations
Estimates of genetic and phenotypic correlations for selected DIM from the RRM are presented in Table 3. Genetic correlations between TD milk yield of first-lactation Holstein Friesian in Ethiopian herds ranged from 0.37 to 0.99 whilst the estimates for phenotypic correlations ranged from 0.29 to 0.71. In general, it was observed that genetic correlations between TD that were close to each other were higher compared to those TD that were further apart. The fact that the genetic correlations in first-lactation is less than unity indicated that milk yield at different stages of lactation are clearly different traits implying that they are controlled by different sets of genes and should therefore be treated as different traits. In view of this fact, the combining of the different TD records in to one single value as practiced with the LAM will lead to a less accurate evaluation of the actual genetic merit of animals for milk yield. The general trend of both the genetic and phenotypic correlations observed was in this study are in line with the estimates reported by Lidauer et al. (2003), El Faro et al. (2008), Negussie et al. (2008) and Cobuci et al. (2011). However, El Faro et al. (2008), working on Caracu cattle population reported a much lower correlation between the different DIM particularly towards the end of lactation. In general, the reason for this kind of trend of lower or negative correlations between distant TDs could be due to the type of function used or the paucity of available information towards the end of the lactation period.
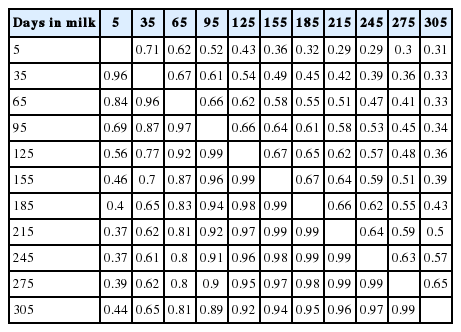
Genetic (below the diagonal) and phenotypic correlations (above the diagonal) between selected days in milk for Holstein Friesian from the random regression test-day model
Analyses of breeding values
The analysis of EBVs from the two models showed that EBVs from LAM ranged from −585 to 686 kg, whilst those from RRM ranged from −680 to 1,109 kg. The SD of EBVs for first-lactation milk yield from LAM and RRM are presented in Table 4. For all groups of sires and cows analyzed, the SD of EBVs from the RRM was found to be higher than LAM. Higher SD of EBVs for TD models compared to LAMs have been reported for somatic cell score (Negussie et al., 2006) and milk yield (Lidauer et al., 2003) for the Nordic Red cattle. The increase in the SD of EBVs in moving from LAM to a RRM was relatively higher for the sire group with ≥15 daughters than for other sire and cow groups. Negussie et al. (2006) working on both models using data from the Nordic Red cattle concluded that the increase in the SD of EBVs by RRM over and above that from LAM could be an indication of better utilization of information in TD records by revealing more genetic variation and would enable the selection of superior sires or cows.
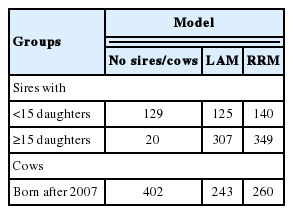
Standard deviations of estimated breeding values (EBVs) from lactation average model (LAM) and random regression test-day model (RRM) for group of sires and cows
A close look at the estimates of correlations between EBVs from the two different models for the different groups of sires and cows would enable to judge the magnitude of changes in animal evaluations in cases of moving from the traditional LAM to the RRM. In this respect, the correlations between EBVs of the two models were calculated for the different groups of sires and cows (Table 5). The result showed that correlations between the EBVs from two models ranged from 0.90 to 0.96 for the different groups of animals. In comparison, the correlation between EBVs from LAM and RRM were slightly higher for the groups of sires than for the group of cows. The correlations between EBVs for the groups of sires were 0.95 and 0.96 whilst for the cows group it was 0.90. In general, the correlations between sires and cows EBVs estimated in this study from LAM and RRM was slightly higher than those reported in literature (Lidauer et al., 2003). Basically, a high correlation between sires and cows EBVs from any two different models would indicate equal ability in evaluation of the genetic merit of breeding animals, particularly for sires with large number of daughters and cows with large number of observations. The results from this study showed slightly lower correlations between EBVs from the LAM and RRM indicating a possible re-ranking and rank changes for sires and cows. Particularly, the slightly lower correlations for the cows groups could be explained by the availability less information for cows compared to sires.
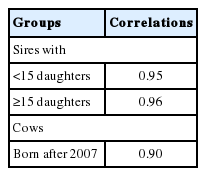
Correlations between estimated breeding values from lactation average and random regression test-day models for groups of sires and cows
To assess the effects of the relatively lower correlations between the EBVs from the LAM and RRM on evaluation of sires and cows, rank changes in the top 20 and 50 sires and cows groups were assessed. The result obtained showed that there were marked re-rankings among the top sires and cows. This is quite expected and is in line with the correlations observed between the two models. When sires were ranked with respect to their EBVs from LAM and RRM, 5 different sires appeared in the top 20 and 6 different sires in the top 50. Similarly, when cows were ranked, 8 different cows appeared in the top 20 cows and 14 different cows in the top 50. The percent of sires on the top 20 group that are common and are on both LAM and RRM lists was 75% and 88% for the top 50 group of sires. On the other hand, for the cows it was 60% for the top 20 cows group and was 72% for the top 50 cows group. The result from the present study indicates that the ranking of cows was much more affected in case of moving from LAM to RRM. In general, our result in terms of the percent of sires and cows on both lists were slightly lower than those reported by Akbaş et al. (1999). Lidauer et al. (2003) also reported negligible difference on the ranking ability of the RRM and LAM for milk yield trait working on production traits using data from the Nordic Red cattle.
CONCLUSION
Evaluation of the genetic merit of dairy cows requires accurate estimates of genetic parameters and best models for the prediction of breeding values. The estimates of genetic parameters for first-lactation milk yield showed that genetic correlations between TD milk yields ranged from 0.37 to 0.99. This indicated that milk yield at different TDs are indeed different traits. Therefore, combining them in to a single 305-d lactation yield as practiced with the traditional LAM may lead to bias in the evaluation of the genetic merit of dairy animals. The comparison between the LAM and RRM showed that the use of TD models for the genetic evaluation of animals resulted in more efficient use of available information as evidenced with the higher SD EBVs for the different groups of breeding animals. The correlation between breeding values from the two models was slightly lower and ranged from 0.90 to 0.96. This is therefore an indication that, depending on the SDs and correlations between the EBVs from the two models, some changes in the ranking of top sires and cows are expected.
IMPLICATIONS
Accurate evaluation of the genetic merit of animals is the most important step in making selection decisions. The comparison between the traditional LAM and RRM showed the relative performance of these models in evaluating the genetic merit of animals. The TD model has shown better qualities over the traditional LAM. The use of TD models avoids extension of part or incomplete lactations and provides better correction for short term environmental effects. This, by shortening the generation interval would help to maximize genetic progress. Therefore TD models would be one of the best options for the accurate evaluation of the genetic merit of dairy cows in tropical environments.
ACKNOWLEDGMENTS
The authors would like to acknowledge the Ethiopian Ministry of Agriculture, the National Artificial Insemination Center for providing the data. The authors are also grateful to the Natural Resources Institute Finland, Department of Biometrical Genetics for their support in the data analyses. Addis Ababa University and Wolaita Sodo University are acknowledged for their financial support.