Genetic Parameters for Milk Yield and Lactation Persistency Using Random Regression Models in Girolando Cattle
Article information
Abstract
A total of 32,817 test-day milk yield (TDMY) records of the first lactation of 4,056 Girolando cows daughters of 276 sires, collected from 118 herds between 2000 and 2011 were utilized to estimate the genetic parameters for TDMY via random regression models (RRM) using Legendre’s polynomial functions whose orders varied from 3 to 5. In addition, nine measures of persistency in milk yield (PSi) and the genetic trend of 305-day milk yield (305MY) were evaluated. The fit quality criteria used indicated RRM employing the Legendre’s polynomial of orders 3 and 5 for fitting the genetic additive and permanent environment effects, respectively, as the best model. The heritability and genetic correlation for TDMY throughout the lactation, obtained with the best model, varied from 0.18 to 0.23 and from −0.03 to 1.00, respectively. The heritability and genetic correlation for persistency and 305MY varied from 0.10 to 0.33 and from −0.98 to 1.00, respectively. The use of PS7 would be the most suitable option for the evaluation of Girolando cattle. The estimated breeding values for 305MY of sires and cows showed significant and positive genetic trends. Thus, the use of selection indices would be indicated in the genetic evaluation of Girolando cattle for both traits.
INTRODUCTION
In pasture based milk production systems of the Brazilian tropical and subtropical regions there is a predominance of the Girolando breed, animals which have better adaptation to the particular climatic conditions of these regions. The breed was developed from the 1940s by crossing Gir and Holstein. Majority of the Brazilian milk production, corresponding to 80% of the country’s total production, comes from animals of this breed. Genetic evaluations for milk yield in Girolando breed have been based on accumulated milk production throughout lactation for a 305-days milk yield period (305MY). To calculate 305MY, the projection factors are used and the accuracy of these calculations depends on the quality of these factors as well as the quality and quantity of milk yield records available during this period. Alternatively, methods that directly use the test-day milk yield (TDMY) (random regression models, RRM) have been proposed in recent years and may overcome the problems arising from the use of 305MY.
The accuracy of the analysis by RRM depends crucially on the definition of the mathematical function to model fixed and random effects that act on the TDMY. Among various functions, Legendre’s polynomials have been the most used ones. The random effects are usually modeled with polynomials of the same order (Cobuci et al., 2006; Cobuci and Costa, 2012), however, evidences in favor of using lower order polynomials to model the additive genetic effect in comparison to the permanent environment effect have also been reported (Pool et al., 2000; Lopez-Romero and Carabaño, 2003; Bignardi et al., 2009). Besides estimating genetic parameters along the lactation curve, the RRM also allow the prediction of breeding values for lactation persistency, as these values are estimated at any time during lactation period (Jamrozik et al., 1997). The lactation persistency is defined as the ability of the cow in maintaining the level of milk yield after reaching the peak lactation and it is related to the reduction of production costs (Cobuci et al., 2007). Several measures of persistency have been proposed (Jamrozik et al., 1997; Jakobsen et al., 2002; De Roos et al., 2004), but there is no consensus regarding the best one to describe this feature.
Recent studies on assessment of lactation persistency in tropical regions reported unfavorable genetic association between milk yield and persistency (Dorneles et al., 2009b; Cobuci et al., 2012; Khorshidie et al., 2012; Pereira et al., 2012). Despite many studies on genetic parameter estimation via RRM as well as evaluation of lactation persistency in Holstein cows have been carried out in Brazil, there are no studies on Girolando breed. Therefore, by assessing Girolando breed via RRM this study aimed to: i) estimate (co)variance components and genetic parameters for TDMY; ii) evaluate different measures of lactation persistency in order to identify the most appropriate measure for use in genetic evaluation; iii) estimate genetic trends for TDMY.
MATERIAL AND METHODS
The data used in this study are from the National Animal Science Archive of Dairy Cattle, provided by the Genetic Improvement Program for Girolando Cattle (PMGG) under management of Embrapa Dairy Cattle, in partnership with the Associação Brasileira dos Criadores de Girolando (ABCG). From this database were extracted 74,023 TDMY records using the first lactations of 9,162 Girolando cows that calved from 2000 to 2011 and with age at first calving varying from 23 to 56 months.
Aiming to obtain greater data consistency, only data from cows that had their first TDMY record up to 45 days after calving or with consecutive interval between TDMY exceeding 45 days were included; cows having at least four TDMY records per lactation collected between 5 and 305 days-in-milk (DIM); and those cows with both parents known. Contemporary group was characterized by classes of herd-year-month (HYM) of control, and required a minimum of three cows per class; and with those cows that were daughters of sires possessing at least three daughters into two herds. The calving seasons were defined as rainy season (October to March) and dry season (April to September).
After data editing, remained 32,817 TDMY records from 4,056 first calving cows, belonging to six genetic groups (1/4H to 3/4G, 3/8H to 5/8G, 1/2H to 1/2G, 5/8H to 3/8G, 3/4H to 1/4G, 7/8H to 1/8G) as their racial composition of Holstein (H)-Gir (G), daughters of 276 sires collected from 118 herds between 2000 and 2011. Notes that in this editing data were excluded more than half cows (61.4%), however the proportion of cows (and records) excluded was similar between the genetic groups ranging from 56.9% (3/8H to 5/8G) to 66.0% (5/8H to 3/8G), where 3/8H to 5/8G, 1/2H to 1/2G and 5/8H to 3/8G groups highlighted by the number of animals through the years (Figure 1). The pedigree file used in the calculation of coefficients of the Wright’s numerator relationship matrix contained a total of 8,571 animals. Table 1 provides additional details of data structure used in analyzes.
Distribution of the number of cows with records collected between 2000 and 2011 according to the genetic group (1/4HG to 7/8HG).
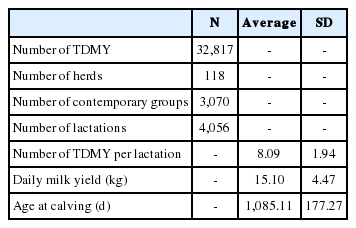
Descriptive statistics of the analyzed data
Distribution of the number of TDMY records and the corresponding daily milk yield over the lactation are showed in Figure 2. The daily milk yield followed a typical lactation curve, increasing from the beginning of lactation until full production around the 64th day with 17.49 kg of milk, corresponding to the lactation peak period; afterwards the output was gradually decreased until the end of lactation. The number of TDMY records showed similar trend in milk yield, however, with higher fluctuations along the lactation curve (Figure 2).

Number of test-day milk yield (TDMY) records (▲) and average TDMY (□) at approximately one-month intervals during the lactation period.
Initially, six RRM were tested in order to identify the one which best fit to the production records. Models ranged in the orders of the Legendre’s polynomial used to adjust the additive genetic effects and permanent environmental effects. The general structure of the RRM was:
where: yijkln is the nth observation, recorded on the lactation day (t) of the animal (l) from genetic group (k), corresponding to the calving season (j), and control class of HYM (i); HYMi the fixed effect of the nth control class of HYM (i = 1,…, 3070); ECj the fixed effect of the jth calving season (j = 1 and 2); GGk the fixed effect of the kth cow genetic group (k = 1,…,6); bf the fth regression coefficient for linear (f = 1) and quadratic (f = 2) effects of the cows’ age xl at calving, in months; βr are the rth fixed regression coefficients, specific for modeling the average lactation curve of the population, αlr and γlr are the rth random regression coefficients that describe the trajectory of the additive genetic effects and permanent environmental effects of the lth cow, respectively; ψr(t) is the covariate of regression function according to lactation day (t); Ko is the adjustment order for the fixed regression coefficients corresponding to the average lactation curve of the population (Ko = 3); Ka and Kpe are the adjustment orders of the Legendre’s polynomial for the genetic additive random effects and permanent environmental effects, respectively, which ranged from 3 to 5, and ɛijkln is the residual random effect associated with yijkln.
The models are referred to as LegKa, Kpe, where Ka and Kpe represent the orders of Legendre’s polynomials adjusted for additive genetic effects and permanent environmental effects, respectively. For example, the model Leg3,4 denotes an analysis that adjusts Legendre’s polynomials of third and fourth order to the additive genetic effects and permanent environmental effects, respectively.
The residual variance was considered heterogeneous throughout the lactation period, as during prior analysis changes in the residual variance were detected over the lactation period. Therefore, the following classes of residual variance were defined: 5 to 30, 31 to 180, 181 to 240, 241 to 260, 261 to 280, and 281 to 305 DIM.
The RRM were compared using the following statistical criteria: the Akaike’s information criterion (AIC) = −2LogL+ 2p (Akaike, 1973); the Schwarz’s Bayesian information criterion (BIC) = −2LogL+pLog(n) (Schwarz, 1978); the logarithm of the likelihood function (−2logL); the weighted residual variance,
Using the RRM that best fit the data, identified by the comparison criteria described above, genetic parameters were obtained for nine measures of persistency in milk yield (PSi) (Table 2) and milk yield up to 305 DIM, as well as the genetic and permanent environmental correlations between these persistency measures and between these measures and 305MY. Lower values of persistency measures indicate greater lactation persistency, except for PS5, where higher values indicate greater lactation persistency.

Measurements of persistency in milk yield
The breeding value for milk yield to the animal (i) on any day (t) in milk, for example, to the RRM Leg3,3, Leg3,4 and Leg3,5 (Ka = 3) can be obtained as follows:
Therefore, the EBV to 305MY (EBV305) of the animal (i) is achieved by:
where: Zc305MYg is the vector sum of the coefficients of the Legendre’s polynomials, specific to milk yield over the full lactation.
The genetic trend for 305MY was calculated from the annual average of sires and cows EBV, according to the regression model:
where: yd is the mean EBV of the dth year of birth; Xd is the dth year of birth; and b0 and b1, are respectively, the intercept and the linear regression coefficient (genetic tendency).
RESULTS AND DISCUSSION
Results of the comparison criteria of quality in adjustment of the models indicated that the Leg5,5 model showed the best fit by AIC criterion and by the logarithm of the likelihood function (Table 3). According to the RPCR, the Leg4,5 model provided a better fit to the data. The BIC criterion was even stricter in choosing the model due to the parameterization, thus indicating the Leg3,5 as the best model to fit genetic and permanent environmental effects. However, Leg3,5; Leg4,5; and Leg5,5 models presented the best fitting for weighted residual variance criteria, since those models had low and similar values. The complexity degree tended to increase with the number of estimated parameters.
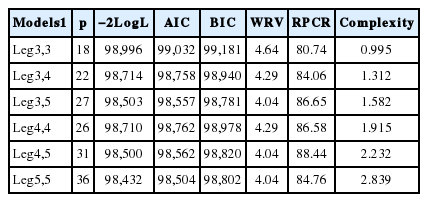
Number of estimated parameters (p), the logarithm of the likelihood function (−2logL), Akaike’s information criterion (AIC), Bayesian information criterion (BIC), weighted residual variance (WRV), relative percentage of complexity reduction (RPCR) and degree of interdependence between the model parameters (complexity) for the models using different orders of orthogonal Legendre’s polynomials
The disagreement between the fit quality criteria when choosing the best model, observed in this study, has also been reported by other authors (Lopez-Romero and Carabaño, 2003; Pelicioni et al., 2009). In general, the comparison criteria used in this study indicated that Leg3,5 and Leg5,5 models showed the best fit to the data. On analysis, it was observed that the estimates of the residual variance and genetic variance of both models were similar (Figure 3a and 3b), indicating that increasing the order of the Legendre’s polynomial for modeling additive genetic effect causes little distinction in heritability estimates between the models (Figure 3c). There was also a greater variation in these estimates between the DIM throughout the lactation period when used, in the Leg5,5 model, the Legendre’s polynomial of order 5 to modeling this additive genetic effect, suggesting that it is a less robust model. Moreover, the complexity of the Leg5,5 model was higher than that of Leg3,5 model (Table 3). Therefore, it is recommended the Leg3,5 model to describe the changes in the (co)variance components in milk yield during lactation of Girolando cows.
Estimates of the residual variance (a), genetic variance (b) and heritability (c) for milk yield on days in milk, obtained from theDay in milk six models used.
Results from this study are similar to those reported by Lopez-Romero and Carabaño (2003), who compared RRM in dairy Holstein cattle in three regions of Spain and observed differences between BIC, AIC, and −2logL, where the Leg3,5 model was elected by the BIC criterion as the best one, since it is the most plausible in specifying additive genetic effects and permanent environmental effects. Pool et al. (2000) and Bignardi et al. (2009) also reported that the additive genetic effect modeling with lower order Legendre’s polynomials for the permanent environmental effect are sufficient to capture most of the genetic and permanent environmental variability observed in the shape of lactation curve. However, other authors have reported better fits with Legendre’s polynomials of the same order for both random effects (Cobuci et al., 2006).
When assessing the estimates of (co)variance additive genetic and permanent environmental components between the random regression coefficients it revealed that the variances of the first two coefficients of additive genetic effects were greater than the third one (Table 4), indicating that they have contributed significantly in the variation description of the TDMY records. Indeed, the eigenvalues of these two factors explained more than 98% of the total variability of these records. This value is similar to the one reported by Pool et al. (2000) for Holstein in Denmark, where the first two eigenvalues explained 97.2% of the total genetic variation by the Leg3,5 model. For the permanent environmental effect, four coefficients were necessary to explain this percentage of variation.

Estimates of variances (diagonal) and (co)variances (below diagonal) between the random regression coefficients1 with standard deviations in parentheses and eigenvalues (λ) of (co)variances matrix of the additive genetic effects and permanent environmental effects with percentage of variance explained in brackets in Leg3,5 model2
Heritability estimates, additive genetic, permanent environmental, residual and phenotypic variances along the lactation curve showed well-defined trends (Figure 4). It can be seen that the additive variance was slightly higher in early lactation and thereafter, became stable until the end of lactation. The permanent environmental and phenotypic variances presented similar trends, however greater than additive genetic variance, with higher values in early lactation, remaining stable in the middle and increasing at the end of lactation. Similar trends have been reported in studies with Holstein in Brazil (Bignardi et al., 2009; Dorneles et al., 2009; Biassus et al., 2011). The highest values observed at the extremes of the curve can be attributed to variations in the number of TDMY records, yield level, non-genetic factors that were not considered in the model and pregnancy effects (Bohmanova et al., 2008).

Heritability estimates (*), additive genetic (▲), permanent environmental (■), residual (+) and phenotypic (●) variances for milk yield on days in milk, obtained from the Leg3,5 model.
Heritability estimates were low in early lactation, with values close to 0.18 in the first 30 days, gradually increasing as lactation advances until reaching the maximum value on day 205 (h2 = 0.23). From then, gradually decreased until the end of lactation with values of 0.18 on day 305 (Figure 4). Lower values observed in early lactation can be attributed to the higher permanent environmental variance and to the lower additive genetic variance in this period. Similar trend was observed by Dorneles et al. (2009a) for Holsteins in Brazil, with heritability estimates ranging from 0.14 to 0.20. In general, genetic correlations were higher between adjacent DIM and lower among the more distant ones (Table 5). DIM in mid lactation were highly correlated, with correlations greater or equal to 0.90 between DIM on day 155 with DIM from day 105 to 255 (Table 5 and Figure 5a). The permanent environmental correlations were also high between adjacent DIM, decreasing between the farthest ones (Figure 5b). It can also be observe low and negative genetic correlation between the extreme controls (5 and 305). Negative genetic correlations between extreme controls during lactation period have been reported in the literature (Lopez-Romero and Carabaño, 2003; Costa et al., 2005; Bignardi et al., 2009; Pereira et al., 2010).

Estimates of genetic correlations (above the diagonal) and permanent environmental correlations (below diagonal) between days in milk (DIM) selected from first lactation of Girolando cows
Estimates of genetic (A) and permanent environmental (B) correlations between test-day milk yield on different days in milk in Girolando breed.
According to Lopez-Romero and Carabaño (2003), RRM tends to overestimate genetic variances and heritability at the extremes of the lactation curve and underestimate the genetic correlations between the first and last DIM. In this study, the number of observations at the end of lactation was low, which could have contributed to the underestimation of the correlation between the extremes of the lactation curve (Figure 2). This fact was expected as it is natural that Girolando cattle exhibit short period of lactation, which is typical of Bos indicus animals.
The heritability estimates for persistency measures ranged from 0.10 to 0.33 and were higher in PS3 and PS7 measures, and lower in the PS4, PS5, PS6, and PS8 measures (Table 6), suggesting that there is an important contribution from the genetic component to this trait, which could be included among the criteria for selection in Girolando breed. Differences between heritability estimates of persistency measures may be associated to the period (phase) of lactation used in the calculation for persistency (Madsen, 1975). Cobuci et al. (2012), when working on data from Holstein using fourth-order polynomials, reported heritability estimate of 0.33 for PS3, equal to the obtained in the present study. In general, the values obtained in this study were higher than those reported by Pereira et al. (2012) for Gir, and Biassus et al. (2010) and Dorneles et al. (2009b) for the Holstein breed in Brazil, which ranged from 0.04 to 0.32 and were obtained with RRM in third and fourth-order Legendre’s polynomials.
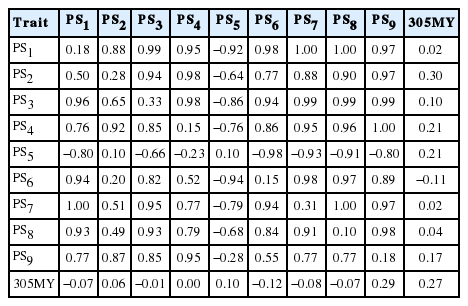
Heritability estimates (diagonal), genetic correlations (above diagonal) and permanent environmental correlations (below and milk yield up to 305 days (305MY) diagonal) between measures of persistency (PS1 to PS9)
The heritability estimate for milk yield up to 305 days (0.27) lies within the range reported in studies with RRM using different polynomial functions (Dorneles et al., 2009b; Biassus et al., 2010; Pereira et al., 2012). The heritability estimate for milk yield up to 305 days obtained in this study is higher than the 0.21 and 0.25 obtained by Pereira et al. (2012) for Gir breed and by Dorneles et al. (2009b) for Holsteins, respectively. However, it is lower than the values obtained by Jakobsen et al. (2002), Cobuci et al. (2006) and Biassus et al. (2010), which ranged from 0.31 to 0.42 for Holsteins.
Estimates of genetic correlations between different persistency measures were of high magnitude, except between PS5 with PS2 and PS4, and between PS2 and PS6 (Table 6). It can also be observed negative estimates between PS5 and the other measures, probably due to the definition of PS5, since higher values of this measure indicate greater persistency, unlike the other measures. In general, permanent environmental correlations between these measures were also high, except the correlations among PS2 and PS1, PS6, PS7 or PS8; PS6 and PS4 or PS9; and PS5 and PS9, which were low. In general, values from −0.92 to 1.00 among persistency measurements obtained in this study were similar to those reported by Pereira et al. (2012) for Gir (0.86 to 0.99), by Dorneles et al. (2009b) for Holstein (−0.87 to 0.94) and by Freitas et al. (2010) for Guzerat cattle (−0.99 to 0.97) in Brazil.
Genetic correlations among PS1, PS7, or PS8 and 305MY were close to zero, and close to those reported by Kistemaker (2003), who estimated genetic correlation of 0.06 between PS7 and 305MY. However, Dorneles et al. (2009b), Cobuci et al. (2012) and Khorshidie et al. (2012) studying the Holstein breed, and Jakobsen et al. (2002), studying the Danish breed, obtained values close to zero between PS5 and 305MY. These values confirm that there is a little genetic association between milk yield and persistency, indicating that animals having the same level of milk yield may present different levels of lactation persistency. Therefore, animals with greater EBV for persistency are not exactly those with greater EBV for 305MY (Cobuci et al., 2007). This fact can be confirmed when comparing the EBV for measures of persistency and 305MY from the top five sires with more than 25 daughters (Table 7), in which the fourth best sire (S4) classified according to its EBV to 305MY is the first one to all measures of persistency.
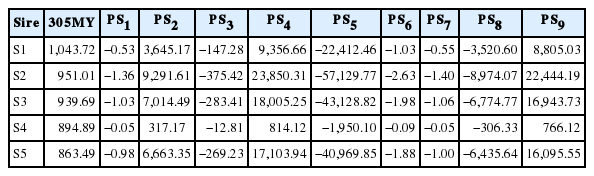
Estimated breeding values (EBV) for measures of persistency (PS1 to PS9) and milk yield up to 305 days (305MY) from the top five sires with more than 25 daughters ranked according to their EBV for milk yield
According to Jakobsen et al. (2002), the ideal measure for lactation persistency is the one which has expressive economic value, greater genetic variation, high heritability and low correlation with milk yield up to 305 days. In this study, the measure PS7 presented such characteristics therefore can be recommended for evaluation of lactation persistency in Girolando cattle.
The percentage of animals in common with more than 25 daughters selected for PS7 and 305MY is much lower at high intensities (<10%), however, as expected, this percentage increased as the proportion of selected animals was higher (Figure 6). It was also noted that this value is higher in cows than in sires, but when the sire selection is restricted by the number of daughters, this percentage becomes much higher. Similar trends were observed by Cobuci et al. (2007) for Holsteins and by Pereira et al. (2012) for Gir.
Percentage of all sires (□), all cows (◇) and sires with more than 25 daughters (×) in common when different proportions of animals were selected based on their predicted breeding value for persistency (PS7) and milk yield up to 305 days (305MY).
Estimated breeding values for milk yield during lactation of the top five sires for 305MY with more than 25 daughters showed similar patterns, however with marked differences as well (Figure 7). There were clear differences in predicted breeding values of sires throughout lactation. S1 and S4 sires showed the highest EBV at the lactation peak, however, in the end of period, the sires S2, S3, and S5 showed higher genetic merit for persistency. Likewise, Figure 8 presents the EBV from the top five sires ranked by lactation persistency (PS7). The EBV from sires S1 to S4 were higher than those from S5 and showed an increasing trend throughout lactation. Nevertheless, it is important to note that these five sires had different ratings for both traits (305MY and PS7).
Predicted breeding values throughout the lactation from the top five sires (S1 to S5) with more than 25 daughters ranked for milk yield up to 305 days.
Predicted breeding values throughout the lactation from the top five sires (S1 to S5) with more than 25 daughters ranked for lactation persistency (PS7).
Trends showed in Figures 7 and 8 indicate that the lactation persistency does not depend on the production level of animals, thus confirming the weak association between both traits (Cobuci et al., 2007; Pereira et al., 2012).
Estimates of annual genetic trend for 305MY for sires and cows were positive and of moderate magnitude, however negative for PS7 (Table 8). In general, the results revealed a significant genetic progress for 305MY in the Girolando population during the study period, a trend which was more pronounced in sires than in cows, with 31.73% increase over the study period. These results indicate efficiency of the breeding program for Girolando cattle.
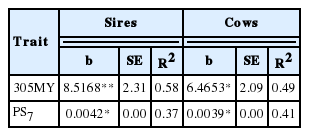
Estimates of annual genetic trend (b), standard errors (SE) and coefficient of determination (R2) for milk yield up to 305 (305MY) and lactation persistency (PS7) of sires and cows
The values of genetic trend obtained in this study are close to 6.71 and 7.53 kg of milk per year reported by Ferreira et al. (2006), however lower than 9.51 kg of milk per year obtained by Boligon et al. (2005) for Holsteins. Nevertheless, the annual genetic trends for lactation persistency for sires and cows were negative and of low magnitude (Table 8), indicating no genetic progress for this trait in the period 1997 through 2008. These results were expected, since the genetic correlation between 305MY and PS7 was close to zero (0.02, Table 6), confirming that the selection for 305MY does not lead to improvement in lactation persistency. Similar trends were observed by Cobuci et al. (2007) for Holsteins and by Pereira et al. (2012) for Gir. Based on these results, an alternative for the improvement of both traits implies in using selection indexes that combine lactation persistency and 305MY and enabling the simultaneous selection of the most productive and persistent animals for milk yield (Chaves, 2009). The study revealed that selection for increased to milk yield up to 305 days did not cause genetic progress for lactation persistency of the animals belonging to the Genetic Improvement Program for Girolando cattle. The use of the measure persistency PS7 proposed by Kistemaker (2003), under the RRM using 3 and 5-order Legendre’s polynomials for additive genetic effects and permanent environmental effects, respectively, would be the most suitable option for use in genetic evaluation for milk yield and lactation persistency of the breed. The use of selection indexes for simultaneous evaluation of both genetic traits can be a viable alternative. However these are not the only trait to be considered in genetic evaluation, mainly in production systems of tropical regions.
ACKNOWLEDGMENTS
The authors thank the Associação Brasileira dos Criadores de Girolando for supplying the data.