Effect of Packaging Method and Storage Time on Physicochemical Characteristics of Dry-Cured Pork Neck Products at 10°C
Article information
Abstract
Dry-cured pork neck samples were stored at 10°C for 90 days under vacuum packaging (VP) or modified atmosphere packaging (MAP; 25% CO2+75% N2) conditions. The pH, moisture, water activity, total aerobic bacteria, and Enterobacteriaceae counts of dry-cured pork neck products with MAP were significantly lower than those with VP (p<0.05) after 90 days of storage. However, CIE b* and 2-thiobarbituric acid reacted substance (TBARS) values of the pork product with MAP were significantly higher (p<0.05) than those with VP. Total aerobic bacterial counts and Enterobacteriaceae counts of samples with MAP were lower than those with VP after 30 days of storage. Sensory results indicated that aroma, flavor and tenderness scores of the samples with both VP and MAP decreased during storage and the scores after >60 days of storage were lower than those at Day 1. In conclusion, despite presenting higher lipid oxidation, the samples stored in packages containing 25% CO2 for 90 days at 10°C have lower bacterial counts than vacuum-packed samples. Therefore, further studies should be performed on the packaging of dry-cured meat at adjusted concentrations of CO2.
INTRODUCTION
Modern food-packaging offers benefits beyond conventional protection properties (Han, 2005). Preservation technologies such as refrigeration, vacuum packaging (VP), and modified atmosphere packaging (MAP) are being increasingly used to extend the shelf-life of meat products for distribution and retail sale (Stiles, 1991). Use of MAP for processed meat has grown greatly in recent years, but optimization of the gas composition is crucial to ensure both product quality and safety (MØller et al., 2000). Carbon dioxide (CO2), because of its antimicrobial activity, is the most important component of the gas mixtures in MAP (Farber, 1991), and N2 is used as a filler (Sørheim et al., 1999). Several studies had been conducted to determine the effect of vacuum, different gas compositions and packaging materials on the preservation of dry-fermented meat products (García-Esteban et al., 2004; Cilla et al., 2006; Gök et al., 2008). The characteristics of color, lipid oxidation, pH, microbial counts and texture profiles of dry-cured meat were affected differently by aerobic, vacuum and modified atmosphere packaging methods (Aksu et al., 2005; Cilla et al., 2006). The objective of this study was to compare the effects of vacuum-packaging and MAP conditions (75% N2+25% CO2) on pH, shear force, color, thiobarbituric acid reacted substance (TBARS), volatile basic nitrogen (VBN), microbiological quality and sensory characteristics of dry-cured pork neck during storage at 10°C.
MATERIALS AND METHODS
Preparation of dry-cured pork neck samples
Ten carcasses from barrow pigs (LY×D) were used to prepare dry-cured pork neck products. Twenty neck muscles were removed from both sides of the carcasses at 12 h postmortem. Subcutaneous fat and intramuscular connective tissues were removed from the neck muscles and the muscles were placed on shelves in a cold room for 1 month at −25°C. The frozen samples were thawed for 2 days at 4±1°C and then each kg of meat were rubbed with a curing mixture composed of 50 g NaCl, 0.10 g NaNO3, 0.05 g NaNO2, 0.5 g ascorbic acid, 0.5 g sodium erythorbate, 5 g commercial seasoning, and 1 g commercially optimized mixed starter culture. The starter culture contained 4.0×10⁹ cfu/g of lactic acid bacteria (Lactobacillus pentosus), and 6.0×10⁹ cfu/g of Gram-positive catalase-positive Staphylococcus (S. carnosus). The meat was incubated at 4°C for 2 weeks and the relative humidity between 70% to 80%. At the end of incubation, the meat was brushed and washed with cold water, dried at 30°C for 2 h, smoked for 30 min at 30°C, and then ripened for 3 months at 10°C and 70% relative humidity. The manufacturing process was replicated three times.
Packaging of dry-cured samples and storage conditions
On the experiment day, the dry-cured pork necks were divided into randomly assigned two groups. Approximately 150 g of dry-cured pork neck slices were vacuum-packaged or packaged in modified gas conditions. The modified gas mixture was composed of 25% CO2+75% nitrogen mixture and was produced using a gas mixer (Witt-Gasetechnik GmbH and Co., Witton, Germany). An electronic vacuum packer (PBI-Dansensor model mix 9000, Ringsted, Denmark) was used to flush the gas mixtures and seal the pouches. The packaging pouch was obtained from Danisco Flexible (Lyngby, Denmark) and was made of polyethylene with an oxygen transmission rate (OTR) of 0.5 cm3/m2/atm/24 h at 90% relative humidity. All samples were stored at 10°C for 90 days in the dark. The samples were opened for subsequent analysis after 1, 30, 60, and 90 days of storage.
Determination of moisture content, pH and water activity (aw)
Moisture content was determined using the standard analytical method (AOAC, 1995). The pH of samples was measured using a pH meter (8603, Metrohm, Herisau, Swiss) after homogenizing (polytron, T25basic, IKA, Selangor, Malaysia) approximately 3 g of dry-cured ham sample with 27 mL of distilled water. Three pieces of the dry-cured ham samples from each treatment were selected, cut into small pieces using sharp scissors and homogenized prior to measurement of water activity. Those pieces were put into water activity cups, and their water activities were determined with a hygroskop (BT-RS1, Rotronic Ag., Bassersdorf, Swiss), which was calibrated at ambient temperature (20°C) with distilled water (aw = 0.999) and saturated solutions of NaCl (aw = 0.756) and KCl (aw = 0.853). The moisture content, pH and aw determination was performed in triplicate and the experiment was replicated three times.
Warner-Bratzler shear force
The Warner-Bratzler shear force (WBSF) of samples was determined using an Instron 3343 (US/MX50, A&D Co., Norwood, MA, USA) fitted with a Warner-Bratzler shear attachment (10 kg load cell). Samples were cut parallel to the fiber direction from the core of each cooked samples (Ø16.50×2.00 cm) before measurement. The crosshead speed of the Warner-Bratzler shear force unit was set at 60 mm/min was used and the maximum peak forces recorded during the test were reported. The WBSF determination was performed in triplicate and the experiment was replicated three times.
Instrumental color measurement
Color was measured using a spectrocolorimeter (CR 400, Minolta Co., Osaka, Japan) (λ: 400 to 700 nm, Δλ: 10 nm, D65, 10°) standardized with a white plate (Y = 93.5; × = 0.3132; y = 0.3198). Commission Internationale de l’Eclairage (CIE), L* (lightness), a* (redness), and b* (yellowness) values were measured on the surface of samples. The each color parameter determination was performed in triplicate and the experiment was replicated three times.
Lipid oxidation determination
Thiobarbituric acid reacted substance values were measured using the method of Witte et al. (1970) with modifications. Briefly, 3 g of minced meat were homogenized with 30 mL distilled water for 30 s at 12,000 rpm. Then, 2 mL of the homogenate were placed in a test tube and 2 mL of 20% (w/v) trichloroacetic acid, 2 mL of 0.8% (w/v) thiobarbituric acid (TBA) solution and 50 μL of saturated butylated hydroxyanisole in 70% ethanol were added. The mixtures were vortex mixed (MX-F, SCILOGEX, San Diego, CA, USA) for 30 s and incubated at 90°C in a water bath (DS-10B, Dongseo Sci., Anyang, Korea) for 15 min to develop a pink absorbance. After cooling in ice for 10 min, the tubes were centrifuged at 3,000 rpm (UNION 5kr, Hanil, Ansan, Korea) for 15 min. The color to absorbance of the supernatant was read at 531 nm using a spectrophotometer (Ultrospec 2100 pro; Amersham Pharmacia Biotech Co., Piscataway, Middlexex country, NJ, USA). A standard curve was prepared using 1,1,3,3-tetramethoxypropane at the concentrations ranging from 0 to 10 ppm and TBARS were expressed as mg malondialdehyde (MDA) equivalents/kg sample. The TBARS value was performed in triplicate and the experiment was replicated three times.
Volatile basic nitrogen analysis
The VBN was determined using the Conway micropipette diffusion method (Pearson, 1968) and was expressed as mg VBN 100 g−1 of the sample. The VBN value was performed in triplicate and the experiment was replicated three times.
Microbiological analyses
For microbiological analysis, a 25-g sample was aseptically transferred to a 500-mL sterile bag, added with 255 mL of sterile 0.1% (w/v) bacteriological peptone (LAB M, Bury, Lancashire, UK) water, and homogenized in a stomacher (Lab-Blender 78860, ST-Nom Interscience, Saint Nom, France) for 3 min at a low speed at room temperature. Serial decimal dilutions using 0.1% peptone water were prepared, and duplicated 1-mL samples at appropriate dilution ratio were poured on all-purpose and selective agar plates. Total aerobic bacteria (TAB) were determined on plate count agar (PCA; Difco Laboratory, Detroit, MI, USA), which was incubated at 32°C for 48 h under aerobic conditions, and lactic acid bacteria (LAB) on Lactobacilli MRS Agar (Difco, USA) at 32°C for 48 h under anaerobic conditions (GasPack System, BBL, Becton Dickinson, Sparks, MD, USA). Enterobacteriaceae were determined on E. coli/Coliform count plate petrifilm (3M Health care, St. Paul, MN, USA) at 30°C for 2 days under aerobic conditions. The each microbial count determination was performed in triplicate and the experiment was replicated three times.
Sensory analyses
Sensory evaluation was carried out on samples at each storage time by trained 12-member sensory panel. Twelve training sessions were held to familiarize the panelists with the attributes to be evaluated and the assessment scale. Each sample (5 cm×3cm×2.0 cm-thick) was coded with a randomly selected 3-digit numbers. The panel sessions were held at mid-morning in a sensory panel room at 22°C. Color, flavor, aroma, tenderness and juiciness were scored on a 9-point hedonic scale as follow: 9 = excellent, 7 = good, 5 = acceptable, 3 = fair and 1 = unacceptable. Three samples, one from each packaging system, were served on plates to panelist and successively evaluated in each session different. Panelists were instructed to cleanse their palates between samples using water and unsalted bread. For each parameter, at each time and packaging method, the value was calculated as the average value of five determinations per replication.
Statistical analysis
Data were analyzed using the general linear model (GLM) of Statistical Analysis System’s Procedures (SAS Institute Inc., 1999). Duncan’s multiple range tests were used to determine differences between means. Significance level was set at 5%.
RESULTS AND DISCUSSION
pH and Warner-Bratzler shear force values
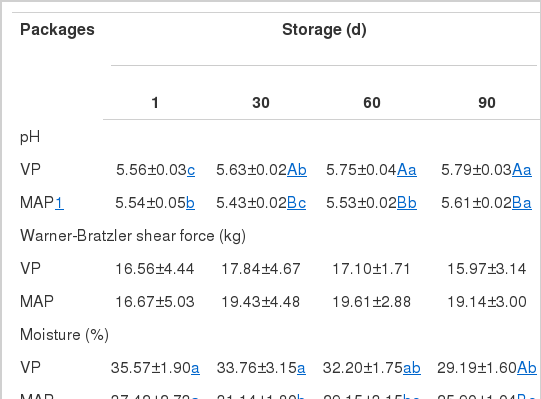
There was no significant difference in the pH values of meats between the two packaging systems at the start of storage; however, significant differences in pH were found after 30, 60, and 90 days of storage. The pH of vacuum-packaged samples increased from 5.56 to 5.79 and that of the MAP samples from 5.54 to 5.61 during the storage at 10°C (Table 1). Other researchers also observed pH increase in dry-cured beef products during storage. The type of packaging also affected the pH values of dry-cured products (Ruiz et al., 1998; Rubio et al., 2006; Gök et al., 2008). In this study, the pH value was significantly lower (p<0.05) in the MAP samples than that in the VP samples at the given storage time. Cilla et al. (2006) and Martínez et al. (2005) reported that increasing concentrations of CO2 gave rise to a lowering of pH; this effect has been related to the absorption of CO2 by meat, which results in the production of carbonic acid (Dixon and Kell, 1989). The decrease of pH values in MAP products with increased storage time is in agreement with that reported by Houben and Van-Dijk (2001) for sliced hams and by Pexara et al. (2002) for cured turkey fillets. There was no significant difference in WBSF between two samples during storage (Table 1).
Moisture content and water activity (aw)
Table 1 shows the effect of packing method on moisture content and water activity (aw) of dry-cured pork neck during storage at 10°C. Moisture and aw values decreased significantly (p<0.05) throughout storage in both packaging systems. There was no significant difference in moisture content in any packaging system until 60 days of storage; however, the moisture content of the MAP samples was significantly lower (p<0.05) than that of the VP samples after 90 days of storage. The values of aw in the MAP samples decreased significantly (p<0.05) during the storage period but that of the VP samples did not. In addition, except on day 1 of storage, the aw values of the MAP samples were significantly lower than those of the VP samples after 30, 60, and 90 days of storage (p<0.05). Rubio et al. (2006), however, observed decrease of aw values in sliced dry-cured meat under both VP and MAP conditions when the storage time was extended.
Color changes
Table 2 shows the results of color measurement, which includes the three primary color co-ordinates (L*, a*, b*) used in the CIE system. The L*-value of samples with both VP and MAP tended to increase with storage time, probably due to a whitish surface (an anomaly typified by the formation of a cloak of whitish substance, normally called white film) observed in portions of dry-cured ham (Rubio et al., 2007). Arnau and Casademont (1987) found that the main component of the white film was tyrosine. The highest L*-values were observed after 60 days of storage. The VP samples had significantly higher L*-values than the MAP samples at all storage time except at Day 60. However, Rubio et al. (2007) and García-Esteban et al. (2004) reported that the type of packaging system had little influence on L*-values and no significant difference was found between vacuum-packaged and MAP (20 CO2+80% N2) samples. Redness (a*), which is used as an indicator of color stability in meat and meat products, showed pronounced fading after 60 days in all packaging systems. Significantly lower a*-values were found in both VP and MAP samples after 60 days of storage (p<0.05). However, there was no significant difference in a*-values between the packaging methods. The b*-values of all samples increased significantly with storage time, but the MAP samples had significantly higher b*-values than the VP samples at day 30, 60, and 90 of storage (p<0.05). These differences in b*-value during storage could be related to the intensity of oxidation process during storage. Cilla et al. (2006) reported the increase in yellowness color in MAP (20% CO2 +80% N2) samples is related to the increased pigment oxidation during storage. It has been demonstrated that myoglobin oxidation is favored as the concentrations of CO2 increased (Martínez et al., 2005). However, García-Esteban et al. (2004) found increased b*-values in VP ham slices, but did not find any increase of b*-values in MAP samples.
Lipid oxidation
The TBARS values of meat with both packing systems significantly increased (p<0.05) during the storage period (Table 3). Both VP and MAP packaging systems were not sufficient to avoid oxidative changes in the meats during storage time. The TBARS values of the meats from both packaging systems were <7.08 mg MDA kg−1, which was lower than that of the reported in dry-fermented salchichon under the same storage conditions (Rubio et al., 2008). However, the TBARS value of dry-cured pork neck was higher than that of the dry-cured Iberian ham stored for 220 days reported (Vestergaard and Parolari, 1999; Andres et al., 2004), and the pastirmas (cured beef) (Aksu et al., 1993; Yagli and Ertas, 1998). This difference was probably due to the variability among the different meat types. Lipid oxidation is closely related to the discoloration process of meat because oxidation of muscle pigments catalyzes the oxidation of lipids (Akamittach et al., 1990). The TBARS values of the MAP samples were significantly higher (p< 0.05) than those of the VP samples. Juncher et al. (2001) reported that increased CO2 in the MAP lowered the pH of meat, suggesting that the absorption of CO2 by dry-cured ham resulted in the production of carbonic acid (Dixon and Kell, 1989). Low pH has been reported to increase lipid oxidation in a variety of meat products (Juncher et al., 2001; Martínez et al., 2005).
Changes of volatile basic nitrogen value
Table 3 shows the effect of packaging methods on VBN (mg 100 g−1) values of dry-cured pork neck during storage at 10°C. A significant (p<0.05) increase of VBN values was found in the meats with both packaging systems after 60 days of storage. Generally, VBN is used as an indicator of the freshness of meat-based foods, and high protein foods with high contamination by microorganisms have high VBN values (Davies and Board, 1998). Therefore, the increase of VBN content in meat can be caused by either bacterial or enzymatic degradation of proteins (Egan et al., 1981). In this study, higher VBN values were associated with the increase in bacterial counts during storage (Table 4). At 60 and 90 days of storage, the VBN values of the VP samples were significantly higher (p<0.05) than those of the MAP samples. The lower VBN values of MAP than VP samples may be due to the antimicrobial effects of CO2 added in the MAP system (Table 4).
Microbial changes
There was no significant difference in the TAB, LAB, and Enterobacteriaceae counts of the meats between the two packaging methods at the start of the storage period. After 30 days of storage, however, TAB and LAB counts in MAP samples were significantly lower than those of the VP samples (p<0.05) (Table 4). Our results are in agreement with those of Blickstad and Molin (1984), Ogihara et al. (1993), and Aksu et al. (2005) who reported that MAP with CO2 and N2 significantly prevented the growth of LAB and Enterobacteriaceae. In their studies, the pastirmas with MAP had the lowest Enterobacteriaceae counts followed by that with VP. Gram-negative bacteria are generally more sensitive to CO2 than Gram-positive bacteria (Church, 1994) because most Gram-positive bacteria are facultative or strict anaerobes (Gill and Tan, 1980). However, individual bacterial species vary in their sensitivities to CO2 (Farber, 1991). Enterobacteriaceae were not detected until 30 days of storage in any packaging system, but <1 log cfu g−1 were detected after 60 and 90 days of storage. There was no significant difference in microbiological quality between the two packing systems.
Sensory evaluation
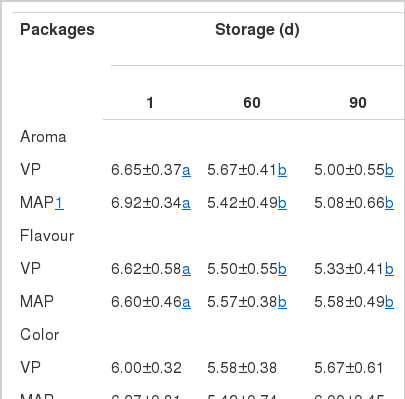
As storage time increased, aroma, flavor and juiciness scores of meat decreased significantly (p<0.05) regardless of packaging methods; however, no significant difference in aroma, flavor, color and juiciness scores between the two packaging systems was observed (Table 5). These results are in agreement with those of Fernández-Fernández et al. (2002) who reported that packing methods did not affect any sensory property of dry sausages subjected to VP and MAP. The juiciness scores of the meats with the MAP decreased after 60 days of storage, but those with the VP samples did not changed significantly. The tenderness scores of VP sample were higher than those of MAP samples at day 60 of storage. The higher tenderness scores in VP sample may be due to higher moisture content and higher aw value in meat with VP than MAP after storage (Table 1)
CONCLUSION
Color b*-value, TBARS and pH supported the view that MAP of dry-cured pork neck allowed lipid and pigment oxidation, and severe discoloration. The results strongly suggested that VP preserved the quality of dry-cured pork neck products better than the MAP, especially with regard to discoloration, lipid oxidation, pH and tenderness. Some of the quality changes were related to oxidation of heme pigments and lipids under low pH conditions generated by the high CO2 pressure with the MAP. However, MAP had a beneficial effect in reducing the total aerobic bacterial counts in the meats. After all, it can be concluded that VP was better than MAP in maintaining the quality of dry-cured pork neck products during the extended storage time.
ACKNOWLEDGMENTS
This work was supported by Export Promotion Technology Development Program, Ministry for Food, Agriculture, Forestry and Fisheries, Republic of Korea and Priority Research Centers Program through the National Research Foundation of Korea (NRF) funded by the Ministry of Education, Science and Technology (2009-0093813).


