Genomic Heritability of Bovine Growth Using a Mixed Model
Article information
Abstract
This study investigated heritability for bovine growth estimated with genomewide single nucleotide polymorphism (SNP) information obtained from a DNA microarray chip. Three hundred sixty seven Korean cattle were genotyped with the Illumina BovineSNP50 BeadChip, and 39,112 SNPs of 364 animals filtered by quality assurance were analyzed to estimate heritability of body weights at 6, 9, 12, 15, 18, 21, and 24 months of age. Restricted maximum likelihood estimate of heritability was obtained using covariance structure of genomic relationships among animals in a mixed model framework. Heritability estimates ranged from 0.58 to 0.76 for body weights at different ages. The heritability estimates using genomic information in this study were larger than those which had been estimated previously using pedigree information. The results revealed a trend that the heritability for body weight increased at a younger age (6 months). This suggests an early genetic evaluation for bovine growth using genomic information to increase genetic merits of animals.
INTRODUCTION
Genetic improvement of bovine growth is one of the most important tasks for a higher productivity in the beef cattle industry, and thus its heritability as the portion of genetic variability to phenotypic variability has been a great concern to cattle geneticists. Heritability for growth traits of beef cattle has been estimated in a variety of breeds and populations. Traditionally, they were estimated based on pedigree information. This heritability estimated by the traditional method is hereafter called “classical heritability”.
Nowadays high throughput genotyping has been available. The use of commercial DNA microarray chip is currently a routine in identifying genomewide association signals for bovine complex phenotypes (Van Tassell et al., 2008; Snelling et al., 2010; Kim et al., 2011; Lu et al., 2013). Abundant information on tens of thousands of markers from the chip experiment actually enables us not only to test their genetic associations with phenotypes but also to assess genetic variability among individuals. Incorporating the genetic variability into the genetic association analysis in a mixed model would control population stratification and result in heritability estimate explained by polygenic effects (Yang et al., 2011). The objective of this study was to examine heritability estimates for growth traits of Korean cattle using genomic information of single nucleotide polymorphism (SNP) genotypes obtained with a DNA microarray chip.
MATERIALS AND METHODS
Animals and phenotypes
An indigenous beef cattle breed called Korean cattle (also named Hanwoo or Bos taurus coreanae) was used to estimate heritability of body weight. For characteristics and historical details of the breed, see Kim and Lee (2000) and Lee and Pollak (2002). Body weights of 367 steers under a controlled feeding program were collected from Korean Cattle Improvement Center, National Agricultural Cooperative Federation in Korea. The feeding program was described in Kim et al. (2011). Body weights were available at 6, 9, 12, 15, 18, 21, and 24 months. The descriptive statistics for body weights are summarized in Table 1. Their meat samples were obtained at slaughter in spring and fall of 2007 through 2009.
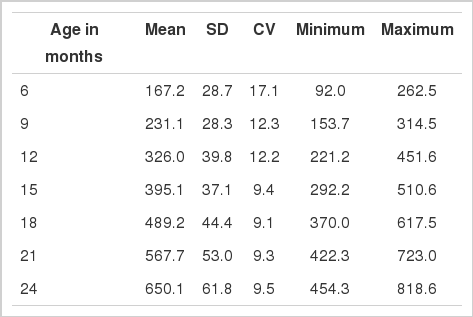
Basic statistics for body weights (kg) of Korean cattle analyzed in this study
Genotyping
Genomic DNA was extracted from the tissue samples of animals using a commercial kit from Qiagen (QIAGEN Inc., Valencia, CA, USA). The bovine Illumina Infinium assay (BovineSNP50, Illumina, San Diego, CA, USA) with 54,001 SNPs across the whole bovine genome was used for genotyping. Genotypes were determined based on custom clusters developed with more than 7,000 samples using Beadstudio software provided by Illumina. Every signal cluster was manually reviewed and appropriately fitted.
We excluded the samples with call rate <98% from the analysis of estimating heritability. Exclusion criteria for SNPs were call rate <98%, minor allele frequency <0.05, and deviation from Hardy-Weinberg equilibrium. The Hardy-Weinberg disequilibrium was tested using the chi-square statistic with 2 degrees of freedom (p<0.001).
Statistical analysis
A mixed model was employed to estimate genetic and environmental variance components as following:
where y is a vector of body weights, β is a vector of fixed effects for contemporary group (year and season, 6 levels) effects, X is the corresponding incidence matrix, g is a vector of random polygenic effects under the assumption of
where ψ is the number of SNPs, nij(nik) is the number (0, 1, or 2) of the reference allele for the ith SNP of the jth (kth) individuals, and pi is the frequency of the reference allele of the ith SNP. The
The genetic and environmental variance components were estimated using restricted maximum likelihood (REML). Genome-wide Complex Trait Analysis (GCTA, version 2.0) which is a freely available program at http://www.complextraitgenomics.com/software/gcta was used to estimate the variance components (Yang et al., 2011). Heritability was calculated using the REML estimates as
Further analysis was conducted to examine chromosomal contribution to heritability of body weight. We first calculated genetic relationship coefficients using genomic information by chromosomes and then to estimate heritability with the genetic relationship matrix for each chromosome.
We also conducted a genetic association analysis to estimate regression coefficients in testing associations of SNPs with body weights. Correlation of the regression coefficients between body weights at different age was estimated.
RESULTS
Heritability was estimated using 364 samples and 39,112 SNPs remained after the quality assurance filtering. The number of SNPs used in the analysis indicated that reasonably informative SNPs were included in the BovineSNP50 BeadChip for Korean cattle as reported before (Kim et al., 2011). Genetic association of body weight with any individual SNP was not identified by the Bonferroni multiple test (p>1.83×10⁻⁷).
Heritability estimates for body weights of Korean cattle ranged from 0.58 to 0.76 (Figure 1). They showed a trend that the heritability was larger at a smaller age. For example, the heritability estimate was largest for body weight at age of 6 months and smallest for body weight at age of 2 years.
Genomic heritability for body weight of Korean cattle by age. The genomic heritability was estimated using bovine genomic information of 39,112 single nucleotide polymorphisms.
The chromosomal contribution to heritability of body weight was heterogeneous by age in months (Figure 2). The contribution of chromosome 24 to heritability decreased with a larger age whereas the contribution of chromosome 13 increased with a larger age.
Heritability for body weight of Korean cattle using data partitioned by chromosome.
Regression coefficients were obtained from testing genetic associations of SNPs with body weights. Their correlation estimates between body weights at different age ranged from 0.66 to 0.98 (Figure 3). They decreased with a large difference in age.
Correlation of test statistics (regression coefficients) between body weights at different age. Ages in months for body weight are presented on the diagonal. Scatter plots for the regression coefficients are upper-diagonal. Correlation estimates of the regression coefficients between body weights at different age are lower-diagonal. All the correlation estimates were significant (p<0.001).
DISCUSSION
The current study showed heritability estimates of 0.58 to 0.76 for body weights of beef cattle using genomic information of SNP genotypes obtained with the BovineSNP50 BeadChip. They were larger than classical heritability estimated using pedigree information in previous studies. For example, the classical heritability estimates for body weights of beef cattle ranged from 0.32 to 0.52 for Angus cattle (Davis and Simmen, 2006), from 0.18 to 0.49 for Korean cattle (Kim et al., 2000), from 0.19 to 0.25 for Simmental cattle (Lee et al., 1997), and from 0.26 to 0.35 for the US Meat Animal Research Center III composite breed (Rolfe et al., 2011). We suspect that the larger heritability might be produced at least partially by the use of genomic relationships although it might be influenced by the heterogeneous breeds, selection programs, and environments.
Since the SNP markers of the DNA chip used in this study were sparsely located in the bovine genome, heritability estimated with an increasing number of SNP markers would have been probably even larger than those estimated in the current study as suggested by simulation studies (Zhang et al., 2011; Ryoo and Lee, 2014). Most markers significantly associated with body weights were expected to link to functional genetic variants, and moreover both functional variant itself and variants in strong linkage with it might have been excluded from the analysis.
Thus, the phenotypic variability for growth of beef cattle might be explained by genomic information better than by pedigree information. This is opposite from a general tendency for human heritability. That is, heritabilities for human complex traits have been underestimated with genomic information comparing to those with pedigree information (Manolio et al., 2009). It has been called ‘missing heritability’, and this missing heritability might be attributed to the genetic relationships diluted by noncontributing markers (Ryoo and Lee, 2014) and to the inflated heritability from shared environmental factors (Zuk et al., 2012). In practice, heritability might be underestimated by diluted genetic relationships with genomic information or with pedigree information. Furthermore, the underestimation becomes more serious with wrong information, especially with wrong pedigree or misidentification (Lee and Pollak, 1997).
The current study showed a trend that the heritability estimates for body weight decreased at older ages. This suggests a necessity of an early genetic evaluation for the growth traits of animals because their genetic merits might be more explained at an earlier age, 6 months in the current study. Additional association studies of body weight at an early age with previously identified variants for growth of Korean cattle might be useful for identifying stronger signals. The genomic sequence variants identified for association with growth or growth-related traits of Korean cattle might include intragenic SNPs of the genes encoding dishevelled segment polarity protein 1 for eye muscle area (Kim et al., 2011), mitogen-activated protein kinase kinase 6 (MAP2K6) and uncoupling protein 2 for carcass weight (Ryu et al., 2012), and phosphodiesterase 1B (PDE1B) for Longissimus dorsi muscle area (Shin et al., 2012) and intergenic SNPs of rs110228023 for eye muscle area (Kim et al., 2011) and rs29012331 for yearling weight (Kim et al., 2014). Furthermore, associations of variants identified for meat quality with an early body weight might be useful to determine whether their alleles are beneficial or conflicting to both quantity and quality of meat in breeding strategy. For example, sequence variants of human immunodeficiency virus type I enhancer binding protein 3 (Kim et al., 2011) and MAP2K6 (carcass weight) (Ryu et al., 2012) were associated with marbling score of Korean cattle, and variants of thyroid hormone responsive (La et al., 2013), peroxisome proliferator-activated receptor gamma (Oh et al., 2012b), PDE1B (Shin et al., 2012), and fatty acid synthase (Oh et al., 2012a) were associated with fatty acid composition. We suspect their heterogeneous effects on body weights by age because the correlation of regression coefficients for genetic associations decreased with a large difference in age.
This study showed a novel heritability estimate of bovine growth using genomic information, which was larger than those traditionally estimated with pedigree information. Also, the heritability estimates by age revealed a trend that the heritability increased for body weight at an earlier age. An early genetic evaluation using genomic information might be suggested to improve genetic merits for growth of Korean cattle.
ACKNOWLEDGMENTS
This study was supported by the Basic Science Research Program of the National Research Foundation of Korea (NRF) funded by the Ministry of Education, Science, and Technology (Grant No. 2012002096).