Genetic Diversity and Relationships of Korean Chicken Breeds Based on 30 Microsatellite Markers
Article information
Abstract
The effective management of endangered animal genetic resources is one of the most important concerns of modern breeding. Evaluation of genetic diversity and relationship of local breeds is an important factor towards the identification of unique and valuable genetic resources. This study aimed to analyze the genetic diversity and population structure of six Korean native chicken breeds (n = 300), which were compared with three imported breeds in Korea (n = 150). For the analysis of genetic diversity, 30 microsatellite markers from FAO/ISAG recommended diversity panel or previously reported microsatellite markers were used. The number of alleles ranged from 2 to 15 per locus, with a mean of 8.13. The average observed heterozygosity within native breeds varied between 0.46 and 0.59. The overall heterozygote deficiency (FIT) in native chicken was 0.234±0.025. Over 30.7% of FIT was contributed by within-population deficiency (FIS). Bayesian clustering analysis, using the STRUCTURE software suggested 9 clusters. This study may provide the background for future studies to identify the genetic uniqueness of the Korean native chicken breeds
INTRODUCTION
Native or local breeds are nowadays usually characterized by their geographical distribution. Evaluation of genetic diversity and relationship of local breeds is an important factor towards the identification of unique and valuable genetic resources.
The Korean native chicken breeds, owing to their bad commercial performance, were ignored during many years until recently when the demand for native chicken increased suddenly, as it suits the Korean palate and as the NIAS (National Institute of Animal Science, Korea) realized the necessity of conserving native breeds. In order to meet the commercial drawbacks of native chickens low economic efficiency, commercial breeds were developed. Along with the indigenous and commercial chicken breed, Korea also has many other breeds of chicken, which were imported in the country in the early 20th century from Europe, North America and Japan. Due to being raised by different farmers belonging to different communities and different geographical locations across Korea, the local chicken breeds have plumage and shank colors different from each other.
Korean native chicken has several plumage colors (White, Black, Yellowish-brown, Grayish-brown, Reddish-brown), but all have a single comb, and their shin has brown, dark green or black colors. Tail feathers of native chickens are relatively longer than exotic breeds. As well as, there is a unique native chicken breed called Yeonsan Ogye, which has not only plumage, comb, beak, shin, claw but also the muscle, bone and intestinal organs all in black color. In 1980 this breed was registered as a natural monument (No. 265) and maintained as one of the native chicken breeds (MAF, 2004). Six Korean native chicken breeds have been documented in the DAD-IS (Domestic Animal Diversity Information System, http://dad.fao.org/) of the FAO (Food and Agriculture Organization), and have been conserved with about 2,000 chickens being maintained for each breed as a genetic resource.
Evaluating the genetic diversity and genetic structure of these breeds is an important step towards identifying and conserving valuable genetic resources.
Genetic marker polymorphisms are a certain way of assessing the biodiversities within and among chicken breeds. Different genetic markers have been used for the evaluation of genetic variability in poultry including DNA fingerprinting (Dunnington et al., 1994), random amplified polymorphic DNA (Smith et al., 1996) and microsatellites (Crooijmans et al., 1995; Vanhala et al., 1998; Wimmers et al., 2000). Microsatellites are being used in diversity studies due to their codominant, highly polymorphic nature and availability throughout the genome and thus microsatellites are identified as reliable markers in chickens (Hillel et al., 2003; Tando et al., 2007). Clustering individuals into population groups based on their genotypic data will allow the interpreting of group relations without any prior knowledge of breeds.
The aims of this study was to characterize the genetic diversity of Korean native chicken breeds and to investigate the relationships among six native chicken breeds recorded by FAO (DAD-IS, http://dad.fao.org), based on 30 microsatellite markers.
MATERIALS AND METHODS
Sampling and DNA extraction
A total of 450 chickens belonging to 9 different breeds were sampled for this study. These nine breeds included six Korean native chicken breeds (Korean Reddish Brown, KR; Korean Yellowish Brown, KY; Korean Grayish Brown, KG; Korean Black, KB; Korean White, KW; Korean Ogye, KO) and three imported breeds (White Leghorn, WL; Rhode Island Red, RI; Cornish, CN), with 50 individuals per breed respectively. Approximately 1 mL/chicken of ulnar veinous blood was collected in anticoagulant coated tubes and stored at −20°C. Genomic DNA was extracted from the whole blood using the MagExtractor (TOYOBO, Osaka, Japan) commercial DNA extraction kit. The DNA concentrations were quantified by NanoDrop 1000 Spectrophotometer (NanoDrop Technologies Inc, Wilmington, DE, USA) and samples were diluted to a final concentration of 10 ng/μL in Tris-EDTA buffer (pH 8.0).
Polymerase chain reaction and microsatellite genotyping
Thirteen microsatellite (MS) markers (ADL0278, LEI0094, LEI0166, LEI0192, MCW0016, MCW0037, MCW0078, MCW0111, MCW0165, MCW0183, MCW0206, MCW0295, MCW0330) were chosen from the FAO/MoDAD (2004), whereas the previously reported (Chen et al., 2008; Kaya and Yildiz, 2008; Muchadeyi et al., 2007; Osman, et al., 2006; Tadano, et al., 2007) other 17 MS markers (ADL0176, ADL0262, ADL0267, LEI0092, LEI0096, LEI0099, LEI0135, LEI0209, MCW0103, MCW0145, MCW0193, MCW0214, MCW0233, MCW0240, MCW0252, MCW0301, MCW0322) were chosen based on their high heterozygosity, chromosomal location, wide range of alleles and ease of amplification in multiplex polymerase chain reaction (PCR).
DNA was amplified by a standard PCR protocol with Negative dye PCR PreMix (Bioneer, Daejeon, Korea). The ABI 3130xl Genetic Analyzer (Applied Biosystems, Foster, CA, USA) was used for the capillary electrophoresis of the PCR product. The estimation of allele size was performed using GeneMapper Software ver. 4.0 (Applied Biosystems, Foster, CA, USA). The allele data thus retrieved was subjected to further statistical analysis.
Statistical analysis
The genetic variation within each breed was evaluated and compared. The total number of alleles (NA) at each locus, the respective allele frequency, observed (HObs) and expected (HExp) heterozygosities, and polymorphism information content (PIC) value for each breed across the locus were calculated using the GenAlEx 6.4 (Peakall and Smouse, 2006) and Cervus ver. 3.0.3 (Kalinowski et al., 2007).
The FIT (inbreeding coefficient of an individual relative to the total population), FST (the effect of subpopulations compared with the total populations) and FIS (inbreeding coefficient of an individual relative to the subpopulation) and values for each breed were calculated by the estimator of Weir and Cockerham (1984) using the FSTAT (Ver. 2.9.3, Goudet, 2001). The DA genetic distance (Nei et al., 1983) was calculated and phylogenetic trees were estimated using with DISAPN program (Ota, 1993).
The genetic structure and the degree of admixture of nine chicken populations were investigated using the Bayesian clustering procedure of STRUCTURE ver. 2.3 (Pritchard et al., 2000). We carried out 50 independent runs for each K value ranging from 2 to 11. For all runs, the admixture models with a burn-in period of 20,000 iterations followed by 100,000 iterations of Markov chain Monte Carlo algorithm. To identify the most probable groups (K) that best fit the data, we used the STRUCTURE Harvester (Earl and von Holdt, 2012), which implements the Evanno method (Evanno et al., 2005). The program CLUMPP ver. 1.1 (Jakobsson and Rosenberg, 2007) was used to align the 50 repetitions of the each K. The CLUMPP out files were visualized using DISTRUCT ver. 1.1 (Rosenberg, 2004).
RESULTS
Microsatellite polymorphisms, within and between populations
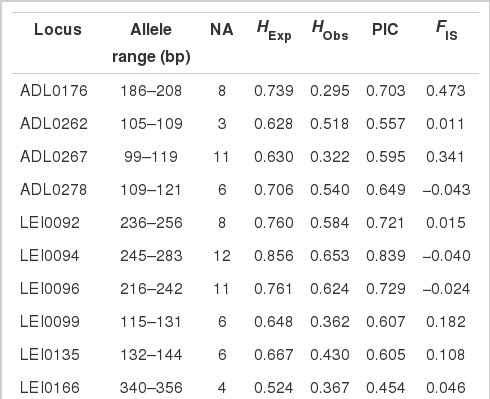
The microsatellite polymorphism, evaluated by the NA per locus, the mean heterozygosity, PIC and FIS (inbreeding coefficient) for each breed are described in Table 1. A total of 244 alleles were observed at the 30 microsatellite loci distributed in 450 chickens representing 9 chicken populations. All the microsatellite loci typed were polymorphic. The NA per locus ranged from 2 (MCW0103) to 15 (LEI0192), with a mean of 8.13 alleles. The mean of HExp across loci was 0.696, with estimates per locus ranging from 0.305 (MCW0103) to 0.857 (LEI0209). For HObs, the mean for all loci was 0.495, and the range was between 0.278 (MCW0103) and 0.680 (MCW0145). In this study most of the loci had high PIC values (PIC>0.5), with the exception of LEI0166 (0.454), MCW0078 (0.345), and MCW0103 (0.258). Of the 30 loci, four loci had negative coefficients and the mean FIS was moderate (0.102).
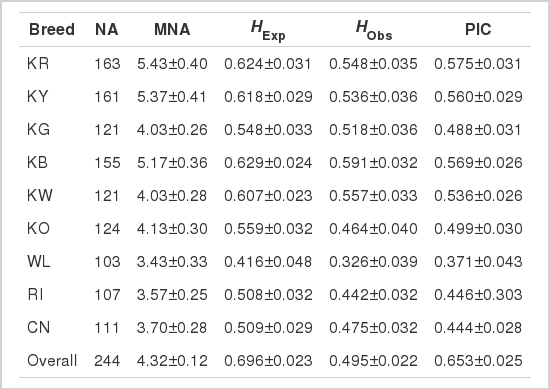
The breed statistics generated by the 30 microsatellite markers in nine chicken breeds are shown in Table 2. The mean NA in each breed ranged from 3.43±0.33 (WL) to 5.43±0.40 (KR). The two most diverse breeds were the KR and KB, which had the highest mean HExp (0.624 and 0.629), HObs (0.548 and 0.591), and PIC (0.575 and 0.569), respectively. The imported breed WL was the least diverse population, having the lowest mean HExp (0.416), HObs (0.326), and PIC (0.371).
The mean FIS, FST, and FIT Korean native and imported chicken breeds are given in Table 3. The overall inbreeding coefficient (FIT) observed for all nine breeds was 0.307±0.021. High FIT estimated (0.438±0.024) was observed in the imported flocks. Between-population variability (FST) was 0.351±0.021 in this group of populations.
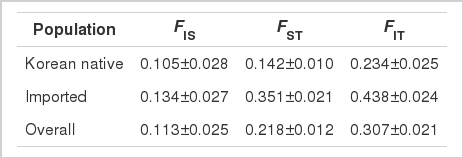
Within population (FIS), between populations (FST) and overall population (FIT) inbreeding coefficients and their standard errors of Korean native and imported chicken populations
An FIT of 0.234±0.025 and an FST 0.142±0.010 were observed in the Korean native flocks. The imported flocks showed higher genetic differentiation between breeds than the Korean native chicken breeds. The FIS estimate for imported flocks was higher (0.134±0.027) than that of the Korean native chicken flocks (0.105±0.028).
Genetic difference and distance among breeds
The Nei’s DA genetic distance is basically a correlation among the allele frequencies between breeds. Table 4 shows DA genetic distance between each pair for all nine chicken breeds, based on 30 microsatellite loci genotypes. The genetic distance ranges from 0.161 (KR and KY) to 0.450 (WL and RI). The genetic distance among five Korean native breeds (KR, KY, KG, KB, and KW) were also found to be quite low (0.161 to 0.243). Figure 1 shows a phylogenetic tree of nine chicken breeds that was constructed from DA genetic distances by using the unweighted pair group method with average linkages (UPGMA) dendrogram. Five Korean native breeds clustered together under one group, and formed a close group with RI. The WL culminates on a different node forming the out-group.
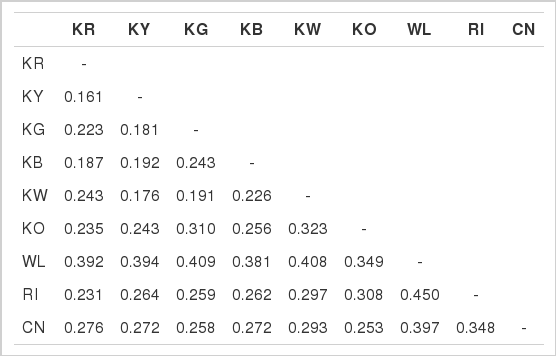
Nei’s DA genetic distance (Nei et al., 1983) among the nine chicken populations
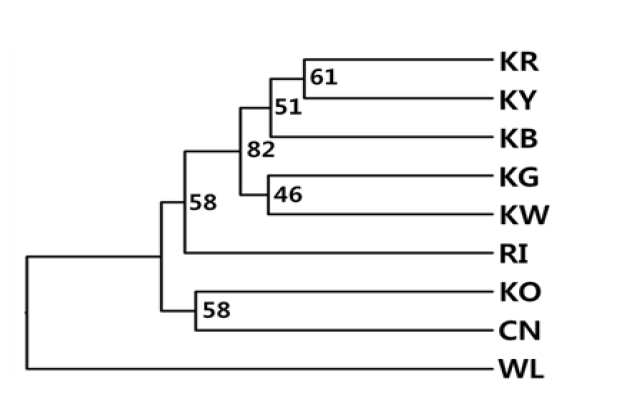
UPGMA dendrogram of genetic among nine chicken breeds based on DA genetic distances (Nei et al., 1983) estimated with 30 microsatellites. Numbers on the nodes are bootstrap values of 1000 replications. KR, Korean Reddish Brown; KY, Korean Yellowish Brown; KB, Korean Black; KG, Korean Grayish Brown; KW, Korean White; RI, Rhode Island Red; KO, Korean Ogye; CN, Cornish; WL, White Leghorn.
Cluster analysis
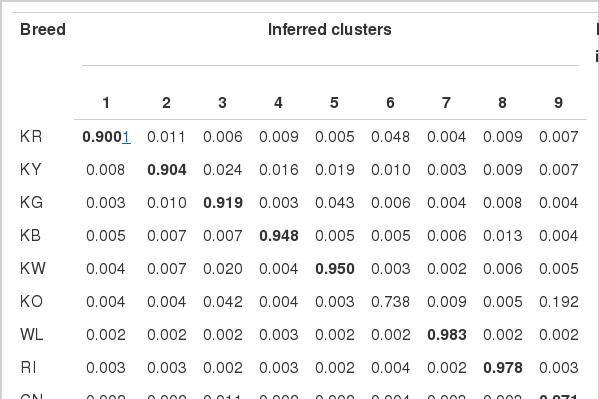
The analysis in STRUCTURE revealed that nine breeds should be divided in nine clusters (Figure 2) based on the highest ΔK value (data was not shown) according to Evanno et al. (2005). The KR, KY, KG, KW, WL, RI, and CN were each grouped in their own cluster with an estimated membership value higher than 0.90 (Table 5). The KO did also group in the own cluster but show relatively low estimated membership value (0.738).

Clustering assignment of the nine chicken populations obtained by STRUCTURE analysis. Each of the 450 birds is represented by a thin vertical line, which is divided into colored segments which represent the proportional contribution of the inferred K = 9 clusters. The populations are separated by thin vertical black lines. KR, Korean Reddish Brown; KY, Korean Yellowish Brown; KG, Korean Grayish Brown; KB, Korean Black; KW, Korean White; KO, Korean Ogye; WL, White Leghorn; RI, Rhode Island Red; CN, Cornish.
DISCUSSION
The FIS represents a degree of nonrandom mating (deviation from Hardy-Weinberg equilibrium). A positive number for FIS means a deviation from Hardy-Weinberg equilibrium. Seven out of 30 markers named ADL0278, LEI0094, LEI0096, LEI0209, MCW0016, MCW0214, and MCW0252 showed a negative number. However, all the others showed a positive number. This result indicated that nonrandom mating was performed in Korean chicken breeds studied in the present analysis. It is known that these breeds were extensively crossbred in the earlier years until 1970 when the government realized the importance of pure native breeds and started a program where the native breeds were re-bred within same strains to recover the pure strains (Kong et al., 2006). The mean FST value of 0.218 indicates that approximately 21.8% of the total genetic variation is caused by breed differences, whereas the remaining 87.2% is due to differences among individuals within breeds. White leghorn exhibited a lower degree of genetic diversity (mean number of alleles [MNA] = 3.43, HExp = 0.416, HObs = 0.326, PIC = 0.371) than all other breeds in all measures of genetic diversity whereas a high degree of diversity was observed in KR (MNA = 5.43, HExp = 0.624, HObs = 0.548, PIC = 0.575) and KB (MNA = 5.17, HExp = 0.629, HObs = 0.591, PIC = 0.569). Heterozygosity was observed for WL as quite low compared to other breeds which may be due to inbreeding among closely related birds. High diversity in Korean native chicken breed may be attributed to breeding among large number of individuals in a wider and different geographical locations.
Heterozygosity estimates within the population were based on a set of markers showing substantial heterogenity in the NA detected and in the PIC (Wimmers et al., 2000). There are difficulties in comparing the present results with previous study results, as they were obtained with different marker sets. Even though they have been obtained with different marker sets, the HExp and PIC (0.696 and 0.653) values observed in Korean chicken breeds were found to be higher than reported by Tadano et al. (2007) for Japanese chicken breeds (HExp = 0.432 and PIC = 0.373) and Wilkinson et al. (2012) for 24 British chicken breeds (HExp = 0.49). Whereas the values for HExp and PIC reported by Kong et al. (2006) for Korean chicken breeds (HExp = 0.630 and PIC = 0.552), Kaya and Yildiz (2008) for Turkish breeds (HExp = 0.665 and PIC = 0.610) and Chen et al. (2008) for 15 Chinese breeds (HExp = 0.644) were almost similar to or slightly higher than the values obtained for the present analysis. These results indicated Korean native chicken (KNC) breeds have kept a high level of genetic diversity.
In the phylogenetic tree, the KNC breeds showed a close relationship, with the exception of the KO breed. The RI appeared genetically closer to the KNC breeds, whereas WL was genetically distinct from other breeds.
Bayesian clustering approaches gives more accurate information on breed relationships (Leroy et al., 2008). The ΔK statistic was obviously at a maximum at K = 9, which suggest the most probable number of inferred clusters (K = 9). As well the results support the upshot of the analysis by Seo et al. (2013) where in five Korean native chicken breeds five underlying genetic clusters were identified. The results revealed that Korean chicken breeds are continuing without introgression of imported breeds.
The current study is the first detailed analysis based on the 30 MS marker polymorphisms of the genetic diversity in the six Korean native chicken breeds which have been recognized by the DAD-IS of the FAO (http://dad.fao.org/). The knowledge obtained regarding Korean chicken breeds as estimated by microsatellite analysis may also be useful as an initial guide in defining objectives for designing future investigations of genetic variation and developing conservation strategies.
ACKNOWLEDGMENTS
This work was carried out with the support of “Cooperative Research Program for Agriculture Science & Technology Development (Project No. PJ006973012011)” Rural Development Administration, Republic of Korea. This study was supported by 2014 Postdoctoral Fellowship Program of National Institute of Animal Science, Rural Development Administration, Republic of Korea.
