Thoroughbred Horse Single Nucleotide Polymorphism and Expression Database: HSDB
Article information
Abstract
Genetics is important for breeding and selection of horses but there is a lack of well-established horse-related browsers or databases. In order to better understand horses, more variants and other integrated information are needed. Thus, we construct a horse genomic variants database including expression and other information. Horse Single Nucleotide Polymorphism and Expression Database (HSDB) (http://snugenome2.snu.ac.kr/HSDB) provides the number of unexplored genomic variants still remaining to be identified in the horse genome including rare variants by using population genome sequences of eighteen horses and RNA-seq of four horses. The identified single nucleotide polymorphisms (SNPs) were confirmed by comparing them with SNP chip data and variants of RNA-seq, which showed a concordance level of 99.02% and 96.6%, respectively. Moreover, the database provides the genomic variants with their corresponding transcriptional profiles from the same individuals to help understand the functional aspects of these variants. The database will contribute to genetic improvement and breeding strategies of Thoroughbreds.
INTRODUCTION
The Thoroughbred is an important animal and a favorite breed for use in the horse racing industry. The speed and agility of Thoroughbred horses have resulted in the emergence of an industry involved in the breeding, training, and racing of elite racehorses worth many billions of dollars (Gordon, 2001). The genome-wide analysis of the horse has grown rapidly in recent years and is expected to impact the racing capacity of Thoroughbreds (Petersen et al., 2013). In horse genomics studies, SNP is a valuable resource for functional genomics and for annotating functional genes on the horse genome. For example, strong candidate genes, such MSTN, related to racing performance can be searched using single nucleotide polymorphism (SNP) chips at the genomic level. There is a great interest in SNPs since a catalog of SNPs is expected to facilitate large-scale studies in association genetics, functional and pharmaco-genomics, population genetic and evolution biology (Sherry et al., 2001).
Genome databases are comprehensive public repositories for genome mapping data from animal species including cow, pig and so forth (Sherry et al., 2001; Hubbard et al., 2002). Within a short span of ten years, information on the structure and organization of the horse genome has grown exponentially (Chowdhary and Raudsepp, 2008). A whole genome database of the horse was constructed by the Horse Genome Project at the Broad Institute (Wade et al., 2009). Also, several groups have studied horse genomics by sequencing the horse genome and using SNP chips (Wade et al., 2009; Hill et al., 2010; Park et al., 2012). While the horse reference genome is available, genome-wide linkage maps of the horse as well as quantitative trait mapping were not integrated into the database.
Although the horse is an important animal, there are only a few genome browsers dedicated to the horse such as the Model Organism Database for Horses and University of California Santa Cruz Genome Browser for horse. The known genomic information related to horses is a small portion of the whole horse genome and in order to better understand horses, more variants and other integrated information are needed. Thus, we construct a horse genomic variants database from a Thoroughbred population using next-generation sequencing (NGS) technologies. Although only limited genomic information is available on horses, integration of various NGS data on horses will accelerate the progress of horse genome research. Therefore, we integrated genes based on SNPs from NGS data of Thoroughbreds, expression from RNA-seq results and information on linkage disequilibrium (LD).
This database provides horse genomic variants and transcriptome information, which is easy to apply to other data for both researchers and breeders. (Horse single nucleotide polymorphism and expression database (HSDB) provides the unexplored genomic variants which still remain to be identified in the horse genome including rare variants by using horse population genome sequencing. Moreover, the database provides the genomic variants with their corresponding transcriptional profiles from the same individuals to help understand the functional aspects of these variants.
MATERIALS AND METHODS
Ethics
This study was carried out in strict accordance with recommendations in the Guide for the Care and Use of Laboratory Animals of Pusan National University and the Korean Racing Authority. In addition, all experimental procedures used in this study related to animals were approved by the Institutional Animal Care and Use Committee of the Pusan National University (PNU-2013-0417).
Whole genome re-sequencing
Two set of whole-blood samples were collected from 18 Thoroughbred racing horses from the Korean Racing Authority. Genomic DNA was extracted and the DNA quality was checked with agarose gel electrophoresis and fluorescence-based quantification tests. Constructing and sequencing library were carried out using Illumina’s TruSeq DNA Sample Preparation kits and Hiseq2000 protocols.
RNA-seq library preparation and sequencing
Muscle and blood samples were collected before and after exercise from four Thoroughbred racing horses. Total RNA from the resulting 16 samples from four horses were isolated using TRIzol (Invitrogen) and RNeasy RNA purification kits with DNase treatment (Qiagen). Isolated mRNA was reverse transcribed into double strand cDNA. Constructing and sequencing RNA-seq library of each sample were carried out using Illumina Hiseq2000 protocols.
Identification of single nucleotide polymorphism: whole genome re-sequencing
The quality of raw data was checked by FastQC. To reduce false positive SNP, we trimmed the 3′-end of reads to have a minimum phred-scaled quality score of over 20. Paired-end sequence reads were aligned to the reference horse genome (EquCab2) with Bowtie2 (version 2.0.0-beta6) (Langmead and Salzberg, 2012) using very-sensitive and no-mixed mode option. For 4 Horses data encoded Phred Scale Quality Score with Illumina 1.5 with—phred64 option. Picard tools, SAMtools (Li et al., 2009), and genome analysis toolkit (GATK 2.1.8) (McKenna et al., 2010) were used for downstream processing and variant calling. Downstream processing was carried out using typical GATK pipeline. For the base quality score recalibration (BQSR) step of GATK, Dstitution calls were made with GATK UnifiedGenotyper and the variants were discarded if i) recalibrated quality score was less than 30, ii) three SNPs existed within a 10 base pair window, iii) SNPs existed in a detected insertion and deletion (INDEL), iv) the number or proportion of reads, which have mapping quality score of 0 are bigger than 4% or 10%, respectively, v) the number of alternative allele was bigger than one (multi-allele type).
Identification of single nucleotide polymorphisms: RNA-seq
For SNP detection using RNA-seq data, we pooled the raw data of four samples (muscle before exercise, muscle after exercise, blood before exercise, and blood after exercise) of each individual. Pooled paired-end sequences were aligned to the same reference horse genome using Tophat (version 2.0.4) (Trapnell et al., 2009) with very-sensitive option. Downstream processing was carried out with the same procedure as the whole genome re-sequencing except for the local realignment process because the mapping result of Tophat is not proper for the local realignment step.
Expression from RNA-seq
Twenty-four sets of transcriptome data were generated for muscle and blood from six horses both before and after exercise. TopHat, (used to align RNA sequences to a genome in order to identify exon-exon splice junctions) was used to map the sequences to a horse reference genome, annotated using the EquCab2 and determined gene expression as discrete measurement. The R package edgeR (Robinson et al., 2010) was used to identify differentially expressed genes (DEGs), which is based on a negative binomial model, to examine differential expression of replicated count data.
Single nucleotide polymorphisms chip
The SNP chip data used in this study are from Kim et al. (2013) and comes from 11 Thoroughbred horses genotyped using EquineSNP50 Genotyping BeadChip (Illumina, Inc., San Diego, CA, USA).
Annotation and building database and linkage disequilibrium
Variant files of each individual were merged using VCF tools (Danecek et al., 2011) and then annotated using snpEff 3 (Cingolani et al., 2012). Ensembl general feature format (GTF, gene sets) information was used to build Equcab2.68 snpEff database. The result of snpeff annotation was modified to make SNP database with SQLite3. Linkage disequilibrium was calculated by Haploview (Barrett et al., 2005).
RESULTS
Contents of the horse single nucleotide polymorphism and expression database
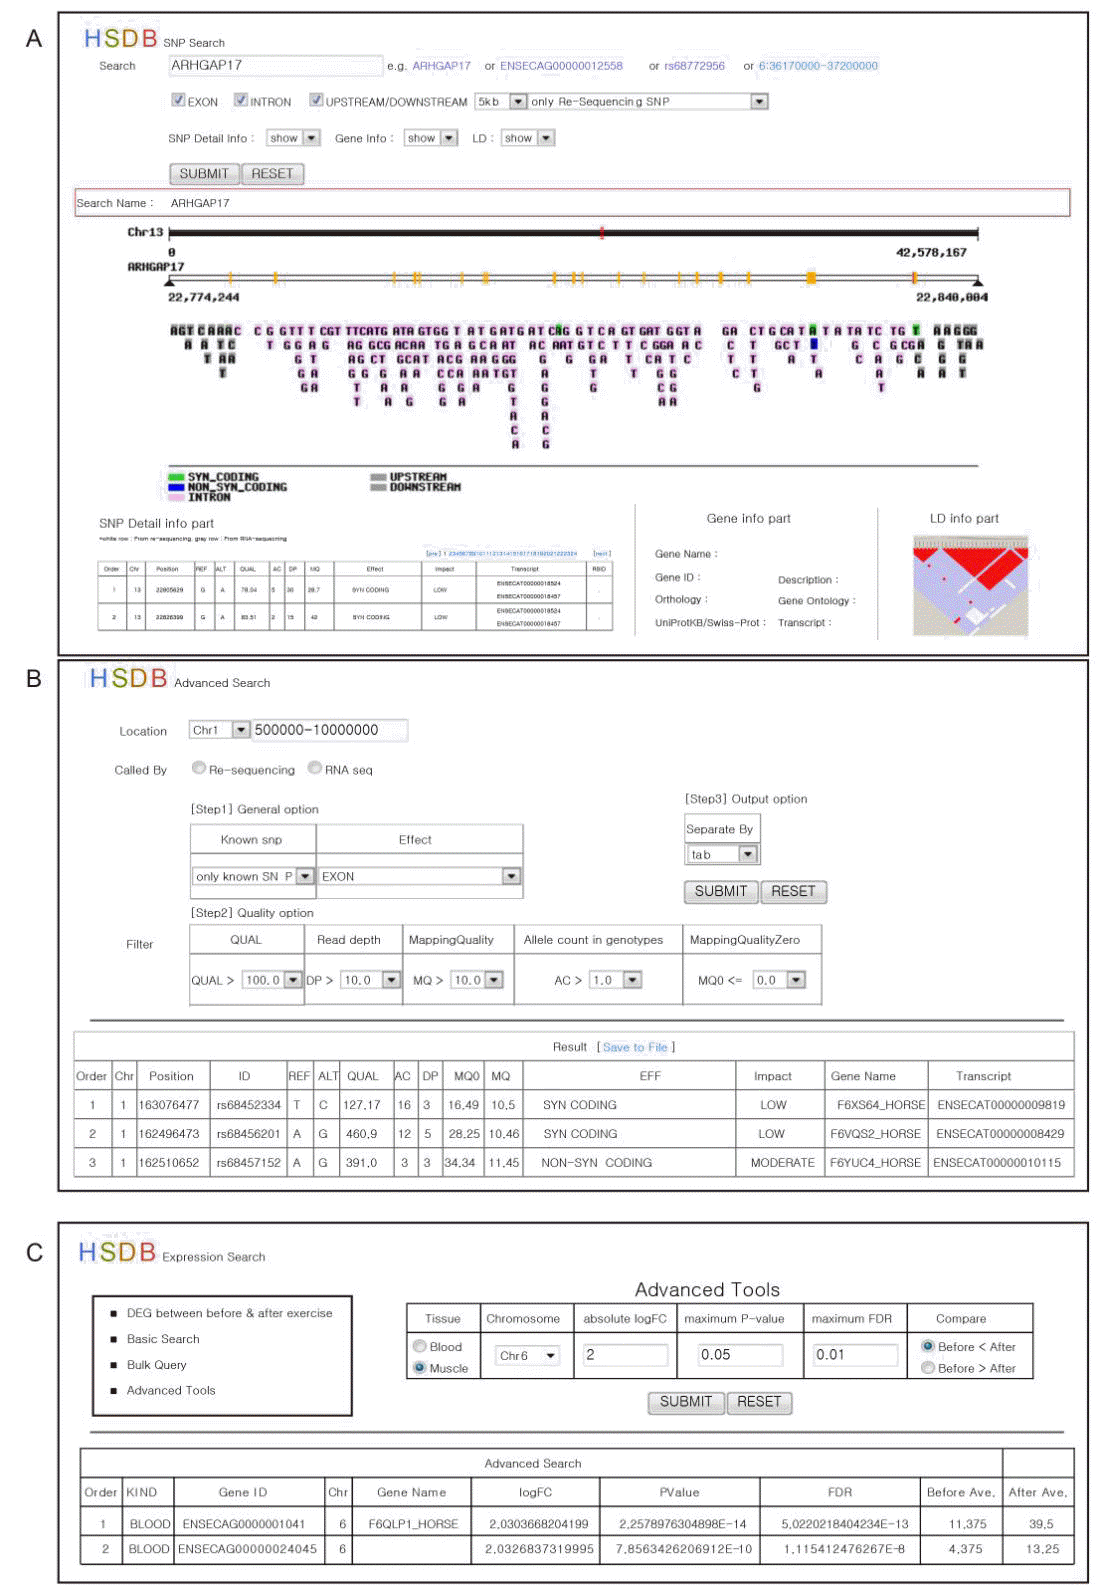
HSDB used comprehensive genomic information source from horse with human and mouse to confirm gene predictions that have been integrated with external data. HSDB is available at http://snugenome2.snu.ac.kr/HSDB. This database displays novel SNPs detected using RNA-seq as well as SNPs from re-sequencing data. Also this database displays an expression level and LD map for SNPs in the selected genes. The web interface allows interactive use of the information related to the horse variants. The interface consists of five menus: Introduction, SNP Search, Advanced Search, Expression Search, and Contact (Figure 1). Users can obtain variant information from the SNP Search and Advanced Search menu, and expression information from the Expression Search menu. Genetic variants and expression information can be searched by gene symbol or SNP position and the query will retrieve an array of results including a distribution of variants, gene information, expression and differentially expressed test results.

Horse SNP database web page. Horse single nucleotide polymorphism and expression database (HSDB) is available at http://snugenome2.snu.ac.kr/HSDB. (A) Users can search SNP or corresponding gene information using SNP position or RS ID or gene symbol. After searching the SNP, user can see the SNPs within the gene, there are several colors depending their effect. User will get more detail information including reference and alternative allele information, SNP position, SNP quality, depth, and effect impact (high, moderate, low, modifier) which definition follows snpEff. HSDB also enables the user to obtain gene annotation information including transcript ID and gene description, gene ontology term and orthology ID with human and mouse. Users can see the linkage disequilibrium map of interest gene. (B) Advanced Search provides similar results of SNP Search, but user can search the SNPs with many filtering options. (C) HSDB provides expression information of muscle and blood from 4 horses both before and after exercise, especially DEG information. User can search the expression information according to their interest using the Advanced Tools of Expression Search. SNP, single nucleotide polymorphism.
The SNP Search page provides a simple search function for detailed SNP information. The SNPs were represented in different colors according to the characteristic of the distribution of variants, i.e., if a SNP exists in an intron region its position is marked pink, and non-synonymous SNPs that lead to an amino acids change in the exon is represented in blue. The details of SNPs are reported in a table which includes predicted effects of variants (e.g. splice site donor) by using snpEff and the impact (High, Moderate, Low, Modifier) defined by snpEff. User can select the source of the SNP information: re-sequencing or RNA-seq. Moreover, there is gene description including gene function, human and mouse orthologous genes information and related gene ontology terms. The Advanced Search page is similar to the SNP Search page, but the user can search SNPs with additional options catered to their interests including known SNPs or novel SNPs, the effect, quality options include depth, quality and frequency, etc. The Expression Search page consists of four menus: ‘DEG between before and after exercise’, ‘Basic Search’, ‘Bulk Query’ and ‘Advanced Tools’. The user can search the expression information and find information on DEGs between before and after exercise from blood and muscle. The Advanced Tools of Expression Search page has several filtering option, tissue, chromosome, log fold change, p-value, false discovery rate corrected p-value and which state (before and after) is higher average values.
Identification genic single nucleotide polymorphisms and differentially expressed genes
We analyzed both genomic and transcriptomic sequences from Thoroughbred individuals. Users can explore the relationship between identified genomic variants and its corresponding variants from the RNA-seq data. We made it possible that analyses integrate genome and transcriptome data across multiple individuals and reveal extensive variation at both levels.
We identified a total of 3,418,393 non-redundant SNPs from genic region from the re-sequencing of 18 samples (3,356,634 SNPs) and RNA-seq of 4 samples (443,725 SNPs) (Supplementary Tables S1 and S2) and 14.8% loci were shared between the two datasets. Approximately 10% of the SNPs overlapped with loci of dbSNP; 346,489 (10.32%) of re-sequencing and 56,931 (12.83%) of RNA-seq.
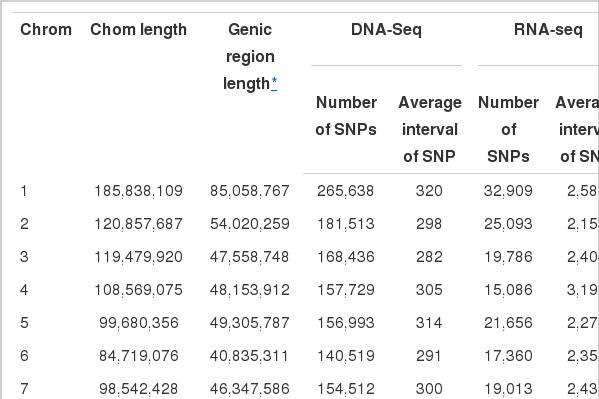
The SNPs were classified into several categories based on the region of their location (Table 1). A large number of SNPs exist in the intron region for both re-sequencing and RNA-seq data. The large number of RNA-seq SNPs in intronic regions is similar to previous reports of a large proportion of intronic reads in many RNA-seq datasets (Kapranov et al., 2010; Van Bakel et al., 2010; Wetterbom et al., 2010; Ameur et al., 2011; St Laurent et al., 2012). We identified regulatory related SNPs such as those in a splice site, upstream and downstream ~20kb region as well as genic SNPs.
The DEGs information from another Thoroughbred study (Kim et al., 2013) which generated 24 RNA-seq datasets from muscle and blood tissue from six horses, taken before and after exercise, identified 1,822 up-regulated genes (URGs) and 930 down-regulated genes (DRGs) in muscle tissue, 222 URGs and 200 DRGs in blood tissue after exercise.
Data concordance and validation
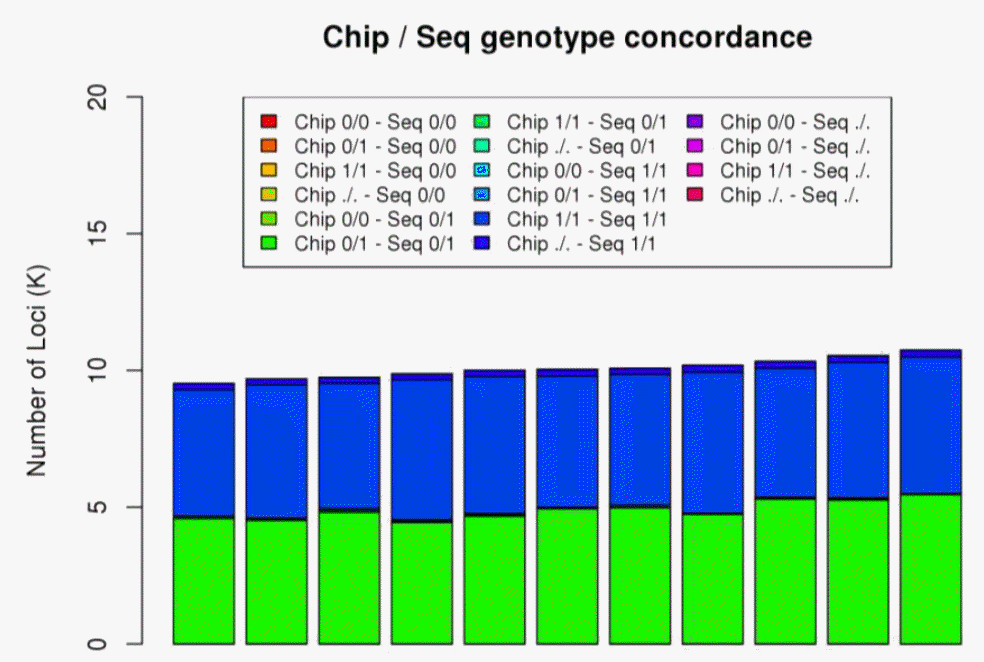
We checked the level of concordance and validated the SNPs by comparing the results. We used commercial horse chips to confirm allele type and used RNA-seq data to reduce the false positive rate. The SNPs were validated on 11 horse SNP Chip data by showing that 16,795 (99.96%) of the 16,802 identified loci had same alleles. We also calculated concordance as the fraction of identical genotypes between the SNP chip and re-sequencing data (Figure 2). Eleven samples had 99.02% genotype concordance with ranges from 98.3% to 99.57%. Four out of 18 re-sequenced samples were used as RNA-seq samples, so we calculated the loci and genotype concordance of the two datasets per-individual. Each sample had a similar number of SNPs, at about 2,128K. About 214K out of the total loci (10%) was shared between samples when the loci of SNPs from RNA-seq and re-sequencing were compared. Average genotype concordance rate, which is the proportion of concordant calls with the same allele between the two datasets, is 96.6% out of over ~217K loci. The high genotype concordance rate and percentage of known SNPs indicate that the concordant SNPs were of high quality and accuracy.

Genotype concordance. Genotype concordance rate which is the proportion of concordant calls having a consistent same genotype between the SNP chip and re-sequencing datasets of 11 samples. Loci of SNP chip were filtered with Hardy-Weinberg equilibrium p-value <0.001, SNP call rate <99%. Type of genotypes are showed as 0/0, 0/1, 1/1 and “./.”. 0 and 1 represents reference allele, alternative allele and “.” means missing allele. SNP, single nucleotide polymorphism.
DISCUSSION
In this article we described HSDB, an integrated database with genomic variants from whole genome sequencing and RNA-seq, gene annotation, orthologous genes, states-specific expression data and LD maps of horse data sets. Integrating various data, HSDB is a useful tool for researching genomic and biological mechanisms of the horse. HSDB has successfully searched the 3,418K identified SNPs in horse genes including upstream and downstream regions. Validation was conducted by comparing the variants of re-sequencing of four individuals, the variants of RNA-seq of the corresponding four individuals and SNP chip of four individuals. The identified variants were confirmed with high concordance between individuals. The variants from NGS were confirmed with SNPs from SNP chip data of eleven individuals and on average 99.02% genotypes were the same. The 96.6% among 214K shared loci in each sample between RNA-seq and re-sequencing had consistent same genotypes
HSDB provides integrated information to the users in a single database. Users can search by SNP position or gene symbol and get various information: SNPs, expression information, gene structure, function, orthologous information, gene ontology and LD. This allows researchers to use integrated analysis of variants and expression. HSDB is more than a SNP database for the horse genome. Users can research interesting SNPs or genes using this integrated information. Therefore, the user could get information of significant SNPs as their genome-wide association study (GWAS) result, and could get the material for input and fine mapping of a notable region. In addition, it provides the expression data and SNPs that exist ~20kb upstream and downstream that have regulatory components for the corresponding gene. The information can be used to analyze relationships between genomic variant of the regulatory region and the expression level in muscle and blood. Thus, it is a powerful tool for understanding the diversity and expressional aspects of horse genomic variants.
The significance of the study lies in the creation of a well-established horse related database because genetics is an important aspect of breeding and selection of horses. To better understand the genetics underlying horses, information on variants is needed. We believe that the integration of various NGS data on horses will help accelerate horse genome research. In this study, we integrated genes based on SNPs from NGS data of Thoroughbreds, expression from RNA-seq results and annotation information to make a database. Even though HSDB gives a large amount of information, it also showed that a number of unexplored genomic variants still remain to be identified in the horse genome including rare variants by using population genome sequences of eighteen horses and RNA-seq of four horses.
Currently, genome research of animals has been focused on genome-wide information. The database provides information on variant and expression level that is useful for identifying genes associated with economically important traits, studying functional genomics of the horse and researching genetic breeding. The database may contribute to genetic improvements and breeding strategies of horses.
ACKNOWLEDGMENTS
This work was supported by a grant from the Next Generation BioGreen 21 Program (No.PJ008106 and PJ008196), Rural Development Administration, Republic of Korea.


