Effects of a Chelated Copper as Growth Promoter on Performance and Carcass Traits in Pigs
Article information
Abstract
Three studies were conducted to investigate whether a chelated Cu can replace CuSO4 as a growth promoter in pigs. In Exp. 1, a total of 240 piglets (Large White×Landrace, 7.36±0.10 kg) were randomly allocated to 1 of 3 treatments with 8 replicates and 10 piglets per pen. Treatments included a NRC control (CuSO4, 6 mg/kg), two Cu supplementations from either CuSO4 or Cu(HMTBa)2 at 170 mg/kg. Pigs fed Cu(HMTBa)2 were 6.0% heavier than pigs fed either the NRC control or 170 mg/kg CuSO4 (p = 0.03) at the end of the experiment. During the 42 days of experimental period, pigs fed Cu(HMTBa)2 gained 9.0% more (p = 0.01), tended to eat more feed (p = 0.09), and had better feed efficiency (p = 0.06) than those fed CuSO4. Compared with the 6 mg/kg CuSO4 NRC control, liver Cu was increased 2.7 times with 170 mg/kg CuSO4 supplementation, and was further increased with Cu(HMTBa)2 (4.5 times, p<0.05). In Exp. 2, a total of 616 crossbred piglets (PIC, 5.01±0.25 kg) were randomly allocated to 1 of 4 treatments with 7 replicates and 22 piglets per pen. Treatments included a NRC control (from CuSO4), and three pharmaceutical levels of Cu (150 mg/kg) supplemented either from CuSO4, tri-basic copper chloride (Cu2[OH]3Cl), or Cu(HMTBa)2. Pigs fed CuSO4 or Cu(HMTBa)2 had better feed efficiency (p = 0.01) and tended to gain more (p = 0.08) compared with those fed the NRC control. Pigs fed Cu2(OH)3Cl were intermediate. Pigs fed Cu(HMTBa)2 had the highest liver Cu, which was significantly higher than those fed (Cu2[OH]3Cl) or the negative control (p = 0.01). In Exp. 3, a total of 1,048 pigs (PIC, 32.36±0.29 kg) were allotted to 6 treatments with 8 replicates per treatment and 20 to 22 pigs per pen. The treatments included a NRC control with 4 mg/kg Cu from CuSO4, a positive control with 160 mg/kg Cu from CuSO4, and incremental levels of Cu(HMTBa)2 at 20, 40, 80, and 160 mg/kg. During the overall experimental period of 100 days, no benefit from 160 mg/kg CuSO4 was observed. Pigs fed Cu(HMTBa)2 had increased ADG (linear and quadratic, p≤0.05) and feed efficiency (linear and quadratic, p≤0.05) up to 80 mg/kg and no further improvement was observed at 160 mg/kg for the whole experimental period. Pigs fed 80 mg/kg Cu(HMTBa)2 weighed 1.8 kg more (p = 0.07) and were 2.3 kg heavier in carcass (p<0.01) compared with pigs fed 160 mg/kg CuSO4. In addition, loin depth was increased with increased Cu(HMTBa)2 supplementation with pigs fed 80 mg/kg Cu(HMTBa)2 had the greatest loin depth (p<0.05). In summary, Cu(HMTBa)2 can be used to replace high CuSO4 as a growth promoter in nursery and grower-finisher pigs.
INTRODUCTION
Requirement of Cu as a nutrient is low and NRC (1998) recommends 3 to 6 mg/kg Cu for nursery and grower-finisher pigs. In practice, pharmaceutical Cu from CuSO4 (125 to 250 mg/kg) is routinely added in nursery pigs as a growth promoter and its benefits on feed intake and weight gain have been well documented (Bunch et al., 1961; Hawbaker et al., 1961). However, high dietary Cu presents an environmental concern when excess Cu is excreted in feces (Kornegay and Harper, 1997). Roof and Mahan (1982) reported a 14-fold increase of fecal Cu excretion with 250 mg/kg CuSO4 supplementation compared with the non-supplemented control. Accumulation of Cu and Zn in the soil has been implicated to reduce crop yield (Tucker, 1997) and pose an environmental threat. In addition, it has been demonstrated that high dietary Cu from inorganic sources antagonizes other nutrients utilization, such as Zn (Zhao et al., 2008) and P (Banks et al., 2004). Due to the negative impact of high dietary CuSO4, the Commission of the European Communities regulate maximum allowed total Cu in feed with 170 mg/kg in piglets up to 12 weeks of age and 25 mg/kg in all other pigs. Other countries are following with similar regulations.
The mode of action of high Cu might due to its antibacterial function in the lumen (Shurson et al., 1990) directly or indirectly through absorption from lumen to liver, secretion to the bile, and then back to the lumen loop. This theory is partially supported by Zhou et al. (1994), whose research indicated that intravenous injection of copper histidinate, which bypass the lumen, had similar growth promoting effect as dietary supplementation. Compared with inorganic trace minerals, chelated trace minerals are more bioavailable, likely due to reduced incidence of antagonism with other dietary constituents in the gastrointestinal tract (Wang et al., 2007; Zhao et al., 2010). Our previous study suggested that Cu(HMTBa)2 is better at avoiding nutrient antagonism and less is needed to achieve similar or better performance compared with inorganic minerals in broilers (Zhao et al., 2010) and nursery pigs (Zhao et al., 2009). The objective of these studies was to evaluate a chelated Cu (Cu[HMTBa]2) as a growth promoter on performance, liver Cu and carcass traits in nursery and grower-finisher pigs.
MATERIALS AND METHODS
Exp. 1 was conducted in Segovia, Spain and met appropriate current quality standards and guidance of the European Food Safety Authority (EFSA). Exp. 2 and 3 were conducted at the University of Missouri (Columbia, MO). All animal procedures were approved by the University of Missouri Animal Care and Use Committee. Cu(HMTBa)2 (Mintrex Cu, Novus International Inc., St Charles, MO) is a chelate of one Cu atom coordinated with two molecules of 2-hydroxy-4-methylthio butanoic acid (HMTBa). Methionine activity from Cu(HMTBa)2 (80% Met activity, Yi et al., 2007) was accounted for and all diets were adjusted to be equal in methionine. Tribasic Cu chloride (Cu2[OH]3Cl) is a more concentrated form of Cu (58%), less soluble in water (<1%), and is viewed as a less destructive form of Cu when combined with vitamins.
Exp. 1: Benefits of Cu(HMTBa)2 as a growth promoter in nursery pigs
A total of 240 crossbred piglets (Large White×Landrace, 26 d of age, 7.36±0.10 kg) were randomly allocated to 1 of 3 experimental treatments based on sex, litter of origin, and BW with 8 replicates for each treatment and 10 piglets per pen. All pigs were fed a common creep feed from 21 to 25 days of age, then initiated treatments at 26 days of age. The treatments included a NRC control (Cu 6 mg/kg, Mn 4 mg/kg, and Zn 100 mg/kg for phase I; Cu 5 mg/kg, Mn 3 mg/kg, and Zn 80 mg/kg for phase II from sulfates), as well as the two treatments at European maximum level (total Cu 170 mg/kg, Mn and Zn at 150 mg/kg from sulfates) with added Cu came either from CuSO4 or Cu(HMTBa)2. Table 1 listed detailed treatment descriptions. The nursery rooms were lit by a combination of daylight (through skylights) and artificial light (non-programmable). The pens were slatted and ventilation was achieved by single, variable-speed fans linked to temperature sensors. Diets were provided ad libitum throughout the trial from hoppers and water from two nipple drinkers per pen.

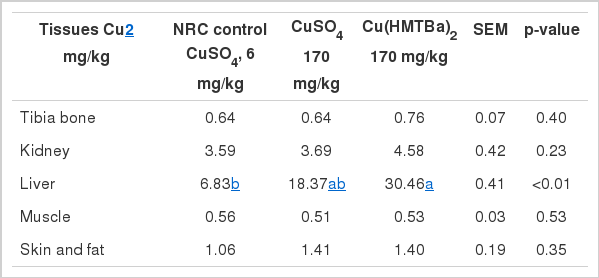
Typical European mixed-grain diets (barley, wheat, corn, and soybean meal) were formulated to meet or exceed NRC (1998) nutrient recommendation for piglets (Table 2). Pigs were fed two phase diets (d 0 to 14 and d 15 to 42). No veterinary antibiotics or veterinary zinc oxide was included in any diets. Diets were analyzed for Cu content using atomic absorption spectrometry (AOAC 968.08), ash by incineration (AOAC 942.05), protein by Kjeldahl (AOAC 984.13), and ether extract by Soxhlet fat analysis (AOAC 920.39) as described by the AOAC (2000). Weight gains, feed intakes and feed conversion were determined at the end of each feeding period. At the end of the experiment, one medium-size piglet per pen was slaughtered and tissue sampled (muscle, liver, kidney, skin and fat, and tibia bone) for Cu deposition analysis (AOAC 968.08).
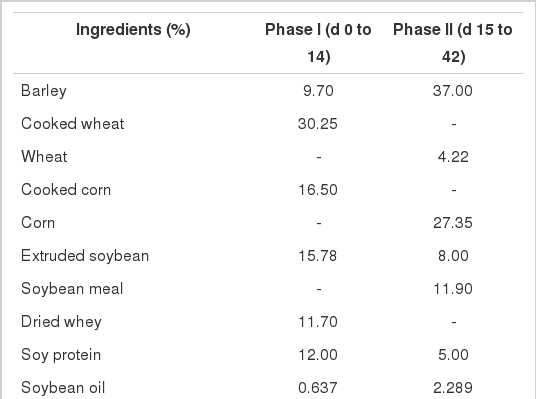
Basal diet composition and nutrient profile (Exp. 1)
Exp. 2: Comparison of different Cu sources as growth promoter in nursery pigs
A total of 616 crossbred piglets (PIC, 20 days of age, 5.02±0.25 kg) were randomly allocated to 4 experimental treatments based on sex and BW with 7 replicates for each treatment and 22 piglets per pen. The treatments included a NRC negative control (6 mg/kg Cu from CuSO4), and 3 treatments supplemented with different Cu sources (CuSO4, Cu2[OH]3Cl, and Cu[HMTBa]2) at 150 mg/kg. The pens were slatted and ventilation was achieved by single, variable-speed fans linked to temperature sensors. Diets were provided ad libitum throughout the trial from hoppers and water from 2 nipple drinkers per pen.
Typical North American commercial nursery diets (corn-soybean meal) were formulated to meet or exceed NRC (1998) requirement (Table 3). High Zn (3,000 mg/kg) from zinc oxide was included during the first seven days post-weaning as typical commercial practice. Diets were analyzed for Cu content using atomic absorption spectrometry (AOAC 968.08). Weight gain, feed intake and feed efficiency were determined for the whole experimental period (21 days post-weaning). At the end of the trial, one medium-size piglet per pen was slaughtered for liver mineral analysis.

Basal diet formula and nutrient profile (Exp. 2)
Exp. 3: Benefits of Cu(HMBa)2 on growth performance and carcass traits in grower-finisher pigs
The third experiment was designed to investigate whether Cu(HMTBa)2 can replace high dietary CuSO4 as growth promoter in grower-finisher pigs. A total of 1,048 pigs (PIC C22, 32.36±0.29 kg) were allotted to 1 of 6 dietary treatments in a randomized complete block design with 8 pens per treatment and 20 to 22 pigs per pen based on BW and gender. Gilts and barrows were housed separately in an environmentally controlled room with access to feed and water ad libitum. All pigs were fed a Cu deficient diet for the first 21 days then switched to experimental diets. The treatments included a basal control with 4 mg/kg Cu from CuSO4, a positive control with 160 mg/kg Cu from CuSO4, and incremental levels of Cu(HMTBa)2 at 20, 40, 80, or 160 mg/kg. Different Cu(HMTBa)2 doses were mixed by blending the highest level (160 mg/kg) with the basal to make targeted doses in the final diets. Pigs were fed five phases diets of d 0 to 21 (30 to 50 kg), d 22 to 42 (50 to 70 kg), d 43 to 62 (70 to 90 kg), d 63 to 80 (90 to 100 kg), and d 81 to 100 (100 to 120 kg). Corn-soybean meal-dried distillers grains with solubles (DDGs) diets were made to satisfy NRC (1998) requirements (Table 4). Ractopamine (4.5 mg/kg) was used in the last 28 days before marketing. Pen weight and feed intake were collected for each feeding phase and feed efficiency was calculated and adjusted for mortality. At the end of the study, all pigs were harvested at the same time at a Missouri process plant and carcass traits were recorded on a pen basis.
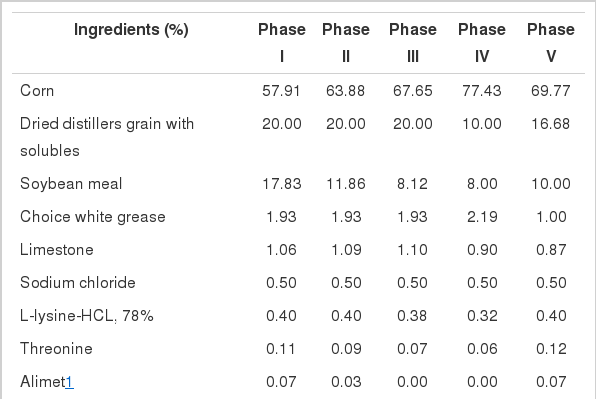
Basal diets composition and nutrient profile (Exp. 3)
Statistical analyses
Data were analyzed as a randomized completely block design ANOVA using GLM of SAS 9.0 (SAS Institute, 2002). In experiment three, linear and quadratic effects of Cu(HMTBa)2 were analyzed. Pen was the experimental unit. Statistical significance was declared at p≤0.05, with 0.05<p≤0.10 considered as a near-significant trend.
RESULTS
Analyzed dietary Cu level
Analyzed dietary Cu levels in Exp. 1 were 15, 149, and 169 mg/kg in phase I and 11, 145, and 160 mg/kg in phase II, which were similar to the targeted levels of 6, 170, and 170 mg/kg added Cu, respectively. In Exp. 2, the analyzed Cu levels were 19, 117, 162, and 208 mg/kg in phase I and 14, 154, 140, and 188 mg/kg in phase II, respectively. Dietary Cu was not analyzed in Exp. 3.
Exp. 1
At the end of the study, pigs fed Cu(HMTBa)2 were 6.0% heavier than pigs fed the NRC control or CuSO4 at the same level (p = 0.03, Table 5). During phase I (d 0 to 14), piglets fed Cu(HMTBa)2 gained 22.9% more weight (279 vs 227 g/d, p<0.01), ate 8.6% more feed (352 vs 324 g/d, p = 0.01), and had better feed conversion (0.79 vs 0.70, p = 0.05) than animals fed 170 mg/kg CuSO4. No difference was observed between pigs fed the NRC control (Cu, Mn, and Zn) and CuSO4 at EU maximum level. In phase II (d 14 to 42), no differences were observed among treatments (p> 0.17). Overall, piglets fed Cu(HMTBa)2 gained 9.0% more (p = 0.01) and tended to eat more feed (p = 0.09) than animals fed 170 mg/kg CuSO4. Feed conversion rate tended to be improved with Cu(HMTBa)2 supplementation compared with the other two treatments (p = 0.06).

Liver Cu was increased 2.7 times with 170 mg/kg CuSO4 supplementation compared with the NRC control, and was further increased with Cu(HMTBa)2 (4.5 times, p< 0.05, Table 6). No significant differences were observed on Cu deposition in tibia bone, kidney, muscle, and skin and fat (p>0.23).
Exp. 2
Pigs fed CuSO4 and Cu(HMTBa)2 tended to have better ADG (p = 0.08) and improved feed efficiency (p = 0.01) compared with the NRC control (Table 7). The Cu2(OH)3Cl was intermediate and did not differ from the NRC control. No difference was observed on feed intake among treatments (p = 0.81).

Liver Cu was significantly increased with Cu(HMTBa)2 compared with the control and Cu2(OH)3Cl while CuSO4 was intermediate (p = 0.01, Table 8). No difference was observed on liver Fe, Zn, and Mn concentration (p>0.27).

Exp. 3
Pigs fed 80 mg/kg Cu(HMTBa)2 tended to be heavier than those fed either the NRC control or 160 mg/kg CuSO4 at the end of experiment (p = 0.07, Table 9). Compared with the negative control, 160 mg/kg CuSO4 improved weight gain and feed intake during the phase (d 21 to 42) immediately after 21 days of depletion (p<0.05). No benefit of 160 mg/kg CuSO4 was observed during all other phases and overall. Due to variation in different phases, only overall effects of Cu(HMTBa)2 are discussed in this paper. Linear and quadratic dose response was observed on weight gain (p<0.01) and feed efficiency (p = 0.05) with Cu(HMTBa)2 supplementation with the best performance was observed at 80 mg/kg. Pigs fed 80 mg/kg Cu(HMTBa)2 tended to have improved weight gain (p = 0.07) and feed efficiency (p = 0.10) compared with those fed either the NRC control or 160 mg/kg Cu from CuSO4.

Pigs fed 80 mg/kg Cu(HMTBa)2 had the heaviest carcass weight, which was significant differ from those fed either the NRC control or CuSO4 at 160 mg/kg (p<0.01, Table 10). Linear dose response of Cu(HMTBa)2 was observed on loin depth with 55.73, 55.96, 56.64, 58.12, and 58.12 mm for the NRC control, and Cu(HMTBa)2 at 20, 40, 80, or 160 mg/kg, respectively (p = 0.04). Loin depth from pigs fed 80 mg/kg and 160 mg/kg Cu(HMTBa)2 were significantly greater than pigs fed 160 mg/kg CuSO4 and the NRC control. No treatment difference was observed on back fat, yield, and lean percentage (p>0.37). In summary, no benefit of 160 mg/kg CuSO4 was observed on carcass traits and BW. Growth performance, final carcass weight, and loin depth increased with increased Cu(HMTBa)2 supplementation with the best performance was observed with 80 mg/kg Cu(HMTBa)2.

DISCUSSION
High level of CuSO4 is typically used in the swine industry as growth promoter and its benefits on weight gain and feed efficiency have been well documented (Bunch et al., 1961;1963). Braude (1967) recorded 83 studies involving a total of 1,215 pigs in each treatment (0 vs 250 mg/kg) and reported that CuSO4 improved daily weight gain on average 8.1%, and feed efficiency on average 5.4%. The optimum dose of CuSO4 as growth promoter is around 242 mg/kg and 125 mg/kg of Cu was approximately 75% as effective (Cromwell et al., 1989). In agreement with previous studies, CuSO4 improved weight gain and feed efficiency in the current nursery studies. In addition, Cu(HMTBa)2 is more effective compared with CuSO4 as growth promoter in stimulating gain and feed efficiency in both nursery and finisher pigs. These results agree with Coffey et al. (1994) and Veum et al. (2004) that chelated Cu is more effective than CuSO4 and less is required to achieve similar performance. With limited Cu supplementation allowance in swine diets, using chelated Cu could be an alternative to pharmaceutical Cu to maintain growth promoting effects and reduce Cu excretion to the environment. The growth advantage of chelated Cu is perhaps due to the fact it is more available for absorption and less antagonism in the lumen as indicated by increased liver Cu storage and better antibacterial function.
It has been proposed that CuSO4 acts as an anti-bacterial agent by shifting the microbial population within the gastrointestinal tract (Apgar et al., 1995; Arias and Koutsos, 2006), by quantitatively modifying some gram-positive bacterial populations in the gut. Evidence that Cu produces a growth promoting effect possibly through the microbial gut flora is supported by Shurson et al. (1990), who observed a positive effect of high concentration (283 mg/kg) of Cu in the diet on daily growth rate and feed conversion rate in conventional pigs and a negative effect in germ-free pigs. On the other hand, similar growth-promoting effect was obtained when copper histidinate or histidine solution was administered by intravenous injection and thus bypassed the gastrointestinal tract (Zhou et al., 1994).
The authors suspect that injected extra Cu is secreted to the bile and back to the gastrointestinal tract, and has similar impact on bacteria population in the lumen as through dietary supplementation. If this is the case, dietary Cu needs to be absorbed first in order to be effective, which is the case in this study that Cu(HMTBa)2 was more effective than CuSO4 as growth promoter in both nursery and finisher pigs. Arnold (2011) reported that antimicrobial effects of bile determined by measuring the diameter of the zone of inhibition tended to be higher in Cu(HMTBa)2 treatments compared with CuSO4 at 75 mg/kg. However bile components, intestinal bacterial populations, and small intestine gene expression profiles associated with Cu absorption and homeostasis (Ctr-1, Atox-1, Cox-17, ATP7a, and ATP7b) were not affected. More research is needed to understand the effects of bile Cu recycle pathway on growth performance and antibacterial function.
Even though CuSO4 is widely used in the swine industry, there are negative effects of adding high CuSO4. CuSO4 is highly water soluble and hygroscopic, which drawing moisture to the surface of each crystal. In vitamin premix and diet, CuSO4 acts as a hot spot for reaction that break down labile organic compounds such as vitamins, enzymes, fat and oil (Dove and Ewan, 1991; Marchetti et al., 2000). In vivo, CuSO4 dissociates and generates free Cu in the stomach, which is very active pro-oxidative substrate and leads to lipid oxidation and cell damage (Ajuwon et al., 2011). Absorption of Cu by the stomach is much less than what takes place in the intestine and is further hindered by binding with phytic acid and forming insoluble compounds. Banks et al. (2004) reported that 250 mg/kg CuSO4 reduced apparent P retention 0.029 percentage-units in broilers, by forming an insoluble Cu-phytate chelate complex. The chelate is insoluble at the pH of the small intestine, and therefore none of the components of the complex are available for absorption. In addition, Cu competes with other trace minerals for absorption and utilization, such as Zn, Fe, and Mn. Hall et al. (1979) reported that a 20% decrease in 65Zn absorption occurred when dietary Cu was raised from 3 to 24 mg/kg in rats. One advantage of chelated mineral is that chelation between ligand(s) and mineral preventing mineral dissociation and complex with other nutrients and consequently avoiding antagonism with other nutrients in the lumen. Previous studies suggested that chelated minerals are more bioavailable and better at avoiding antagonism in vivo based on tissue mineral, gene expression, and functional assays compared with inorganic trace minerals (Richards et al., 2010; Zhao et al., 2010). Because of its higher availability, less Cu(HMTBa)2 can be used to replace high CuSO4 and have similar or better growth promoter effects in pigs. Our follow-up study indicated that pigs fed 50 mg/kg Cu(HMTBa)2 performed equally as pigs fed 250 mg/kg CuSO4 (Zhao et al., 2009). Similar results were reported in broilers that reduced level of chelated trace minerals can be used to replace inorganic trace mineral and have similar or even better performance (Zhao et al., 2010). Additional benefit of using chelated trace mineral is reduced mineral excretion to the environment (Managi et al., 2010).
Using high CuSO4 in grower-finisher pigs is less common and research results are controversial. Cromwell et al. (1978) reported 3% improvement of gain and feed efficiency with 250 mg/kg CuSO4 supplementation. No significant benefit of 250 mg/kg CuSO4 was observed by Gipp et al. (1973) and Dove and Ewan (1991). This is in agreement with the current study that the only benefit of 160 mg/kg CuSO4 was observed during the first 21 days immediately after a three-week depletion period. Interestingly, quadratic dose response was observed on growth performance, carcass weight, and loin depth with pigs fed 80 mg/kg Cu(HMTBa)2 had the best gain and the greatest loin depth. Mechanism of Cu(HMTBa)2 improved loin depth is not well understood. Zhou et al. (1994) suggested that Cu stimulated the growth of longissimus muscle more than the growth of the whole body, potentially through stimulating growth hormone secretion. The same authors also reported increased Cu concentration in the brain, which indicated that Cu may cross the blood-brain barrier and regulate hormone secretion. Similar results were reported by Myres and Bowland (1973), who observed that pigs fed high Cu diets had larger loin cross-sections than those receiving no supplemental Cu. Improved loin eye area suggests higher lean percentage and better carcass value. Further research is needed to better understand the effect of high Cu on improving loin muscle growth.
IMPLICATION
Cu(HMTBa)2 is more available based on performance and liver Cu concentration, so less Cu(HMTBa)2 is needed to have similar growth promoter effects as CuSO4 when fed to nursery pigs. For grower-finisher pigs, 80 mg/kg Cu(HMTBa)2 can be used as growth promoter and pigs fed Cu(HMTBa)2 had greater loin depth compared with 160 mg/kg CuSO4. By using less chelated Cu in pig diets, less Cu may be excreted to the environment although Cu concentration in feces was not analyzed in these trials.