Estimation of Effective Population Size in the Sapsaree: A Korean Native Dog (Canis familiaris)
Article information
Abstract
Effective population size (Ne) is an important measure to understand population structure and genetic variability in animal species. The objective of this study was to estimate Ne in Sapsaree dogs using the information of rate of inbreeding and genomic data that were obtained from pedigree and the Illumina CanineSNP20 (20K) and CanineHD (170K) beadchips, respectively. Three SNP panels, i.e. Sap134 (20K), Sap60 (170K), and Sap183 (the combined panel from the 20K and 170K), were used to genotype 134, 60, and 183 animal samples, respectively. The Ne estimates based on inbreeding rate ranged from 16 to 51 about five to 13 generations ago. With the use of SNP genotypes, two methods were applied for Ne estimation, i.e. pair-wise r2 values using a simple expectation of distance and r2 values under a non-linear regression with respective distances assuming a finite population size. The average pair-wise Ne estimates across generations using the pairs of SNPs that were located within 5 Mb in the Sap134, Sap60, and Sap183 panels, were 1,486, 1,025 and 1,293, respectively. Under the non-linear regression method, the average Ne estimates were 1,601, 528, and 1,129 for the respective panels. Also, the point estimates of past Ne at 5, 20, and 50 generations ago ranged between 64 to 75, 245 to 286, and 573 to 646, respectively, indicating a significant Ne reduction in the last several generations. These results suggest a strong necessity for minimizing inbreeding through the application of genomic selection or other breeding strategies to increase Ne, so as to maintain genetic variation and to avoid future bottlenecks in the Sapsaree population.
INTRODUCTION
Many dog breeds are originated and established by extensive selection from a small gene pool. During the selection process, some breeds are developed through population bottleneck causing loss in genetic diversity. The Sapsaree, an aboriginal Korean dog breed, also faced a severe bottleneck a few decades ago during Japanese colonization, while conservation and systematic breeding programs have been implemented since 1980.
Effective population size (Ne) is an useful criterion in classifying a breed population in view of degree of endangerment (FAO, 1998; Schwartz et al., 1998; Duchev et al., 2006), and a key parameter in conservation and population genetics (Gutierrez et al., 2008), because it is related to inbreeding, fitness, and loss of genetic variation through random genetic drift (Crow and Kimura, 1970; Falconer and Mackay, 1996).
Recently the use of inbreeding rate for Ne estimation has been replaced by molecular markers (Schwartz et al., 1998; Beaumont, 2003; Leberg, 2005; Wang, 2005), especially by high-throughput SNP panels. These genome-wide SNPs are expected to remarkably improve the reliability in estimating Ne (Nomura, 2009). Linkage disequilibrium (LD), i.e. non-random association of alleles between two SNP markers, is caused by the finite population size, mutation, migration, and selection (Lander and Schork, 1994) and is widely used in Ne estimation (Sved, 1971; Hill, 1981; Hayes et al., 2003). Also, LD between densely spaced SNP makers contains information about the historical population size (Hayes et al., 2003).
Herein, we investigated the population structure, extent of LD and effective population size (Ne) of the Sapsaree breed in the first such study of Korean aboriginal dog breeds.
MATERIALS AND METHODS
Animals, pedigree and genotypes
A total of 1,082 Sapsaree dogs with a pedigree size of 8,264 were generated (13 generations) between 1989 and 2009 at the Sapsaree Breeding Research Institute, Hayang, Gyeonsan, Korea. Among the individuals, 183 dogs were selected that were least genetically related to each other. The chosen Sapsarees were genotyped in two phases; a set of 134 Sapsarees with the Illumina CanineSNP20 (>22,000 SNPs) and a second set of 60 individuals, including the eleven dogs that were also genotyped using the CanineSNP20s, with the Illumina CanineHD BeadChip (>170,000 SNPs). The SNPs were genotyped according to the Illumina’s Infinium and Infinium HD Assay Protocols, respectively (Illumina Inc., USA). Both the chips contained evenly spaced and validated SNPs that were derived from CanFam2.0 assembly.
Inbreeding effective population size
Three reference animal sets with all pedigree, phenotypes or genotypes were used for analysis. The increase in inbreeding (ΔF) for each animal was calculated using the formulae
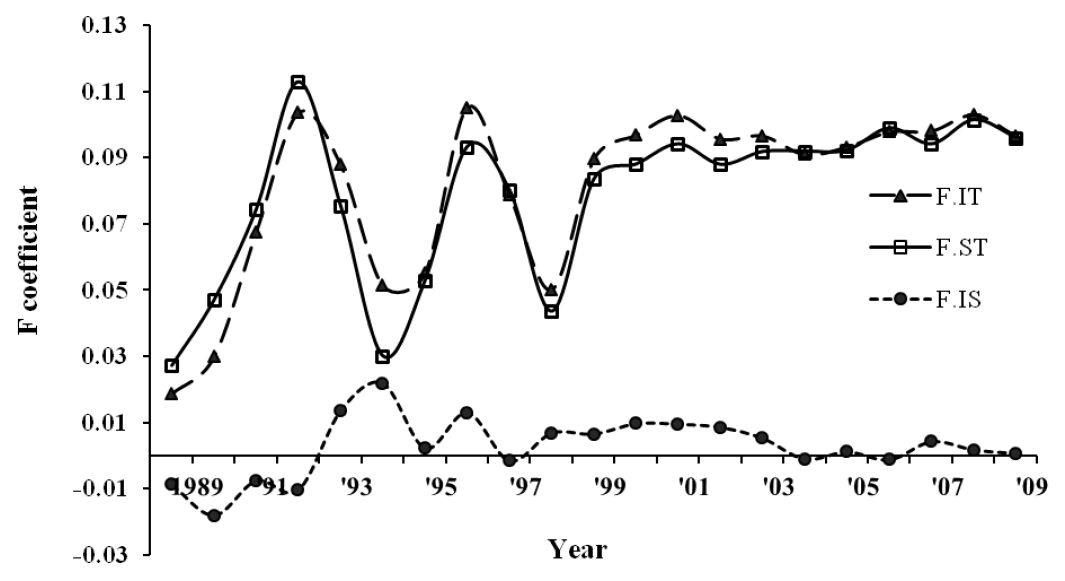
FIT, FST and FIS were also obtained for each group of individuals with the same birth year. FIT is an average inbreeding measure of the group, FST is an expected value of inbreeding under random mating, and FIS measures the deviation from randomness in the actual breeding. When FIS >0, the actual inbreeding (FIT) exceeds the level expected under random mating (FST), implying that mating among genetically related parents happens more often, or that the population is partitioned into subpopulations and mating is restricted within each subpopulation. In contrast, in the population with FIS<0, avoidance of inbreeding or mating between subpopulations is carried out predominantly. The statistic FIS = (FIT−FST)/(1−FST) was described in Wright (1969).
Effective population size from SNP genotypes
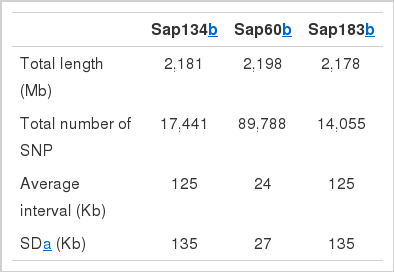
Three sets of Sapsarees were genotyped with the SNP panels of 20K (Sap134), 170K (Sap60), and the combined SNP set of 20K and 170K (Sap183) using 134, 60, and 183 individuals, respectively. Among the SNPs in the SNP panels that were located on autosomal chromosomes, those with minor allele frequencies less than 0.05 and Hardy-Weinberg equilibrium test statistics, x2>10.83 (corresponding p<0.001) were deleted (Table 1). From the pairwise haplotype frequencies between each pair of markers, e.g. A and B, each with two alleles, e.g. 1 and 2, (Falconer and MacKay, 1996), the D value (one measure of linkage disequilibrium, LD) was calculated from
Past effective population size from SNP genotype
The past effective population sizes were observed from LD values assuming that the population had a linear growth and using
Where,
RESULTS
Pedigree completeness (PEC), rate of inbreeding and effective population size from pedigree
Three reference animal sets, i.e. with all pedigree, phenotypes, and genotypes, revealed average PEC index values of 0.80, 0.65 and 0.73, respectively, assuming that five ancestral generations contributed to pedigree completeness. An average of five equivalent complete generations was traced in the pedigree with a maximum of 8 generations by 2009. The average inbreeding coefficient was 0.10 with an increasing rate of inbreeding per generation (Figure 1), which stabilized in the last few generations. Actual inbreeding (FIT) surpassed the expectation under random mating (FST) in several generations.
Overall, the average inbreeding Ne ranged from 16 to 19, 34 to 39, and 36 to 51 using PEC index at 5, 10 and 13 generations, respectively (Table 2). In general, the Ne estimates were consistent between different PEC limits, and greater Ne values were estimated as the PEC generation index increased, partly due to the inclusion of earlier generations in which the individuals including founders had a lower inbreeding rate (Figure 2).

Average effective population size (Ne) of Sapsaree based on reference animals with different pedigree completeness (PEC) generations and limits
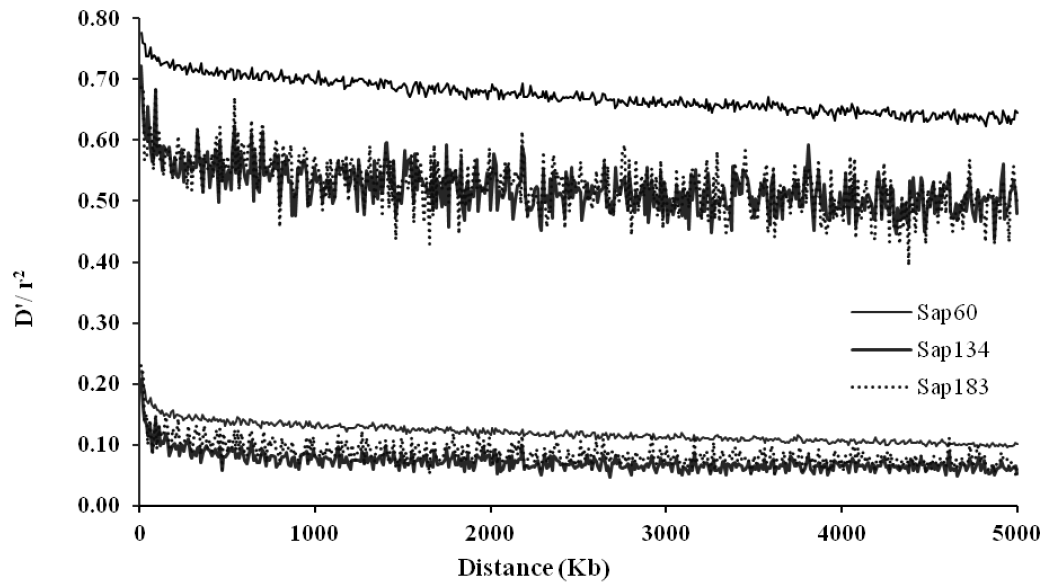
Average linkage disequilibrium (LD) over all autosomal chromosomes within 5 Mb distances between the pairs of SNPs for Sapsaree dogs. The upper and lower 3 lines correspond to D′ and r2 measures for the three samples (Sap134, Sap60 and Sap183), in which the SNP panels of 20K, 170K, and the combined SNP set of 20K and 170K were used using 134, 60, and 183 individuals, respectively.
Linkage disequilibrium, recent and past effective population sizes from SNP
The average r2 estimates were 0.12 and 0.07 when the pairs of SNPs were located within 100 Kb and 5 Mb, respectively, with the Sap134 panels in which 22K SNPs were embedded. When the Sap60 panels with 170K SNPs were applied, the average r2 estimates were 0.16 and 0.10, within the respective distances (Table 3). Because map density between flanking SNPs in the latter panels was higher (Table 1), the LDs values were greater than when the Sap134 panels were used. The greatest r2 values were observed on canine chromosome (CFA) 37, i.e. 0.15 and 0.21 for the pairs of SNPs within 100 Kb in the Sap134 and Sap60 panels, respectively. The distribution of the D′ estimates had similar tendency as for the r2 values (Table 3). Figure 2 displayed LD profiles along the distances between the pairs of SNPs, showing that LD was greatest when the pairs of SNPs were very closely located, and decreased with the increasing distances between the pairs of SNPs.

Linkage disequilibrium (LD) measures in autosomal chromosomes using pairs of SNPs that are distanced within 100 Kb and 5 Mb
The Ne estimates were 1,486, 1,025, and 1,293 from the pair-wise method, and 1,601, 528, and 1,129 from the non-linear method using Sap134, Sap60 and Sap183 panel, respectively, within a 5 Mb distance (Table 4). Strong positive correlations on the Ne estimates from the non-linear approach were observed between the data sets (Sap134, Sap60 and Sap183 panels), i.e. the correlation coefficients ranged between 0.41 and 0.65 (Figure 3).

Estimates of effective population size (Ne) using different sets of SNP panels that were estimated using r2 with the pairs of SNPs that are distanced within 5 Mb
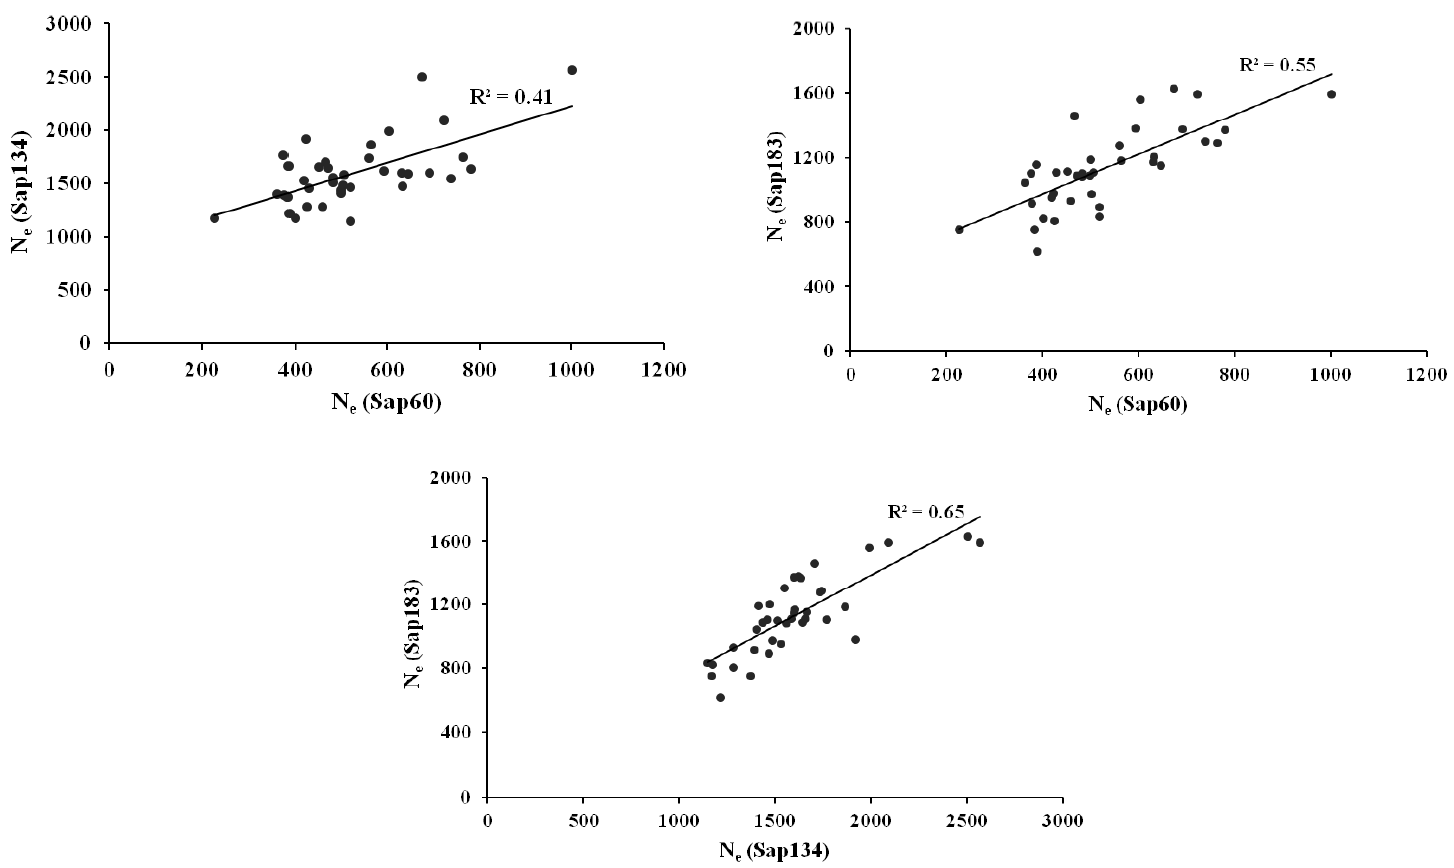
Correlations between the non-linear Ne estimates from the Sap134, Sap60 and Sap183 panels for the pairs of SNPs that were distanced within 5Mb.
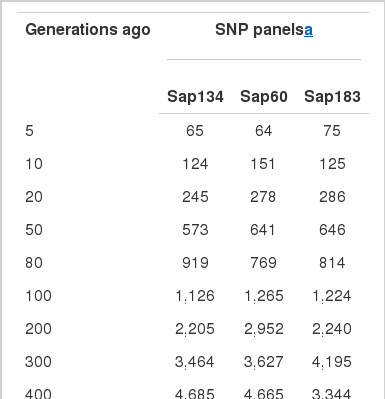
The past Ne estimates ranged between 5,381 and 5,699 about five hundred generations ago, reducing to 1,126 to 1,265 about 100 generations ago. Since then, Ne continued to decrease to 64 to 75 about five generations ago, indicating a faster drop during the last ten generations (Figure 4, Table 5). The Sap60 panel showed a pattern of constant reduction in the past Ne estimates, probably due to the contribution of more SNPs at closer distances than the lower density panels (Sap134 and Sap183), which produced a weighted average at certain generations despite a lowest chromosome sample size.
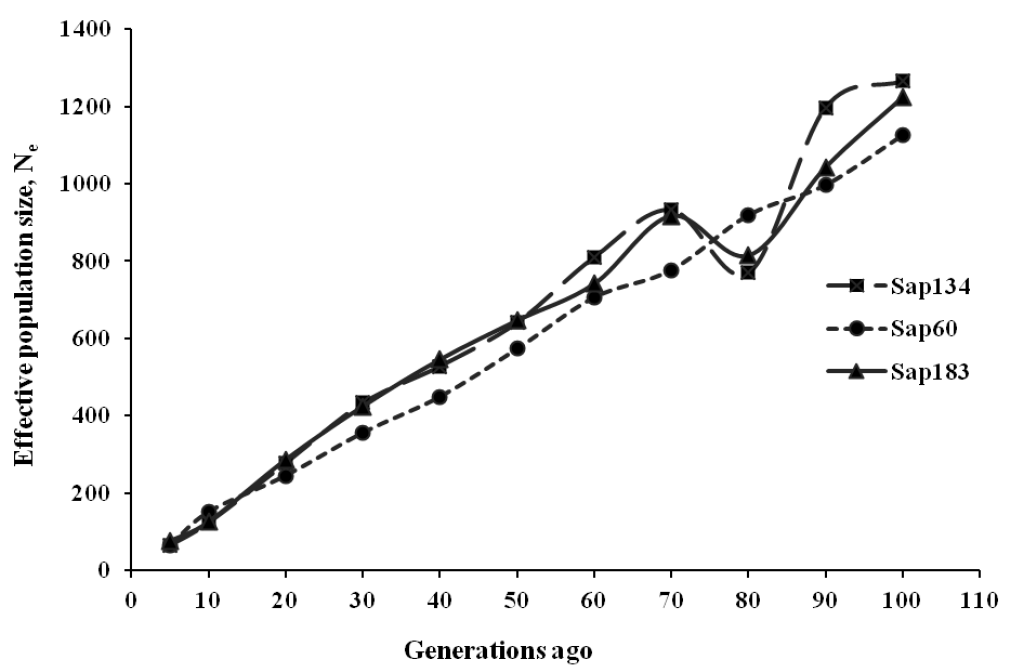
Estimates of effective population size (Ne) for Sapsaree at t ancestral generations ago based on the squared correlation coefficient (r2) between SNPs. Three SNP panels (Sap134, Sap60 and Sap183) were used, in which 20K, 170K, and the combined set of 20K and 170K SNPs were genotyped with 134, 60, and 183 individuals, respectively.
DISCUSSION
In this study, we applied various density panels of SNP to determine overall, current and past effective population sizes in order to investigate rates of genetic erosion, fixation of deleterious alleles and inbreeding (Wright, 1969). The past Ne estimates, e.g. 64 to 75 about five generations ago, were in accordance with Calboli et al. (2008), in which the Ne was estimated between 17 and 76 in multiple breeds such as Greyhound, Rough Collie, Akita Inu, Boxer, English bulldog, Chow chow, Golden retriever, English springer spaniel and German shepherds. However, these breeds had lower inbreeding rates (0.024 to 0.073) than in the Sapsaree breed (Figure 1). Likewise, the wolves as dog’s early ancestors, had lower effective population sizes, e.g. the Italian wolves with Nes ranging 30 to 50 since last century (Randi et al., 2000) or the Finnish wolf with the current Ne of 40 (Aspi et al., 2006).
It is known that the extent of LD in dogs was greater than in cattle and humans (Lindblad-Toh et al., 2005; Tenesa et al., 2007). Sutter et al. (2004) reported that LDs in dogs extended even up to 100 times higher than in humans, e.g. in Akita, Bernese mountain dog, Golden retriever, Labrador retriever, and Pekingese. Lou et al. (2003) observed extensive LDs within certain chromosomal distances (5 to 10 cM), and we also found strong LDs in Sapsaree (Figure 2).
The noticeable expansion of LD in dogs may reflect a narrow bottleneck in their domestication history (Ostrander and Kruglyak, 2000), and the LD at long distances reflects a more recent population history and vice versa (Hayes et al., 2003). The tight population bottleneck history in Akita and Bernese mountain dogs was followed by a large reduction in Ne (Rogers and Brace, 1995; Wilcox and Walkowicz, 1995; AKC, 1998) and reflects a long extented LD (Sutter et al., 2004). This result is consistent with the Sapsaree population history, in which significant reduction of the population size occurred during Japanese colonization of Korea more than half a century ago, wherein the breed reached extinction and was re-established about 30 years ago (Han et al., 2010). Moreover, the past Ne with significant reduction of the size in recent generations may cause an increasing inbreeding rate in the Sapsaree individuals of the current generation (Figure 1).
In the non-linear analyses, sampling errors were corrected to get unbiased r2 estimates with the consideration of a chromosome sample size (Weir and Hill, 1980). Perhaps, putting restrictions over r2 measures to avoid complexity in computation might lead some biases in estimates and, especially for the different platforms (i.e. dog breeds) in the high-throughput SNP panels, in which wrong marker order or the relative distances between the markers are a primary concern, even though the biases may be diluted by the large numbers of SNP pairs. Another factor of biased r2 estimates is recombination hot-spots on the test chromosomes, causing overestimated Ne if the genetic distance was estimated to be smaller or greater. Thus, more reliability in estimating Ne requires least biased estimates of genetic distances between SNPs. However, the small sample size in the study may be sufficient to obtain precise Ne estimates. According to Bartley et al. (1992), a sample size over 90 yielded genetic estimates with good precision. In this study, three SNP panels with different map densities and sample sizes were applied (Table 1), and the past Ne estimates were in general consistent across the three SNP panels (Table 5).
A reduction in the effective population size happens during domestication, breed formation, or artificial breeding. For example, the Ne was estimated as 20 in Japanese black cattle in 1990s (Nomura et al., 2001), 100 in Holstein cattle (Young and Seykora, 1996), 55 in Finnish Yorkshire pig, and 80 in Finnish Landrace (Uimari and Tapio, 2011). The lower genetic diversity caused by the small Ne is a great concern for animal breeders regarding species viability and genetic disorders. A minimum Ne size of 50 or 100 needs to be maintained in a population, breed, or species (FAO, 2000; Meuwissen, 2009).
In Sapsaree, the increasing inbreeding rate due to a small number of founders at the re-establishing stage may have caused a low Ne despite the rapid increase of the population in the last few decades. Although the breeding programs focused on conforming to a breed standard, controlled inbreeding is a priority in maintaining the population, especially in the Sapsaree breed, in which a few founders were used to form the breed population. A long-term genetic variability is also needed for future genetic gain in the breeding plans. Therefore, appropriate selection methods have to be chosen to maximize selection responses while fixing or minimizing rate of inbreeding (Meuwissen, 1997; Colleau and Tribout, 2008) or to optimize the use of the genetic resources of parental generation (Sanchez et al., 2003). Genomic selection (Meuwissen et al., 2001) can be an alternative method in the Sapsaree breeding plans to estimate genomic breeding values (GEBV), which enables rate of inbreeding to decrease, compared with current BLUP-based BV estimation (Daetwyler et al., 2007).
In conclusion, our results revealed small effective population sizes of the Sapsaree breed in the last few generations. Therefore, while the breeding programs are implemented for body shape, morphology, and behavior toward the breed standards genetic variability which was ignored during the last several decades due to the fast process of the breed re-establishment must now be considered to further avoid inbreeding. For efficient implementation of the breeding program in the Sapsaree population, genomic selections can be an effective tool to increase genetic gains for the target traits, while selecting parents with least genetic relatedness to produce progeny in the successive generations.
ACKNOWLEDGEMENTS
This research was supported by the Yeungnam University research grants in 2008.
