The Influence of Dietary Calcium and Phosphorus Imbalance on Intestinal NaPi-IIb and Calbindin mRNA Expression and Tibia Parameters of Broilers
Article information
Abstract
A 2×2 factorial experiment was conducted to study the effect of dietary calcium and non-phytate phosphorus (nPP) imbalance on calbindin and NaPi-IIb mRNA levels in the small intestine and tibia parameters of broiler chicks. One hundred and forty four 1-d-old Arbor Acres male broiler chicks were divided into four treatments consisted of six replicates with six chicks each. The two dietary calcium levels were 1.10% and 0.60%, and two dietary nPP levels were 0.50% and 0.27%. Results showed that a high Ca/nPP ratio diet (4.07:1) significantly depressed feed intake and weight gain of broilers (p<0.05), but a lower Ca:nPP ratio (1.2:1) had no influence (p>0.05). Low-Ca with low-P diet resulted in low tibia minerals and tibia breaking strength of broilers, and all the tibia parameters were further decreased when the dietary ratio of Ca to P was relative higher. Low dietary Ca or P up-regulated the calbindin and NaPi-IIb mRNA expression levels. Low Ca with normal P diet up-regulated duodenal calbindin mRNA expression level to the greatest extent. Low P with a normal Ca diet significantly enhanced NaPi-IIb mRNA expression level to the highest extent. These results suggest that the calbindin and NaPi-IIb mRNA expression were enhanced by the imbalance between dietary Ca and nPP, and their expression were not only influenced by Ca or nPP level, but also the ratio of Ca:nPP.
INTRODUCTION
The general nutritional interrelationships between calcium and phosphorus have been well recognized. Calcium and phosphorus deposit in the organic matrix in the form of crystal hydroxyapatite during the mineralization process and give the bone strength (Berner and Shike, 1988). The deficiencies in content or improper ratio of these two minerals usually hinder bone growth and lead to greater incidences of leg abnormalities (Xie et al., 2009).
Numerous studies reported that dietary phosphorus deprivation is an important stimulating factor of intestinal phosphate uptake as indicated by the kinetic parameters (Vmax) of absorption, abundance of membrane-bound NaPi-IIb cotransporter protein and NaPi-IIb mRNA expression (Katai et al., 1999; Radanovic et al., 2005). Calcium and phosphorus have been proved to have interrelationships in the animal intestine (Hurwitz and Bar, 1971). Phosphorus utilization and renal sodium-phosphorus co-transporter gene expression could be affected by dietary true digestible calcium and phosphorus ratio in post-weaned pigs (Wang et al., 2008). Whereas, fewer studies have considered dietary calcium level and Ca:P ratio in phosphorus absorption relating transporter in the intestine. Increasing Ca concentration in chick diets had a large effect on P absorption (Al-Masri, 1995). Whereas, a study in pigs indicated that sodium-dependent phosphate uptake in the jejunum stimulated by a low-phosphorus diet was independent of dietary calcium concentration (Saddoris et al., 2010). Calbindin-D28k could act as a Ca2+ buffer in Ca2+-transporting epithelia (Lambers, 2006), and calbindin in chicks intestine expressed differently between divergently selected strains for high or low tibial dyschondroplasia (TD) (Shirley, 2003). An imbalance of dietary Ca and P was one of the factors that induced TD. Therefore, the aim of the following experiment was to determine whether Ca level and Ca:nPP ratios in diets affects intestinal phosphate and calcium transport in broiler chicks as indicated by NaPi-IIb and calbindin mRNA expression.
MATERIALS AND METHODS
Animals and treatments
The present study was approved and carried out in accordance with the Guidelines for Experimental Animal Welfare of China Agricultural University.
One hundred and forty four one-d old male Arbor Acres broiler chicks (initial body weight was 40±0.5 g) were randomly assigned to four dietary treatments (Table 1) and fed for 21 d. Each treatment consisted of six replicate pens with six broilers in each pen. Dietary treatments consisted of: i) low Ca-low P diet (0.60% Ca and 0.27% nPP); ii) low Ca-adequate P diet (0.60% Ca and 0.50% nPP); iii) adequate Ca-low P diet (1.10% Ca and 0.27% nPP); iv) control diet (1.10% Ca and 0.50% nPP), the Ca:nPP ratios were 2.22, 1.20, 4.07 and 2.20, respectively. Diets were formulated on an nPP basis instead of a total P basis (NY/T 33-2004) using Jinmu feed formula software (edition: VF123, 2009). Chicks were raised in battery cages, and each pen was equipped with an individual feeder and water supply. All birds were allowed to consume mashed feed and tap water ad libitum in an environmentally controlled room. The temperature was kept at 34°C from 1 to 3 d of age, and was gradually reduced to 22°C by 21 d of age. The relative humidity was maintained at 60 to 65% throughout the period of the experiment.
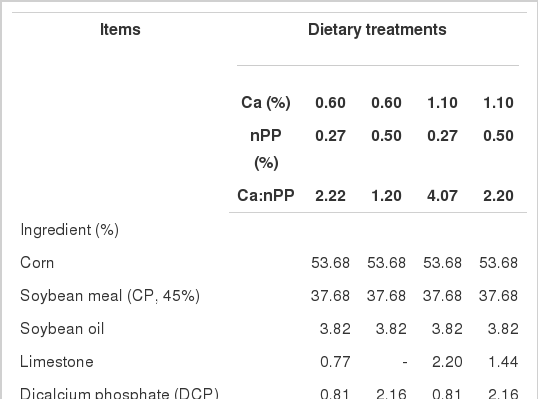
Composition of experimental diets
Measurements
Growth performance
At 21 d of age, body weight of chickens and the remaining feed in the trough of each replicate cage were weighed after 4 h of feed withdrawal. Live body weight, feed intake and feed conversion ratio (FCR) were calculated. The average initial body weight was 40±0.5 g. All pens were checked daily for deaths.
Tissue sampling and preparation
At the end of the trial (21 d of age), one bird per cage was randomly selected and killed by cervical dislocation. The duodenum segment (from distal of the gizzard to 1 cm distal of the bile duct) was isolated immediately from the gastrointestinal tract. The digesta was thoroughly washed out of the duodenum with a cold 1‰ diethylpyrocarbonate-treated water and duodenal mucosa was scraped off on ice with a glass microscope slide and frozen in liquid nitrogen quickly for later determining RNA expression. The left and right tibias from individual birds were excised, sealed in plastic bags, and stored at −30°C for further analysis (Wang et al., 2010).
Total RNA extraction, reverse transcription, and real-time PCR
Total RNA was extracted from the duodenal mucosa of 21 d-old broilers with Promega Corporation products according to SV Total RNA Isolation System instructions (Z3100, Promega Corp.), and re-suspended in diethylpyrocarbonate-treated water. The concentration and quality of the RNA were determined by measuring the absorbance at 260 nm and by agarose gel electrohoresis, respectively (Li et al., 2011).
After extraction, 1.0 μg of total RNA was made into single-stranded cDNA with AMV Reverse Transcriptase using an Oligo (dT)15 primer in the presence of Recombinant RNasin Ribonuclease Inhibitor (A3500, Promega Corp.).
Real-time PCR of NaPi-IIb and calbindin mRNA was performed with β-actin as internal control standard. The primers used and PCR product lengths are depicted in Table 2. Real-time PCR was conducted on an ABI 7500 fluorescent quantitative PCR system using the RealSuper Mixture with Rox (CW0767, Cwbio. Co. Ltd.). Briefly, the protocol used was as follows: 95°C for 4 min; 40 cycles of 95°C for 15 s, 60°C for 60 s; and 60–95°C for melting curve analysis. Each gene was amplified in triplicate. Standard curves were also run to determine the efficiency of amplification. The relative standard curve methods were used for quantification of gene expression. The results were expressed as the target gene mRNA to β-actin mRNA ratio (Han et al., 2009).
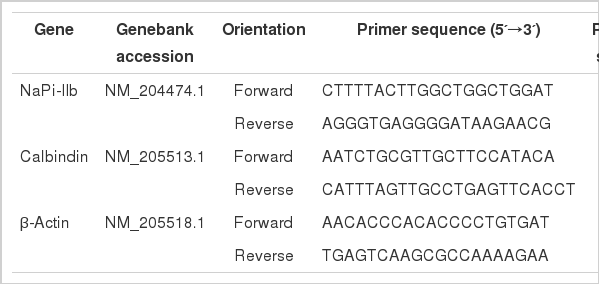
Oligonucleotide PCR primers
Tibia strength, tibia ash, Ca and P concentration
The left tibia was de-fleshed by hand and the patella was removed. They were then air dried for 24 h at room temperature and defatted for bone ash, Ca and P determination. Dry-defatted tibias were ashed in a muffle furnace at 550°C for 16 h and tibia ash was measured based on the percentage of dry weight. Ca and P content were determined by EDTA titration and ammonium metavanadate colorimetric method respectively, and both were presented on the dry-defatted weight basis (Wang et al., 2010). The right tibia was directly defleshed and patella removed, the fresh bone breaking strength was determined using WDS-1 electric universal testing machine by three-point bending test of metaphyseal tibia with 30 mm supporting distance and 10 mm/min test speed.
Statistical analysis
The experimental design was a 2×2 factorial and the main effects of P, Ca and the P×Ca interaction were analyzed using the GLM procedure in SPSS 16.0. Replicate means were served as the experimental unit for statistical analysis. Differences were considered significant at p<0.05, and trends were considered at p<0.10. All data are reported as means.
RESULTS AND DISCUSSION
Growth performance
The effects of dietary calcium and non-phytate phosphorus on growth performance of broilers are shown in Table 3. Initial body weight of broiler was 40±0.5 g. The main effects of Ca and nPP levels were significant for weight gain and feed intake (p<0.001). Weight gain and feed intake of broilers were significantly lower in the 0.27% nPP diet group than 0.50% nPP group, which indicated that a deficiency did exist in broilers fed 0.27% nPP level. Feed intake was adversely affected by relative high calcium levels. Ca or P had no significant effect on the feed conversion ratio (p>0.05). This phenomenon was also found by Ayasan and Okan (1999). Ca level and nPP level had a significant interaction on growth performance. It seems neither feed intake nor weight gain were affected when birds were fed a diet with low Ca: nPP, but when the ratio was beyond certain threshold (eg. 4.1), both feed intake and weight gain decreased significantly. A wide Ca: nPP (2.86:1) ratio induced by high dietary calcium could disturb phosphorus metabolism in broilers and suppress the growth performance (Ding et al., 1994). We concluded that the growth performance of broilers was only sensitive to high Ca:nPP ratio but not low Ca:nPP ratio.

Growth performance of broilers as influenced by different levels of Ca and P
Tibia mineral composition and breaking strength
Mineral composition and breaking strength of tibia in broilers fed different dietary Ca and non-phytate P levels are shown in Table 4. Tibia parameters of broilers were affected by any changes of dietary Ca or nPP level or Ca/P ratio in diet. Any reduction of Ca or nPP level in diet could alter blood acid-base balance, decrease oxygen transport efficiency and metabolism of cartilage collagen, which could lead to tibia dyschondroplasia (TD) and then low body weight gain (Wang et al., 1999).
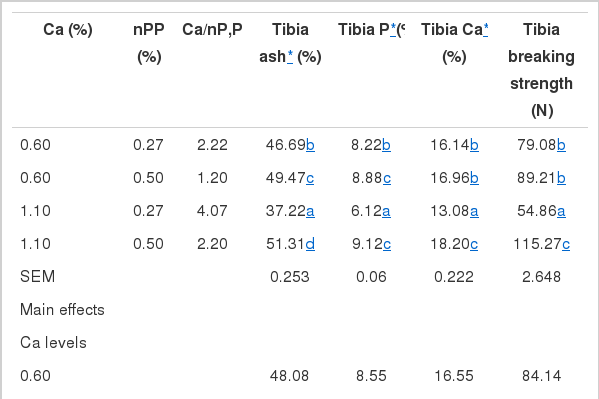
Mineral composition and breaking strength of broiler tibia influenced by different dietary levels of Ca and P
Significant interactions between dietary Ca and non-phytate P were found in tibia mineral composition and breaking strength (p<0.001). Low dietary non-phytate p significantly decreased those tibia parameters, which were much lower in broilers fed with normal Ca (Ca:nPP = 4.1) than in ones fed with low Ca diet (Ca:nPP = 2.2). Heaney and Nordin (2002) also suggested that an increase in calcium intake without a corresponding increase in dietary phosphorus could increase the risk of phosphorus insufficiency as compared with low-Ca and low-P diet. The relative high Ca:nPP ratio might form insoluble tricalcium phosphate in the intestinal tract, which was excreted out without utilization and contributed to bone loss (Heaney and Nordin, 2002). In groups fed normal dietary P, low dietary Ca (Ca:nPP = 1.2) did not affect tibia P content, but significantly decreased tibia ash, Ca and breaking strength in broilers.
In groups fed with low dietary Ca, low P diet (Ca:nPP = 2.2) decreased ash and P content of tibia of broilers, and relative high dietary P (normal level) could reduce such decline degree, whereas, tibia Ca and breaking strength were not significantly affected. These results were consistent with results reported by Wang et al. (2010) to some extent, who suggested that tibia strength was significantly decreased when broilers from 1 to 3 weeks of age were fed diets with high calcium (1.5%), low calcium (0.6%) and low phosphorus (0.35%) but not high phosphorus (0.65%).
Duodenal phosphorus and calcium transporter mRNA expression
Duodenal NaPi-IIb and CaBP mRNA levels are shown in Table 5. Masuyama et al. (2003) suggested the Ca/P ratio-dependent calcium and phosphorus transport and the effect of Ca/P ratio on bone mineralization was achieved by affecting the intestinal calcium and phosphorus transports. The Na+-Pi cotransporter NaPi-IIb is the only known protein that mediates Pi transport through the apical membrane of the intestinal epithelial cells (Hilfiker et al., 1998). Low phosphorus intake was an important stimulating factor, and intestinal phosphorus transport was dependent on the NaPi-IIb protein abundance and NaPi-IIb mRNA level (Radanovic et al., 2005). In the present study, low levels of dietary Ca or P up-regulated calbindin and the NaPi-IIb mRNA expression level. Armbrecht, et al. (2003) also reported that restricting dietary Ca and P to more than 50% of the requirement stimulated calbindin expression of rat intestine. This stimulation might be the result of a compensatory increase of 1,25(OH)2D3 and 1α-hydroxylase activity in chick kidney when fed a low-Ca or low-P diet (Blahos et al., 1987).

Duodenal NaPi-IIb and calbindin mRNA expression levels as affected by different dietary levels of Ca and P
Dietary Ca and nPP levels had significant interactions on NaPi-IIb and calbindin mRNA expression levels (p< 0.001). In groups fed normal dietary P, low dietary Ca up-regulated NaPi-IIb and calbindin mRNA expression levels compared with normal dietary Ca groups, with the calbindin mRNA being expressed at a higher level than in any other group. Low dietary P significantly enhanced NaPi-IIb mRNA expression levels especially at the normal dietary Ca level. The excess Ca relative to phosphorus level in a diet could bind the dietary P to form insoluble tricalcium phosphate in the intestinal tract (Heaney and Nordin, 2002). The quantitative nutritional relationships between calcium and phosphorus occur due to the chemical association in the intestinal lumen rather than from the interaction at the absorption site (Hurwitz and Bar, 1971). Consequently, relatively high calcium could decrease the inorganic phosphorus content in the intestine which enhances duodenal NaPi-IIb mRNA expression.
In groups fed normal dietary Ca, low dietary P also up-regulated NaPi-IIb and calbindin mRNA expression levels compared with normal dietary P groups, with NaPi-IIb mRNA level showed the highest degree. Low dietary Ca enhanced calbindin mRNA expression, which was much higher in normal dietary P groups than in low dietary P ones. Intestinal pH has been found to be in inverse proportion to phosphate concentration, and in proportion to Ca2+ concentration (Cheng et al., 1993). Phosphate transport across the small intestine brush border membrane vesicles of broilers had higher efficiency under base-pH than acid-pH (Quamme et al., 1985; Danisi and Murer, 1991). This might be another reason that intestinal NaPi-IIb mRNA was expressed at the highest level in chicks fed with adequate Ca-low P diet. Inversely, calbindin D (28 k) expression interacted with the target in a H+-dependent manner (Berggard et al., 2000), which may be the reason that intestinal calbindin mRNA was expressed at the highest level in chicks fed with an adequate P-low Ca diet.
In conclusion, a relative high dietary calcium to phosphorus ratio was detrimental to chick growth. The imbalance of dietary calcium and phosphorus could decrease tibia parameters such as calcium and phosphorus content, and stimulate the mRNA expression level of calbindin and NaPi-IIb in small intestine of broilers.
ACKNOWLEDGEMENTS
This study was financially supported by the earmarked fund for Modern Agro-Industry Technology Research System.