The Long Term Effects of Fairly Low-level of Supplemental Fat on the Productive Performance of Commercial Layers
Article information
Abstract
Laying hens were fed commercial diets added with supplemented fat (SFAT) at 0.6, 1.2, and 1.8% in order to study the long term dietary effects - on - their productive performance from 22 to 75 wk of age. Five hundred and seventy six Single Comb White Leghorn hens were assigned to one of the four dietary treatments. The experimental phase consisted of three periods of 18 wk each. The final body weight and gain of hens fed on diets with SFAT at 1.2% and 1.8% were lower (p<0.05) than those hens given no SFAT. The SFAT at the 1.2% and 1.8% levels improved egg production rate, egg weight and mass, as well as FCR. Mortality and feed consumption were not affected by dietary SFAT. Administration of a diet with SFAT significantly decreased the cracked-broken egg ratio (p<0.01). The beneficial effects of SFAT on egg production performance were particularly more pronounced at intermediate and later ages. Hence, SFAT by period interactions were significant for all traits studied except feed intake. Hens fed SFAT deposited significantly higher abdominal fat than those on the no-SFAT diet. As a result, SFAT at 1.2% and 1.8% inclusion levels provided benefits in terms of efficient table egg production.
INTRODUCTION
Dietary addition of fats and oils has been the most practical method of increasing energy density of poultry diets. Supplemented fat (SFAT) as animal origin (i.e. fish oil, tallow, lard, poultry fat) are common feed ingredients for supplemental fats in layer hens and proved beneficial for productive performance, including egg production rate, feed conversion efficiency and egg weight (Scragg et al., 1987; Sell et al., 1987; Grobas et al., 1999).
Beneficial effect of linoleic acid on egg weight in laying hen nutrition has been long known. There is a good bulk of evidence reporting that increased dietary linoleic acid content improves egg weight in leghorn hens (Shutze and Lesson, 1963; Whitehead, 1981; March and MacMillan, 1990). Previous research showed also that SFAT exerts a favorable effect on egg weight beyond that attributable to an increase in linoleic acid concentration (Sell et al., 1987; Keshavarz, 1995; Grobas et al., 1999).
In order to investigate the metabolic effects of SFAT in diets for laying hens, fats including fish oil (FO) were included into diets at extremely high levels up to 6% in many cases. For this purpose, experimental laying hen diets were intentionally formulated on wheat, exceeding 600 kg, so as to maximize the dietary fat level (Grobas et al., 1999; Baucells et al., 2000). This is because wheat contains fewer metabolic energy by 10% as compared to that of corn, hence, more SFAT was included into wheat based laying hen diets to meet the dietary energy level as recommended by the breeder. However, in standard practical layer hen diets based on corn and soybean meal, it is not necessary to incorporate such extremely high fat levels in order to fulfill the energy requirements, since the energy was mainly provided by the corn (da Silva et al., 2005). Nevertheless, to date a limited amount of scientific experiments have been conducted to evaluate the relationship between layer hen age and the fairly low-level of dietary fat supplementation with regard to performance when hens are fed corn-soybean based diets. Therefore, this study evaluated the influence of fish oil (FO) as an SFAT at three levels of inclusion on the productive performance of laying hens over whole laying cycle.
MATERIALS AND METHODS
Five hundred and seventy six 19-week-old Single Comb White Leghorn pullets (Nick Chick) were obtained for this study. Hens were caged three to a pen that was 45×40×50 cm in size, and assigned to one of four dietary treatments. Each treatment consisted of six replications of eight cages. Hens were placed in a curtain-sided open house with natural ventilation in which the temperature ranged from 10°C to 32°C depending on natural seasonal variations. A photoperiod of 16 h/d was established. Experimental periods I, II, and III corresponded to ages 22 to 39 wks, 40 to 57 wks, and 58 to 75 wks, respectively. Hence, a whole production cycle consisted of 3×18-wk periods.
A corn-soybean based diet with no added SFAT was used as control, and basal diets supplemented with FO (anchovy) at 0.6%, 1.2%, and 1.8% were fed to hens throughout the experimental period. The diets were gradually introduced to hens between 19 to 22 wks of age. Mash diets and water were provided for ad libitum. The SFATs were stored in plastic barrels in 200 kg amounts throughout the experimental period. A 0.5 g/kg antioxidant combination was added to the SFAT at the commencement of the study. The antioxidant combination provided the following: BHA (7.5 mg/g fat), ethoxyquine (40 mg/g fat), BHT (90 mg/g fat), and citric acid (30 mg/g fat).
All birds were weighed individually at 22 and 75 wks of age. Egg production rate (% hen-d) and the cracked-to-broken egg ratio (%) were recorded on a daily basis determining on a replicate basis throughout the experiment. Seventy-two eggs (six eggs per replicate) that were not deformed, excessively small or large, or double-yolked for each treatment were randomly selected and collected on two consecutive days each week and weighed individually. Mortality was determined as percentage mortality for the overall duration of the trial. Egg mass output was calculated by multiplying the percentage of hen-day egg production by the average egg weight in grams. Feed intake (g/bird/d) was measured for each week and calculated as a mean for each replicate. The feed conversion ratio (FCR) was described as kg of feed consumption per kg egg mass. The magnitude of production variables, such as feed intake and egg production, were adjusted for hen mortalities.
At the end of the study, twelve hens from each treatment were randomly selected based on the average body weight within the treatment. Sampled hens were electrically stunned, and slaughtered. The liver and abdominal fat pad were carefully excised and weighed.
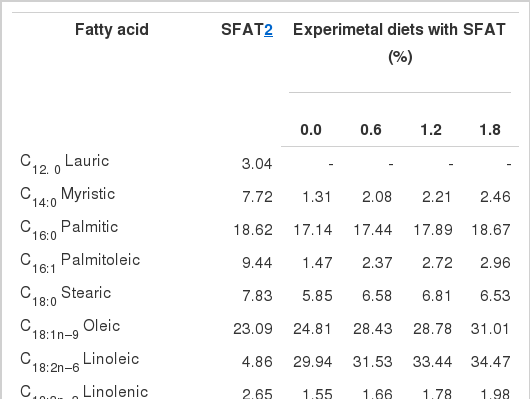
The fatty acid profiles for the SFAT and the experimental diets (Table 1) were determined according to the method from the Association of Analytical Chemists (AOAC, 1990) using a 50×0.25 mm (inside diameter) WCOT fused silica CP-Sil 88 capillary column installed on a Hewlett Packard 5890 gas liquid chromatography with flame ionization detector.
The composition and chemical analyses of the diets are presented in Table 2. The nutrient content of diets was determined by proximate analysis (Naumann and Bassler, 1993). The experimental diets were analyzed for starch, sugar, total calcium (Ca) and phosphorus (P) according to the VDLUFA method (Naumann and Bassler, 1993). The metabolizable energy content of the diets was calculated based on the chemical composition of the diet (Anonymous, 1991).
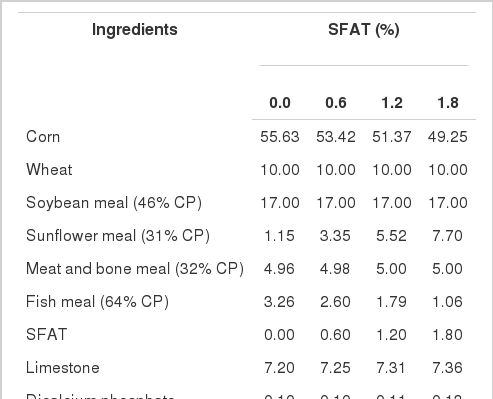
Ingredients and chemical composition of the layer diets (as fed)
The experiment used a completely randomized design, and each experimental unit was a replicate consisting of eight groups of adjacently caged layer hens fed as one group. The data was analyzed on two-factorial ANOVA using the general linear models procedure found in SAS software (SAS, 1991). The main effects of SFAT, period, and SFAT by period interaction were tested. Duncan’s multiple range test was carried out to detect differences among treatments. All differences were considered significant at p<0.05.
RESULTS AND DISCUSSION
The SFAT supplementation of the hens’ diet resulted in an improvement in most of the studied traits, including egg weight. However, the final body weight and gain were lower for hens fed added-SFAT diets, by 1.2% and 1.8% respectively (Table 3). These results suggest that the hens given SFAT at corresponding levels maintained better productive performance despite their inferior body weight, as compared with those provided with 0% or 0.6% SFAT. Similar results were observed when laying hens were fed a diet supplemented by menhaden oil. Gonzales-Esquerra and Leeson (2000) reported that 2% and 5% dietary menhaden oil supplementation from 19 to 55 wks of age caused a reduction in body weight gain by 34 g and 68 g, respectively, without compromising the productive performance of layer hens. The mortality did not differ among the dietary treatments (p>0.05).
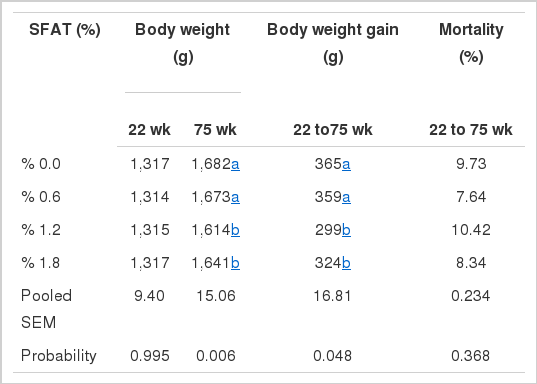
Body weight, body weight gain and mortality of laying hens
All of the performance traits studied was affected by experimental periods and dietary SFAT, except feed intake (Table 4). SFAT by period interactions were found significant for all of the indices tested, with the exception of feed intake. The graded levels of SFAT addition into the basal diet increased the egg production rate (p<0.01) in a dose-dependent manner in Period III. The egg production rate of the 1.2% SFAT group was significantly higher than other groups in period II, while a similar pattern was observed for the 1.8% SFAT group in period III. The mean egg production rate of hens fed 1.2% and 1.8% SFAT added diets were higher (p<0.01) than that of hens fed diets with 0.6% SFAT and no SFAT.
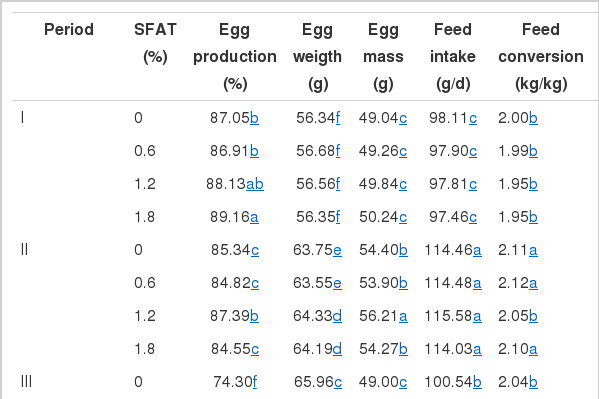
Effects of SFAT on productive performance of layer hens
Considering the overall mean, hens given diets supplemented with 1.2% and 1.8% SFAT laid heavier eggs than those hens fed diets with 0% and 0.6% SFAT (p<0.01) (Table 4). Quantitatively small improvements in egg weight (ranging from 0.40 g to 0.60 g) with respect to corresponding SFAT treatments were found statistically significant (p<0.01). Specifically, the mean egg weight for hens fed a diet supplemented with 1.2% and 1.8% SFAT was the highest. As the hen aged, the eggs became heavier (p<0.01). The increased amount of linoleic acid in the diet was often related to increased egg weight in most previous studies (Shutze and Jensen, 1963; Scragg et al., 1987; March and MacMillian, 1990; Zimmerman, 1997). The positive relationship between increased dietary supplemental fat and egg weight is also well documented (Whitehead et al., 1991, 1993; Grobas et al., 1999, 2001). The improved egg weight of hens fed SFAT as a result of increased dietary linoleic acid and fat content in this study are in agreement with corresponding reports. Both higher n-3 fatty acids (eicosapentaenoic acid, C20:5n−3 and docosahexaenoic acid, C22:6n−3) which were provided by supplemental FO might have been confirmatory of the increased egg weight in SFAT treated groups. Likewise, Whitehead et al. (1993) and Whitehead (1995) indicated that increased dietary fatty acids provided by SFAT may increase egg weight by stimulating the synthesis of oviducal proteins. Grobas et al. (1999) indicated that increasing dietary SFAT improved egg weight by 1.2 g in a long term laying hen trial (22 to 65 wks).
Egg mass output of the 1.2% or 1.8% SFAT group was significantly higher than that of the 0.6% or 0% SFAT group for the entire experimental period (Table 4). Hens fed on diets supplemented with SFAT at 1.2% and 1.8% yielded more egg mass, by over 2 g on average, as compared to hens that were not administered SFAT. The assumption that fatty acids in poultry diets supplied by SFAT were more readily absorbed through intestines and were more efficiently directed to egg mass constituents (Bray, 1967; March and MacMillian, 1990; Nimpf and Schneider, 1991) support the present findings of our study. It appears that relatively more fatty acids available in SFAT added diets might have efficaciously been utilized to constitute heavier eggs, as compared to a no-SFAT and 0.6% SFAT treated programs.
The overall means indicated that SFAT improved laying hen performance characteristics when supplemented into the diet at fairly low levels (1.2% or 1.8%). However, this was barely the case for 4% or more FO inclusion, in the experimental conditions of other studies (Hargis et al., 1991; Grobas et al., 1999; Gonzales-Esquerra and Leeson, 2000). The differences in productive performance between this and above-mentioned earlier experiments were accounted for differentiation in hen genotype used, particularly their specific responds to dietary fat level. The white hen strain used in the present study (Nick Chick) producing egg mass at about 53 g may have had needed relatively fewer SFAT to satisfy their dietary energy (fat) requirements when compared to white and brown hen genotypes (i.e., DeKalb Delta and Isa Brown, respectively) producing heavier egg mass ranging from 56 g to 60 g.
The level of added SFAT in the diets in this trial did not influence mean daily feed intake (p>0.05) (Table 4). However, the feed intake stimulant effect with 1.8% SFAT was significant only in Period III (p<0.01). The markedly higher egg production, egg weight and egg mass, improved feed efficiency and less cracked-broken eggs in hens fed on a diet supplemented with 1.8% SFAT through Period III, was related to the notable increase in feed consumption (Table 4). This implies that SFAT at that level promoted feed intake; hence, the extra nutrients were directed to heavier egg mass production during that later phase of production, which corresponded to hot climatic conditions. The marked decline in feed intake of hens during the latest laying cycle (Period III) compared with previous stage (Period II) is related to the high environmental temperatures prevailed for 6 to 8 wks during the corresponding period.
The feed conversion ratio was affected by SFAT and the age of the hen (p<0.05) (Table 4). The overall feed conversion ratio of 1.2% and 1.8% SFAT groups was equal (1.96) and significantly improved when compared with the 0% SFAT group (2.05%) correlated the improvements in laying rate, egg weight and egg mass.
SFAT also decreased the cracked-broken egg ratio during Period III, and throughout the entire experimental period, as compared to that for hens fed the diet without SFAT (Table 4). Nahashon et al. (1994) demonstrated that the retention of nitrogen, calcium, and phosphorous in white leghorn hens was significantly increased as a consequence of dietary fat supplementation at 3%, and concluded that as the amount of SFAT increased, the feed passage time was extended. Therefore, the extra minerals absorbed by the SFAT-fed hens supposedly contributed to their larger egg size and improved eggshell mineralization.
The liver weight was not affected by the dietary treatments (p>0.05). However, all levels of dietary supplementation with SFAT increased both the absolute and percentage weight of abdominal fat (p<0.01) (Table 5). It is supposed that the hens’ ability to efficiently utilize dietary fat might result extra abdominal fat deposition in hens fed on diets added with SFAT (Sell et al., 1979; Matéos and Sell, 1981a). The increased dietary fat was deposited in the adipose tissue of the abdomen. Indeed, hens that were fed SFAT at inclusion levels of 1.2% and 1.8% produced greater egg mass in spite of the similar amount of feed intake, as compared to hens fed without SFAT, and they also deposited significantly more abdominal fat than those hens that did not receive any SFAT. This can be explained by a mechanism asserted by some scholars (Matéos and Sell, 1981b; Golian and Maurice, 1992); i.e., high fat diets may slow down the rate of the passage of digesta through the gastrointestinal tract, thereby allowing more time for the absorption and utilization of nutrients, such as nitrogen and fat.

Absolute and percentage weight of liver and abdominal fat of SFAT-fed hens
In conclusion, the results showed that SFAT markedly improved laying hen performance, despite the lower body weight and heavier abdominal fat pad. The SFAT also proved benefits in terms of decreasing the cracked-broken egg ratio. Incorporation SFAT into a corn-soybean-based practical diet at the level of 1.2% or 1.8%, which provides 3.8 to 4.5% in dietary crude fat with 1.2 to 1.5% in linoleic acid, respectively, could maximize the overall productive performance in a commercial white layer hen strain.