Effect of Dietary Antimicrobials on Immune Status in Broiler Chickens
Article information
Abstract
This study evaluated the effects of dietary anticoccidial drugs plus antibiotic growth promoters (AGPs) on parameters of immunity in commercial broiler chickens. Day-old chicks were raised on used litter from a farm with endemic gangrenous dermatitis to simulate natural pathogen exposure and provided with diets containing decoquinate (DECX) or monensin (COBN) as anticoccidials plus bacitracin methylene disalicylate and roxarsone as AGPs. As a negative control, the chickens were fed with a non-supplemented diet. Immune parameters examined were concanavalin A (ConA)-stimulated spleen cell proliferation, intestine intraepithelial lymphocyte (IEL) and spleen cell subpopulations, and cytokine/chemokine mRNA levels in IELs and spleen cells. ConA-induced proliferation was decreased at 14 d post-hatch in DECX-treated chickens, and increased at 25 and 43 d in COBN-treated animals, compared with untreated controls. In DECX-treated birds, increased percentages of MHC2+ and CD4+ IELS were detected at 14 d, but decreased percentages of these cells were seen at 43 d, compared with untreated controls, while increased TCR2+ IELs were evident at the latter time. Dietary COBN was associated with decreased fractions of MHC2+ and CD4+ IELs and reduced percentages of MHC2+, BU1+, and TCR1+ spleen cells compared with controls. The levels of transcripts for interleukin-4 (IL-4), IL-6, IL-17F, IL-13, CXCLi2, interferon-γ (IFN-γ), and transforming growth factorβ4 were elevated in IELs, and those for IL-13, IL-17D, CXCLi2, and IFN-γ were increased in spleen cells, of DECX- and/or COBN-treated chickens compared with untreated controls. By contrast, IL-2 and IL-12 mRNAs in IELs, and IL-4, IL-12, and IL-17F transcripts in spleen cells, were decreased in DECX- and/or COBN-treated chickens compared with controls. These results suggest that DECX or COBN, in combination with bacitracin and roxarsone, modulate the development of the chicken post-hatch immune system.
INTRODUCTION
The intestinal microbiome shapes the gut immune system. In rodents, for example, intestinal colonization by Bifidobacterium infantis or Faecalibacterium prausnitzii stimulates the development of Foxp3+ T regulatory cells (Tregs) and interleukin-10 (IL-10) production, while segmented filamentous bacteria induce proinflammatory T helper 17 (Th17) cell development (Lee and Mazmanian, 2010). In chickens, Yin et al. (2010) reported that an evolving gut microbiota over time was associated with distinct profiles of immune gene expression in the ileum. This study, and others imply that interventions which alter the quantity or quality of intestinal bacteria will influence avian gut immunity. Indeed, this concept has been experimentally verified in multiple reports (Lillehoj, 1998; Lillehoj and Lillehoj, 2000; Lee et al., 2010; Lee et al., 2011a; Lee et al., 2011b).
Among the factors that are known to dramatically affect chicken gut commensal bacteria are in-feed antimicrobial drugs (Lu et al., 2008). Monensin, which is extensively used in the poultry industry to prevent Eimeria coccidiosis, exhibits antiparasitic and antibacterial properties as a result of its ability to transport metal cations through cellular membranes, and decoquinate is a coccidiostat that disrupts electron transport in the mitochondrial cytochrome system of Eimeria parasites (EFSA, 2003; Martel et al., 2004). Traditionally, avian coccidiostats are used together with antibiotic growth promoters (AGPs) to achieve the combined effects of reducing parasite infection while simultaneously increasing body weight gain. However, use of in-feed commercial poultry medication programs has also developed infectious diseases caused by intestinal microbial pathogens, particularly Eimeria, Salmonella, and Clostridium. The appearance of these infectious agents, despite the use antimicrobial feed additives, can be attributed, in part, to the development of antibiotic resistance by the microorganisms (Bach Knudsen, 2001). However, given that these drugs modify the avian gut microbiota (Lu et al., 2008; Yin et al., 2010; Lee and Lillehoj, 2011), and because alteration of intestinal commensal bacteria influences development of the avian gut immune system (Lee et al., 2010; Lee et al., 2011a; Lee et al., 2011b), an alternative explanation can be proposed, i.e. that coccidiostats/AGPs upset the gut microbiome-immune balance, thereby reducing immunocompetence and increasing susceptibility to infectious diseases. As an initial attempt to address this hypothesis, this study evaluated the effects of decoquinate (DECX) or monensin (COBN) in combination with two AGPs, bacitracin and roxarsone (4-hydroxy-3-nitrobenzenearsonic acid), on in vitro parameters of chicken intestinal immunity. Both DECX and COBN have demonstrated ability to alter the composition of intestinal bacteria in chickens (Neumann et al., 2011). To accelerate colonization of an adult-type gut microbiota under experimental conditions simulating natural pathogen exposure (Cressman et al., 2010), chickens were raised from hatch on used litter from a poultry farm with endemic gangrenous dermatitis (GD).
MATERIALS AND METHODS
Birds and diets
Day-old male broiler chicks (n = 105, Ross/Ross, Longenecker’s Hatchery, Elizabethtown, PA) were placed on used litter at the University of Delaware research facility. All broiler chicks used in this study had received normal vaccinations, including in ovo Marek’s disease (turkey herpes virus (HVT), SB-1 and Rispen) at 18 d of incubation, and Newcastle disease and infectious bronchitis via post-hatch coarse spray. The drug-free basal diet was a mash type consisting of corn, soybean meal, poultry and animal by-products, and distiller’s dried grains soluble.
Used litter
Used litter was obtained from a commercial broiler house of a farm with endemic GD and confirmed Clostridium perfringens isolation where at least 10 broiler flocks had been grown. Salinomycin was routinely used as a coccidiosis control program. The litter was subjected to natural composting, transported to the research facility, homogenized, and evenly distributed into the experimental housing pens. The incidence of GD on this and similar poultry farms is presumably associated with broiler coccidiostat feeding programs between 19 and 28 d post-hatch (Ritter et al., 2010).
Experimental design
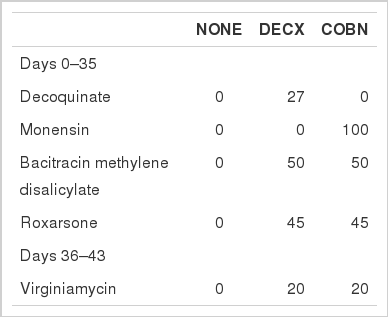
Two drug treatment regimens were used, decoquinate as Deccox® (DECX) (27 g/ton) or monensin as Coban® (COBN) (100 g/ton), each with bacitracin methylene disalicylate (50 g/ton) and roxarsone (45 g/ton), between 0 and 35 d post-hatch. Between 36 and 43 d, all additives were removed and both treatment groups received basal diet containing virginiamycin (20 g/ton). The untreated control group (NONE) was provided with a non-supplemented basal diet mixed with carrier alone throughout the entire experimental period. The population density was 0.06 m2/bird at 1 wk, 0.07 m2/bird at 2 wk, 0.09 m2/bird at 3 wk, 0.11 m2/bird at 4 wk, and 0.15 m2/bird at 5 or more wk post-hatch. All protocols were approved by the Institutional Animal Care and Use Committees of the Beltsville Agricultural Research Center and the University of Delaware.
Tissue samples
At 14, 25, and 43 d of age, five birds per group were randomly selected for removal of intestine and spleen. Spleen mononuclear cells were isolated as described (Lee et al., 2010). In brief, spleen cell suspensions were prepared by gently flushing through a cell strainer and lymphocytes were purified by density gradient centrifugation through Histopaque-1077 (Sigma). Individual segments of the jejunum and ileum were removed and each segment was divided into equal-length segments. One segment was opened longitudinally, pooled by treatment group, washed with ice-cold Hank’s balanced salt solution (Sigma, St. Louis, MO, USA), and intraepithelial lymphocytes (IELs) were purified by density gradient centrifugation as described (Lee et al., 2010). Another segment was opened longitudinally, washed, and epithelial cells were isolated by gentle scraping with a tissue culture scraper. Both IELs and spleen cells were >95% viable by trypan blue exclusion assay.
Concanavalin A-stimulated spleen cell proliferation
Spleen cells were seeded at 5.0×10⁵ cells/well in 96-well microtiter plates and incubated with medium alone (control) or with 2.0 μg/ml concanavalin A (ConA, Sigma) in a humidified incubator at 41°C with 5% CO2 for 48 h. Cell proliferation was measured using 2-(2-methoxy-4-nitrophenyl)-3-(4-nitrophenyl)-5-(2,4-disulfophenyl)-2H-tetrazolium (Cell Counting Kit-8, Dojindo Molecular Technologies, Gaithersburg, MD, USA) by measuring optical density (OD) at 450 nm using a microplate spectrophotometer (BioRad, Hercules, CA, USA) as described (Lee et al., 2010). Proliferation was expressed as the stimulation index, calculated as the ratio of the mean OD450 value of ConA-stimulated cells divided by the mean OD450 value of medium alone-stimulated cells.
Lymphocyte subpopulations
IELs and spleen cells were stained using monoclonal antibodies against the following surface markers: CD4 (T helper lymphocytes) (Lillehoj et al., 1988a), CD8 (cytotoxic T lymphocytes) (Lillehoj et al., 1988a), TCR1 (γδ T cell receptor) (Chen et al., 1986), TCR2 (αβ TCR) (Chen et al., 1986), BU1 (B cells) (Rothwell et al., 1996), MHC2 (antigen-presenting cells) (Lillehoj et al., 1988b) and analyzed by flow cytometry with a FACSCalibur instrument (BD Biosciences, San Jose, CA, USA). As a positive control, the cells were stained with a monoclonal antibody against K55, a chicken pan lymphocyte marker (Cheung et al., 1991). As a negative control, the cells were stained with HB2, a monoclonal antibody against human T cells (American Type Culture Collection, Manassas, VA, USA). Data were obtained from a total of 1.0×10⁴ viable cells (n = 5). In all groups, the percentage of IELs and spleen cells stained by the positive control K55 mAb was consistently >95%, and the percentage of IELs and spleen cells stained by the negative control HB2 mAb was consistently <2% (data not shown).
Cytokine/chemokine mRNA levels
At 43 d of age, total RNA was extracted from intestinal epithelial and spleen cells using TRIzol (Invitrogen, Carlsbad, CA, USA). Five micrograms of total RNA were treated with 1.0 U of DNase I and 1.0 μl of 10× reaction buffer (Sigma), incubated for 15 min at room temperature, 1.0 μl of stop solution was added, and the mixture was heated at 70°C for 10 min. RNA was reverse transcribed using the StrataScript first-strand synthesis system (Stratagene, La Jolla, CA, USA) according to the manufacturer’s recommendations. Quantitative (q)RT-PCR oligonucleotide primers for chicken cytokines and glyceraldehyde 3-phosphate dehydrogenase (GAPDH) internal control are listed in Table 2. Amplification and detection were carried out using equivalent amounts of total RNA using the Mx3000P system and Brilliant SYBR Green QPCR master mix (Stratagene) as described (Hong et al., 2006; Park et al., 2008). Standard curves were generated using log10 diluted standard RNAs and the levels of individual transcripts were normalized to those of GAPDH using the Q-gene program (Muller et al., 2002). Each analysis was performed in triplicate. To normalize RNA levels between samples within an experiment, the mean threshold cycle (Ct) values for the amplification products was calculated by pooling values from all samples in that experiment.
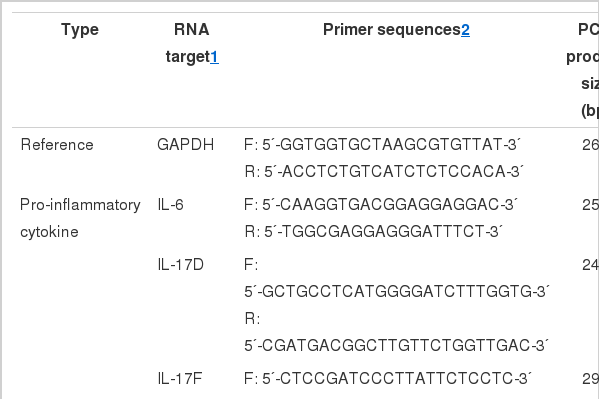
Oligonucleotide primers used for quantitative RT-PCR
Statistical analysis
Data were expressed as the mean±SD values and subjected to analysis of variance using the Tukey test with SPSS 15.0 for Windows (SPSS Inc., Chicago, IL, USA). A value of p<0.05 was considered statistically significant.
RESULTS
ConA-stimulated spleen cell proliferation
At 14 d post-hatch, ConA-stimulated spleen cell proliferation was slightly decreased in DECX-treated chickens compared with the untreated control group, but the difference was statistically significant (Figure 1). Increased proliferative responses were observed in COBN-treated birds at 25 and 43 d compared with controls.
Effects of DECX or COBN plus AGPs on spleen cell proliferation. Spleen mononuclear cells were isolated at 14, 25 and 43 d post-hatch, and were stimulated with 2.0 μg/ml ConA for 48 h. The stimulation index was calculated as described in the Materials and methods. Each data point represents the mean±SD value (n = 4). Different letters at each time points differ significantly (p<0.05). NONE = Untreated; DECX = Decoquinate-treated; COBN = Monensin-treated.
Intestinal IEL subpopulations
In general, subpopulations of all IELs, with the exception of TCR1+ cells, exhibited a “V-shaped” pattern of expression at 14, 25, and 43 d (Figure 2). In DECX-treated birds, increased percentages of MHC2+ and CD4+ IELs were detected at 14 d, but decreased fractions of these two cell subpopulations (e.g., MHC2+ and CD4+ IELs) and increased TCR2+ IELs were noted at 43 d compared with untreated controls. COBN treatment was associated with decreased percentages of MHC2+ and CD4+ IELs compared with controls.

Effects of DECX or COBN plus AGPs on intestinal IEL subpopulations. IELs, isolated at 14, 25 and 43 d post-hatch, were stained with monoclonal antibodies against the indicated cell surface proteins, and analyzed by flow cytometry. Each point represents the mean±SD value (n = 5). Different letters at each time point differ significantly (p<0.05). NONE = Untreated; DECX = Decoquinate-treated; COBN = Monensin-treated.
Spleen cell subpopulations
Most spleen mononuclear cell subpopulations were decreased during the two treatment regimens compared with untreated controls (Figure 3). In COBN-treated chickens, decreased CD8+ cells at 14 d, reduced TCR1+ and BU1+ cells at 25 d, and lower MHC2+ cells at 43 d were detected. But, COBN-treated animals had increased CD4+ cells at 14 and 25 d, and greater TCR2+ cells at 25 d compared with controls. In DECX-treated animals, decreased TCR1+ spleen cells were observed at 43 d and increased CD4+ cells were seen at 14 d.
Effects of DECX or COBN plus AGPs on spleen cell subpopulations. Spleen mononuclear cells, isolated at 14, 25 and 43 d post-hatch, were stained with monoclonal antibodies against the indicated cell surface proteins, and analyzed by flow cytometry. Each point represents the mean±SD value (n = 5). Different letters at each time point differ significantly (p<0.05). NONE = Untreated; DECX = Decoquinate-treated; COBN = Monensin-treated.
Intestinal epithelial cell cytokine/chemokine mRNA levels
Higher levels of IL-6, CXCLi2 (IL-8), and IL-13 transcripts, but lower levels of IL-12 transcripts, were observed in the DECX and COBN groups compared with untreated controls (Figure 4). DECX-treated chickens also had increased levels of IL-4 transcripts, but lower levels of IL-2 mRNAs, compared with controls. COBN-treated birds had higher levels of IL-17F, IFN-γ, and transforming growth factorβ4 (TGFβ4) transcripts compared with controls.

Effects of DECX or COBN plus AGPs on the levels of cytokine/chemokine mRNA levels in intestinal epithelial cells. Epithelial cells were isolated at 43 d post-hatch, and the levels of the indicated cytokine/chemokine transcripts were quantified by qRT-PCR and normalized to the levels of GAPDH transcripts. Each bar represents the mean±SD value (n = 3). Bars with different letters differ significantly (p<0.05). NONE = Untreated; DECX = Decoquinate-treated; COBN = Monensin-treated.
Spleen cell cytokine/chemokine mRNA levels
The levels of IL-4, IL-12, and IL-17F transcripts in spleen mononuclear cells were decreased in the DECX and COBN groups compared with untreated controls (Figure 5). DECX-treated birds also had lower IL-6, but increased IL-17D transcripts compared with controls. COBN-treated chickens had increased CXCLi2, IL-13, and IFN-γ mRNAs compared with controls. The levels of mRNAs encoding IL-10, lipopolysaccharide-induced TNF-α factor (LITAF), and TNF superfamily member 15 (TNFSF15) in intestinal epithelial and spleen cells were not affected by either treatment (data not shown).

Effects of DECX or COBN plus AGPs on the levels of cytokine/chemokine mRNA levels in spleen cells. Spleen mononuclear cells were isolated at 43 d post-hatch, and the levels of the indicated cytokine/chemokine transcripts were quantified by qRT-PCR and normalized to the levels of GAPDH transcripts. Each bar represents the mean±SD value (n = 3). Bars with different letters differ significantly (p<0.05). NONE = Untreated; DECX = Decoquinate-treated; COBN = Monensin-treated.
DISCUSSION
Avian coccidiosis is a major parasitic disease for the poultry industry worldwide. It is caused by seven species of Eimeria apicomplexan protozoa that infect intestinal epithelial cells resulting in deleterious effects on nutrient absorption in the gut. To manage coccidiosis, and to promote body weight gain, shuttle or rotation drug programs with anticoccidials and AGPs are widely practiced during commercial poultry production (Chapman et al., 2010). However, many of these chemical compounds disrupt the intestinal microflora. Because immune system development is influenced by the gut microbiota (Parry et al., 1977; Dibner et al., 2008; Sekirov et al., 2008; Round and Mazmanian, 2009; Lee and Mazmanian, 2010; Yin et al., 2010; Lee and Lillehoj, 2011), any environmental stimulus that alters intestinal bacteria would be expected to modify the microbiome-immune equilibrium, thereby altering host immunity. This concept has been experimentally verified in chickens with respect to the use of used litter as a source of enteric pathogens (Lee et al., 2011a), the feeding of probiotics or essential oils (Lee et al., 2010; Lee et al., 2011b), and experimental infection with Eimeria (Lillehoj, 1998; Lillehoj and Lillehoj, 2000). The results of the current study now extend the list of exogenous factors affecting avian immune status to antimicrobial drugs used in commercial poultry production (at least until July 2011 when sale of roxarsone was discontinued in the US). In summary, dietary supplementation with DECX and/or COBN in combination with bacitracin and roxarsone altered not only mitogen-induced spleen cell proliferation, but also gut epithelial and spleen leukocyte subpopulations as defined by a variety of cell surface markers, and their intracellular cytokine/chemokine transcript levels.
The increased mitogenesis of spleen cells, which is normally considered as an indicator of lymphocyte function, is detected at 25 and 43 d in COBN-treated chickens in this study. Prior reports in avian systems support our observations of monensin-enhanced spleen cell proliferation. White Leghorn chickens that received a single oral dose of 140 mg/kg tylosin, a macrolide antibiotic that inhibits bacterial protein translation, exhibited increased ConA-stimulated spleen cell proliferation compared with untreated controls (Baba et al., 1998). Munir et al. (2009) reported that the antibiotic ionophore salinomycin, when supplemented in the diet at a concentration of 66 ppm, enhanced phytohemagglutinin-induced proliferation of peripheral blood lymphocytes in young broiler chickens compared with controls. However, salinomycin-enhanced mitogenesis was not evident in older animals. The latter results are not surprising given that many parameters of avian immunity are age-dependent (Lillehoj and Chung, 1992; Erf et al., 1998). Similarly, we observed dramatic effects on lymphocytes subsets between 14 and 43 d in untreated, as well as DECX- or COBN-treated chickens. Particularly in IELs, the percentages of specific cell subpopulations either progressively increased during the treatment period (e.g. BU1+ cells in untreated, and TCR1+ cells in untreated or COBN-treated birds) or exhibited a pattern of decrease between 14 and 25 d followed by an increase between 25 and 43 d (e.g. CD4+ cells during DECX or COBN treatments, and CD8+ cells during DECX treatment). This “rebound effect” may have been due, in part, to discontinuation of DECX and COBN treatments beginning at 36 d. Moreover, it remains to be determined whether modulation of chicken immune cell phenotypes or alteration of cytokine/chemokine in the gut render the birds more susceptible to infection by enteric pathogens, although there are reports of this effect in mammals (Larson and Borriello, 1990; Sekirov et al., 2008).
We observed more cytokine/chemokine transcripts whose levels were increased in DECX- and/or COBN-medicated groups vs. untreated controls in intestinal epithelia (CXCLi2, IL-4, IL-6, IL-13 IL-17F, IFN-γ, and TGFβ4) than in spleen cells (CXCLi2, IL-13, IL-17D, and IFN-γ). Conversely, more mRNAs were decreased in the respective treatment groups of spleen cells (IL-4, IL-6, IL-12, and IL-17F) compared with epithelial cells (IL-2 and IL-12). Many transcripts were unaltered in medicated vs. untreated groups of either cell type. Earlier studies with AGPs or antibiotic ionophores used singly or in combination have produced similar results. Chichlowski et al. (2007) did not find any differences in the levels of transcripts encoding IL-1β, IL-6, or IL-10 in ileal tissues of salinomycin-fed chickens compared with controls. Takahashi et al. (2011) reported increased chicken IFN-γ expression in the small intestine at 5 and 8 d, but not at 15 d, following feeding of salinomycin and enramycin. In contrast, IFN-γ mRNA levels in the large intestine were unaffected at 5 and 8 d, but significantly repressed at 15 d, in the medicated vs. non-medicated groups. No alterations in transcript levels were seen in the bursa of Fabricius. In a swine trial with lincomycin, significantly decreased levels of IL-1β transcripts were observed in peripheral blood monocytes and jejunal mucosal, but not in mesenteric lymph nodes, compared with untreated controls (Yin et al., 2008). In humans, in vitro studies with monocytes and neutrophils have shown that antimicrobials can either stimulate or inhibit cytokine mRNA levels (Morikawa et al., 1996; Reato et al., 2004).
In conclusion, the results of this study indicate that dietary medication programs of coccidiostats plus AGPs modulate various parameters of immunity in chickens, as evidenced by alterations in ConA-stimulated spleen cells proliferation, IEL and spleen cells subsets, and regulate cytokine/chemokine mRNA levels in gut epithelial and spleen cells. Future studies are needed to provide a direct causal link between drug-induced altered immune status and increased host susceptibility to infection by mucosal pathogens.
ACKNOWLEDGEMENTS
This project was supported by a Trust agreement established between ARS-USDA and Danisco, and partially by the ARS in-house project 1265-32000-086-00D and the Next-Generation BioGreen 21 Program (No. PJ008084), Rural Development Administration, Republic of Korea. We thank Marjorie Nichols and Stacy Torreyson for technical assistance.