Effects of Substituting Soybean Meal for Sunflower Cake in the Diet on the Growth and Carcass Traits of Crossbred Boer Goat Kids
Article information
Abstract
The present study was conducted to determine the best level of substitution of soybean meal by sunflower cake in diets for kids through the evaluation of quantitative carcass traits. Thirty-two Boer kids X 1/2 NDB (no defined breed), males, non-castrated, with 4 months of age and initial body weight of 15±3.2 kg, were randomly assigned to individual pens. The treatments contained four substitution levels of soybean meal by sunflower cake (0, 33, 66 and 100% DM). At the end of the experimental period, the animals were slaughtered. There was no influence of the treatments on any of the mean values of the evaluated measures (p>0.05): 21.78 kg (body weight at slaughter), 8.65 kg (hot carcass weight), 8.59 kg (cold carcass weight), 40.27% (hot carcass yield), 39.20% (cold carcass yield), 7.73 cm2(rib eye area), 46.74 cm (carcass outer length), 45.68 cm (carcass internal length), 36.92 cm (leg length), 26.04 cm (leg perimeter), 48.66 cm (hind perimeter), 58.62 cm (thoracic perimeter), 0.20 (carcass compactness index), 68.48% (total muscle of the leg), 2.79% (total leg fat), 55.19% (subcutaneous leg fat), 28.82% (total bone), 81.66 g (femur weight), 14.88 cm (femur length), 0.38 (leg muscularity index), 2.53 (muscle:bone ratio) and 33.42 (muscle:fat ratio). The substitution of soybean meal by sunflower cake may be recommended up to a level of 100% without alterations to quantitative carcass traits.
INTRODUCTION
Carcass weight is a factor that has a great influence on the market value of an animal, as in some countries there are marked preferences and price differentials according to carcass weight (Oliveira et al., 2008). Besides that, one must take into consideration the carcass components, since what is sought in the animal is its maximum carcass yield and minimum carcass non-components (Cezar and Sousa, 2007). The consumer shows a preference for cuts with a higher proportion of muscle and subcutaneous fat in an adequate quantity as to ensure tenderness and juiciness, so products brought to the market should present these characteristics.
In animal production, a food supply of good nutritional value is important for adequate animal performance and carcass yield, but the high cost of food is a factor that must be taken into consideration. For this reason, cheaper types of food alternative to the ones commonly used (corn and soybeans) have been studied which would not compete with human food. As an option, by-products of oil extraction for biodiesel production (meals and cakes) have been used for this purpose.
In Brazil, due to its diversity of climate and ecosystems, there are several species of oilseeds with potential for biodiesel production. The processing of seeds generate considerable amount of by-products that need to be evaluated as alternative sources for animal feed (Dias et al., 2010). Among the various alternatives available, sunflower cake is an option for animal feed because it is a good source of protein and energy (Oliveira et al., 2007) which may increase the yield of goat carcasses, given that the goat breeding systems carried out most extensively in northeastern Brazil are characterized by low animal performance.
This study was conducted to evaluate the best level of substitution of soybean meal by sunflower cake in the diet of 1/2 Boer kids through the study of carcass characteristics.
MATERIAL AND METHODS
The experiment was conducted at the School of Veterinary Medicine and Animal Science of the Federal University of Bahia, located in Salvador, Brazil, over a period of 68 days from October to December 2008, with seven days for animal adaptation to diets and daily management and 61 days for data collection.
Thirty-two 1/2 Boer kids X 1/2 NDB (no defined breed) were used, all non-castrated males, at an age of four months and an initial body weight of 15±3.2 kg. Prior to the beginning of the experiment, the animals were weighted, marked, de-wormed and vaccinated against clostridia, endo and ectoparasites, and then assigned to individual 1.0 m2 pens with a suspended wooden slatted floor, and provided with food and water in a covered area.
The kids were distributed into four treatment groups, constituting diets with 0, 33, 66 and 100% substitution of soybean meal by sunflower cake in the dry matter. Diets were formulated following the NRC guidelines (1981) to meet the nutritional requirements of growing kids, with target gains of 150 g per day. The concentrates were composed of ground corn, soybean meal, sunflower cake and minerals, and were used to supplement the forage, ground Tifton hay (3–4 cm), in a 50:50 proportion of forage: concentrate.
The chemical composition of the diet ingredients (Table 1) and the experimental diets (Table 2) were evaluated according to AOAC (1990) for the estimation of dry matter (DM), ash, crude protein (CP) and ether extract (EE). The tests for the evaluation of neutral detergent fiber (NDF) and acid detergent fiber (ADF) were determined according to Van Soest et al. (1991). Non-fibrous carbohydrates were calculated according to Mertens (1997).

Chemical composition of ingredients in diets fed to 1/2 Boer kids

Proportion of ingredients and chemical composition of experimental diets fed to 1/2 Boer kids
Diets were offered twice daily, at 9 am and 4 pm. The leftovers were weighted daily and the amount of food provided was adjusted to allow for 10% of the offered food remaining. Water was supplied ad libitum daily. The metabolizable energy (ME) was calculated following the NRC recommendations (2001), using the equations: DE = TDN×0.04409 (Mcal/kg) and ME = DE×0.082. Analyses were performed at the Laboratory of Animal Nutrition of the School of Veterinary Medicine and Animal Science of the Federal University of Bahia in Brazil.
At the end of the experiment, animals with final body weight of 22±2.30 kg were fasted for 12 h and then weighed to determine the body weight at slaughter (BWS) and, later, the animals were stunned (electro) followed by bleeding, dehiding and evisceration. After the removal of the head and limbs, the carcasses were weighted to determine the hot carcass weight and the hot carcass yield was determined by the formula: HCW = (HCW/BWS)×100. The carcasses remained in cold storage (4°C) for 24 h and were then weighed to obtain the cold carcass weight (CCW). The biometric measurements were evaluated according to Yañez et al. (2004) as follows: carcass internal length (distance between the front edges of the pubic bone and the edge of the first ribs at its midpoint), carcass outer length (distance between the joint and cervicothoracic intercoccigeal first joint), leg length (distance between the greater trochanter and the edge of the tarsal-metatarsal joint), hind perimeter (perimeter in the croup, based on the trochanters of the femurs), leg perimeter (perimeter drawn on the middle part of the leg above the femoral-tibio-patellar articulation) and thoracic perimeter (perimeter measured behind the palette).
The carcasses were longitudinally divided into two half carcasses, and the left half carcass was sectioned into five anatomical regions: neck (1st to 7th cervical vertebrae), shoulder (bone basis, scapula, upper arm and carpus), ribs (1st to 13th thoracic vertebrae), loin (longissimus lumborum muscle and dissected vertebral bones) and leg (section between the last lumbar and first sacral vertebrae). The cuts were individually weighed to determine the percentages that represented about half the weight of the remaining reconstituted carcass according Cezar and Souza (2007).
The carcasses were cut between the 12th and 13th ribs for determination of the rib eye area (REA), which was made using a clean transparency sheet and a pen. REA cm2 was obtained after scanning the images. The carcass compactness index (cold carcass weight divided by carcass internal length) was calculated according Yañez et al. (2004).
The muscularity, muscle: bone and muscle: fat ratios were obtained after dissection and weighing of the muscles lining the femur (biceps femoris, semitendinosus, adductor, semimembranosus and quadriceps) and the completely clean femur, using the formula described by Purchas et al. (1991):
The experiment was a completely randomized design with four treatments and eight repetitions. The data were submitted to an analysis of variance (GLM procedure, SAS 2002) and the initial body weight was added as covariable for all variables analyzed. Orthogonal polynomial contrasts were used to examine responses (linear and quadratic) to an increase in the substitution levels of soybean meal by sunflower cake in the diets (REG procedure, SAS, 2002) with significance level of 5%.
RESULTS AND DISCUSSION
The substitution of soybean meal by sunflower cake in the diet of goats did not affect (p>0.05) body weight at slaughter (Table 3). It is probable that the chemical composition of sunflower cake was responsible for the similarity among weights and treatments, because with increasing of substitution of the soybean meal by sunflower cake, it was observed that non-fibrous carbohydrate intake decreased and intake of neutral detergent fiber and ether extract increased (Aly Agy et al., 2011). This allowed the animals to present similar metabolizable energy intake, resulting in a similar body weight. Analyzing the average weight gain and feed conversion sunflower cake was found to decrease the average daily weight gain by 0,002 kg for each 1% inclusion of sunflower cake, while the feed conversion showed an increase, ranging from 5.36 to 7.58 kg dry matter by kg of weight gain (Aly Agy et al., 2011). Although these results were influenced by the substitution of soybean meal with sunflower cake, they did not promote a significant reduction in body weight at slaughter.

Body weight at slaughter, hot and cold carcass weight, hot and cold carcass yield and rib eye area of 1/2 Boer kids fed diets containing sunflower cake
Weights and carcass yields as well as rib eye area showed no differences (p>0.05) with the substitution of soybean meal by sunflower cake. As the addition of sunflower cake in the diet resulted in no differences in body weight between treatments, the variables of weight and rib eye area followed the same pattern, as according to Pereira Filho et al. (2008), animals of similar body weights imply similar carcass weight and rib eye area measures. The values of hot and cold carcass weight and rib eye area were close to those reported by Pereira Filho et al. (2008) for 1/2 Boer kids, slaughtered between 20 and 25 kg.
According to Dias et al. (2008), an increase in the NDF content of the diet, such as that found in this study (Table 1), should result in a reduction in carcass yield, since the fiber content in the diet has a direct impact on the increased volume of the gastrointestinal tract, in addition to limiting consumption due to more time spent on fiber fermentation. The non- significant effect (p>0.05) for the carcasses in this work can be explained by the low physical effectiveness of the fiber, since the sunflower cake was provided ground which decreased fiber retention time in the gastrointestinal tract. This alternative feed may therefore be an option to circumvent the limitations caused by the consumption of a food supply high in NDF.
The measurements showed no differences (p>0.05) with the substitution of soybean meal by sunflower cake (Table 4). These results support evidence by the anatomical harmony law proposed by Boccard and Dumont (1960), in which the body regions of the carcass are proportional in animals of similar weight and fat content. Similarly, the carcass compactness index was not affected by the addition of sunflower cake in the diet. The carcass compactness index is a measure related to cold carcass weight and carcass internal length. The substitution of soybean meal by sunflower cake did not influence these two variables, so the carcass compactness index followed the same pattern.

Biometric measurements and carcass compactness index of 1/2 Boer kids fed diets containing sunflower cake
The commercial cuts and yields were not influenced (p>0.05) by the substitution of soybean meal by sunflower cake (Table 5). These variables are related to the carcass weight, which remained constant with the increased substitution of soybean meal by sunflower cake. According to Boccard and Dumont (1960), in carcasses with similar weight and fat content, the body regions are in similar proportions. With an increase in carcass weight, cuts which develop earlier such as the leg and shoulder have decreased yield, and in goat carcasses from 30 kg, the yield of rib starts to exceed the yield of leg (Colomer-Rocher, 1992). This is undesirable behavior, since the leg is considered a first category cut because it is a region with higher muscle deposition and with little connective tissue content, which ensures softness and commercial valorization.
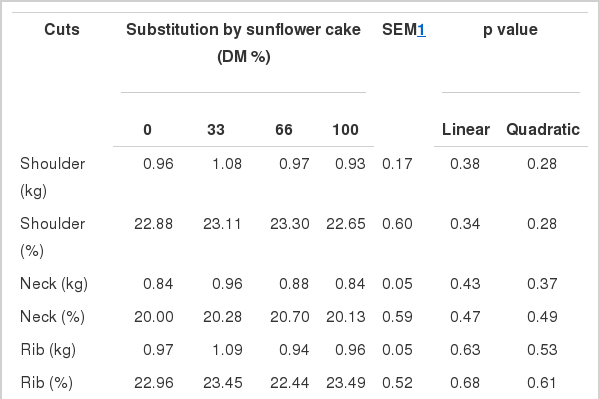
Yield and commercial cuts of 1/2 Boer kids fed diets containing sunflower cake
Tissue composition, leg muscularity and the muscle: bone and muscle:fat ratios (Table 6) were not influenced (p>0.05), probably because the substitution of soybean meal by sunflower cake provided the same energy intake for animals of different treatments, resulting in similar weights, which was also the case for animals of similar ages. According to Madruga (1999) subcutaneous fat in goats is characteristically very thin, and the abdominal cavity is the main fat depot, where 50% to 60% of the total fat is located between the abdomen and viscera, and the major part of it is removed at evisceration. Some authors (Banskalieva et al., 2000; Grande et al., 2003) have already reported this particular goat carcass trait as desirable as it results in leaner carcasses compared with other animal species.
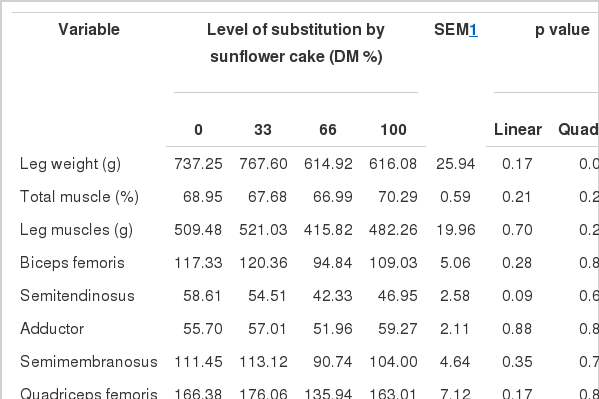
Tissue compositions and leg muscularity index of 1/2 Boer kids fed diets containing sunflower cake
The index values of leg muscularity found in this study were greater than the ones found by Dias et al. (2008) who worked with goats fed wheat bran; an increased amount of muscle was found on the goats fed with sunflower cake as well. The total percentage of muscle found in this work was also higher than that found by other authors (Table 6). This was probably because the animals in this study were slaughtered at a younger age, and were thus still in the process of muscle deposition.
The muscularity index proposed by Purchas et al. (1991) considers the weight of the muscles surrounding a given length of a bone and the bone itself. According to Abdullah et al. (1993), muscularity has a better correlation with the scores of carcass conformation than the muscle: bone ratio. This may be explained by the fact that muscularity is obtained by the ratio between the weight of the five muscles and the length of the femur and not by the ratio of two weight measures.
Similarly, the muscle:fat and muscle:bone ratios were not influenced by levels of sunflower cake in the diet, since the body weight at slaughter of the animals in different treatments were similar. These two variables are related to the weight and the age of the animal, since these are variables dependent on the development of the tissues in question. The muscle:bone ratio was lower than reported by Pereira Filho et al. (2008); however, the muscle:fat ratio was superior. The animals in this study probably achieved a weight of 20 kg earlier because these same authors state that bone tissue showed negative growth, indicating that increasing age and weight of the animal led to decreasing bone growth, even completely stopping, while the muscle tissue continued to develop, thus increasing the muscle: bone ratio. According to Rosa et al. (2002), leg fat will grow later, regardless of the feeding method, while the muscle growth is isometric, indicating that a higher muscle: fat relationship in this cut will be obtained in carcasses of younger animals.
The variables in the muscle: bone and muscle:fat ratios are important in determining the proportions of the tissues for commercial cuts, and higher values of these variables mean a greater amount of muscle tissue and a higher commercial value.
Based on the evaluation of the carcass traits, the substitution of soybean meal by sunflower cake in the diet of 1/2 Boer goats may be recommended up to a level of 100% without alterations to quantitative carcass traits.