Comparison of Growth Performance, Carcass Characteristics and Meat Quality of Korean Local Chickens and Silky Fowl
Article information
Abstract
This study was conducted to compare growth performance, carcass characteristics and meat quality of 4 breeds of local chicken. A total of 480 1-d-old chicks were distributed to 16 pens, with 4 treatments of breed, 4 replicates and 30 chicks per pen. Three Korean local breeds of white-mini broiler, Hanhyup-3-ho, and Woorimatdag, and a breed of silky fowl were raised under identical rearing and feeding conditions for 31-d, 37-d, 36-d, and 59-d, respectively. The BW and feed consumption on a pen basis were weekly measured for all pens, and ADFI, ADG and gain:feed were calculated for each pen. The ADFI and ADG of 3 breeds of Korean local chicken were greater than those of silky fowl (p<0.05). Within the Korean local breeds, ADFI of white-mini broiler was the highest (p<0.05), and ADG of Hanhyup-3-ho and white-mini broiler was the highest (p<0.05). Gain:feed of silky fowl was less than that of the 3 breeds of Korean local chicken. The carcass and breast yield of white-mini broiler were the greater than those of other breeds (p<0.05). The breast meat color (CIE L*, a*, and b*) of 3 breeds of Korean local chicken were higher than that of silky fowl (p<0.05). The breast meat of Hanhyup-3-ho had greater cooking loss (p<0.05), whereas water holding capacity and pH were less than those of other breeds (p<0.05). The color score of 3 breeds of Korean local chicken was higher than that of silky fowl (p<0.05). Woorimatdag had a higher score on tenderness (p<0.05), whereas flavor score was less than that of other breeds (p<0.05). In conclusion, 4 local breeds of chicken have some unique features and seem to have more advantages, and this information can help consumers who prefer healthy and premium chicken meat.
INTRODUCTION
Meat is a nutrient-dense food and meat and meat products are important sources of wide range of nutrients. However, meat is not a homogeneous food group and the composition of meat varies by meat category (Cosgrove et al., 2005). For example, the fat content of red meats such as beef, lamb and pork is higher than that of chicken and turkey (Chan et al., 1995, 1996). Iron content of red meats such as beef and the dark meat of chicken and turkey are higher than the light meat of poultry (Chan et al., 1995). Chicken meat represents 29% of meat production from farmed animals and this proportion is rising each year (McKay et al., 2000). This growth has been based on strong consumer demand for chicken products in foreign and domestic markets as a result of an accelerated increase in global population and the consumer perception of the health benefits of chicken meat (López et al., 2011).
Local chickens are known to possess desirable characteristics such as resistance to some diseases, outstanding meat flavor and taste (Aberra, 2000; Fanatico et al., 2005a). Consequently, consumption of meat products from local chickens has increased in countries of East Asia and Europe in spite of their relatively high prices (Yang and Jiang, 2005). Hanhyup-3-ho, white-mini broiler and Woorimatdag are representative of the local chickens from Korea and they have different characteristics in appearance, size and plumage. Silky fowls, originating from Taihe country of Jiangxi province (China), are an imported breed purported to have special nutritive and medicinal values (Li et al., 2003). Many local chickens are available in countries such as Three Yellow of China, Label Rouge of France, and Qualite Wallon of Belgium. Researchers have suggested that although the growth performance of local chicken is less efficient than that of commercial broilers, the quality of their meat is more appropriate for premium chicken meat (Lewis et al., 1997; Castellini et al., 2002; Gordon and Charles, 2002).
Unique taste and high nutritional value of local chicken in comparison with those of broilers have yet to be clearly evaluated via scientific analyses, and it is important to elucidate the physicochemical factors that influence the taste and nutritional value of these chickens (Jayasena et al., 2013). Little is known about the growth performance and meat quality of local chicken used in Korea. Therefore, the objectives of the current study were to compare growth performance, carcass characteristics and meat quality of three kinds of Korean local chickens and silky fowl.
MATERIALS AND METHODS
Animals, diets, and management
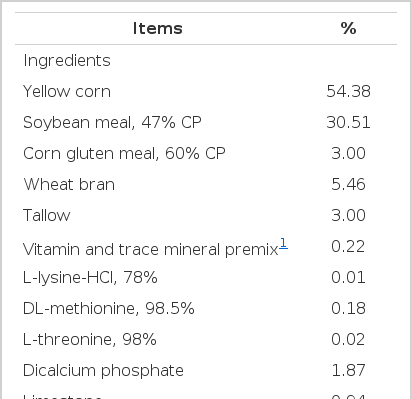
A total of 480 Korean local chickens (White-mini broiler, Hanhyup-3-ho and Worimatdag) and silky fowl at 1-d of age were weighted and completely randomly assigned into 4 treatments. Each treatment was comprised of 4 replicates. Thirty chicks per each pen were raised for 31-d (white-mini broilers), 37-d (Hanhyup-3-ho), 36-d (Woorimatdag), and 59-d (silky fowl). The chicks were fed the same commercial diet (21% CP, 3,050 kcal of TME/kg) from 1-d until the end of the experimental period. Nutrients and energy concentrations of experimental diets met or exceeded the minimum requirements of National Research Council (1994). The formula and chemical compositions of experimental diets are shown in the Table 1. Feed was provided ad libitum and the birds had free access to water. The BW and feed consumption on a pen basis were weekly measured for all pens. Average daily gain, ADFI and gain:feed were calculated for each pen. Animal facilities and husbandry were similar to conditions described by An et al. (1995). Lighting was kept at 23/1 light/dark cycle throughout the experimental period. The chicks were initially started at 33°C; the temperature was gradually decreased by 4°C weekly to 22°C by the end of the experiment. The animal care and experimental procedure used in this study conformed to the ethical regulations and guidelines of Konkuk University in Korea.
Sampling and measurements
At the end of the experimental period, after 12 h of feed deprivation, 8 chicks (two chicks of average BW were selected from each pen) from each treatment were sacrificed. Blood was drawn from the jugular vein using a syringe for determining the various blood profiles. The serum was separated from each blood sample by centrifugation and stored at −30°C until use. The concentrations of total cholesterol (Total-C) and the activities of glutamic-oxaloacetic transaminase (GOT) and glutamic-pyruvic transaminase (GPT) in serum were measured according to the colorimetric method using a cholesterol diagnostic-kit (Cholesterol E kit, Asan Pharmaceutical, Korea) and a GOT-GPT assay kit (GOP-GPT assay kit, Asan Pharmaceutical, Korea), respectively. After bleeding, the chicks were humanely slaughtered and then scalded in a hot water bath (60°C for 45 s) and the feathers removed mechanically. The carcass weight was calculated by removing the feathers, blood, head, feet, and organs, except the lungs and kidneys. The carcass yield was expressed as a percentage of live weight. The wings, legs, and breast meat were removed from the carcass and individually weighted. Breast meat from the right side was used to determine pH, shear force, cooking loss, and water holding capacity, whereas breast meat from the left side was used for meat color and sensory evaluation. The pH values of breast meat from each carcass were measured using a pH meter (Model 340, Mettler-Toledo, Switzerland). About 1 g of sample was cut into small pieces and homogenized with 9 mL of distilled water for 60 s in an Ultra-Turrax (Model No. T-25, Janken and Kunkel, Germany). The mean values of 3 measurements from each sample were used. The breast meat color was measured on the surface of samples using a Chromameter (CR210, Minolta, Japan), which was standardized using a white tile. Color for each sample was expressed in terms of Commission International de l’Eclairage values for lightness (L*), redness (a*), and yellowness (b*), which was obtained using the average value of 3 measurements taken from different locations on the meat surface. At 24 h postmortem, 1.5 cm thick steaks of about 30 g were put in a polyethylene bag. The package were heated in a water bath at 80°C for 30 min and cooled at room temperature for 30 min. Cooking loss percentage was determined by use of steak weight taken before and after cooking. Also, 6 representative 1.27 cm diameter cores were removed from each steak parallel to the muscle fiber after cooling. Shear force values were determined with Warner-Bratzler shear attachment on an Instron universal testing machine (Instron Corporation, Canton, MA, USA), with the following operating parameters: load cell, 50 kg, cross-head speed 200 mm/min. Each core sample was sheared once across the center of the core perpendicular to the muscle fiber. The shear force value was the mean of the maximum forces required to shear each set of core samples. Water holding capacity (WHC) was measured by modification of the Grau and Hamm (1953). Briefly, 300 mg sample of breast meat was placed in a filter-press device and compressed for 3 min. Water holding capacity was calculated from duplicated samples as a ratio of the meat film area to the total area. For the sensory evaluation, the breast meats were cooked on a polyethylene bags immersed in an 80°C water bath for 30 min. After cooling for 30 min, the meat samples (2×3×1.5 cm) were placed on coded white dishes and served with drinking water. A panel consisting of 16 people (age range, 22 to 29 years) was assigned to score the consumer preference test including color, flavor, tenderness, juiciness, and overall acceptability. The preference score were evaluated based on a 9-point scale, 1 = extremely undesirable and 9 = extremely desirable.
Statistical analysis
The data were analyzed by ANOVA as a completely random design using the GLM procedure of SAS (SAS, 1986). The model included genotype treatment as fixed variable and period and sex within replication as random variables. If the F-test for treatment effect was significant, differences among treatment means were determined using the Duncan’s multiple range test (Duncan, 1955). The experimental unit was a pen, and significance was determined at α of 0.05.
RESULTS AND DISCUSSION
Growth performance
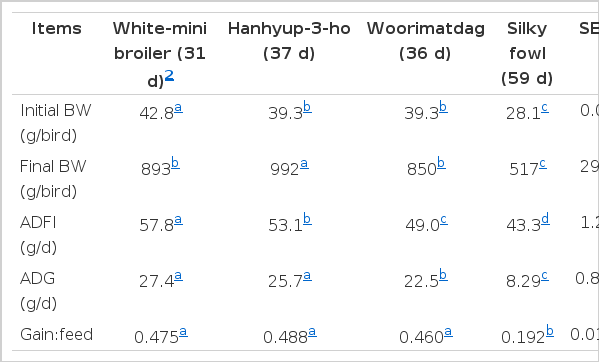
Three breeds of Korean local chicken grew faster and consumed more feed than the silky fowl (p<0.05, Table 2). Within the Korean local breeds, ADFI of white-mini broiler was the highest value (p<0.05, Table 2), and ADG of white-mini broiler and Hanhyup-3-ho was the highest value (p<0.05, Table 2). Sizemore and Siegel (1993) compared the growth performances of slow- and fast-growing types and observed that feed efficiency and weight gain in the fast-growing type were greater than that of slow-growing types. In agreement with present results, local chickens generally presented slower growth rate than that observed in modern commercial breeds (Moujahed and Haddad, 2013).
Gain:feed of silky fowl was less efficient than that of 3 breeds of Korean local chicken (p<0.05, Table 2). Momoh et al. (2010) reported that local chicken presented generally low efficiency of feed utilization. However, gain:feed of 3 breeds of Korean local chicken in present study was superior to that of reported data of local breeds such as Benin-0.18 to 0.26 (Youssao et al., 2012), Nigerian-0.18 to 0.20 (Momoh et al., 2010) and Tunisian local chickens-0.25 (Moujahed and Haddad, 2013).
Genetic progress can be attained either by selection or crossbreeding. Genetic selection has played a significant role in the historical improvement in the production efficiency of broilers, and brought about 85% to 90% of the change that has occurred in broiler growth rate over the past 45 years (Havenstein et al., 2003). For practical breeding, quality chickens were initially produced by direct use of native chicken breeds, which are generally slow-growing chickens with poor feed efficiency (Yang and Jiang, 2005). Breeding for quality chickens in Korea is characterized with crossbreeding between native breeds with outstanding flavor and nutritional value and highly-selected lines (exotic breeds) with rapid growth rate, which is focus on improving growth rate and meat quality while maintaining original appearance characters of native chicken such as plumage, body shape, comb, skin color and so on (Kang et al., 2010; Park et al., 2010a, 2010b). Selecting the best performing crossbred could lead to the production of chickens that will be high in ADG, feed efficiency, reproductive and carcass traits, thereby resulting in reduced production cost (Adebambo et al., 2010). It is assumed that the performances of 3 breeds of Korean local chickens have been greatly improved by crossbreeding.
Blood parameters
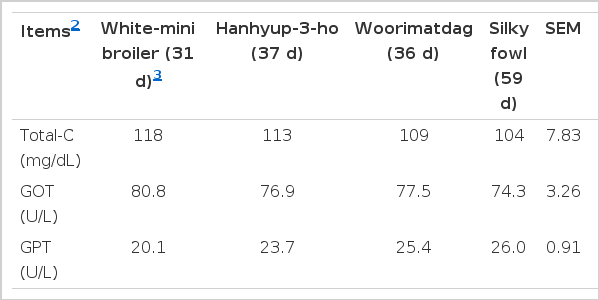
The concentrations of serum total cholesterol were not differed among breeds (Table 3). Also, there were no significant differences in the activities of GOT and GPT (Table 3). Measurement of GOT and GPT activities are indicators of liver damage in chickens (Lumeij, 1997). In our previous studies, the level of GOT and GPT ranged from 166.66 to 279.80 and 9.12 to 14.41, respectively (An et al., 2003, 2007, 2008; Park et al., 2010). The level of GOT and GPT in this study were slightly lower than those of previous studies which have used commercial broilers. Because there is little available knowledge regarding physiological indicators between different genotypes, the interpretation of the present results has been difficult. Further studies are suggested in order to clarify the physiological responses among these local chickens.
Carcass characteristics
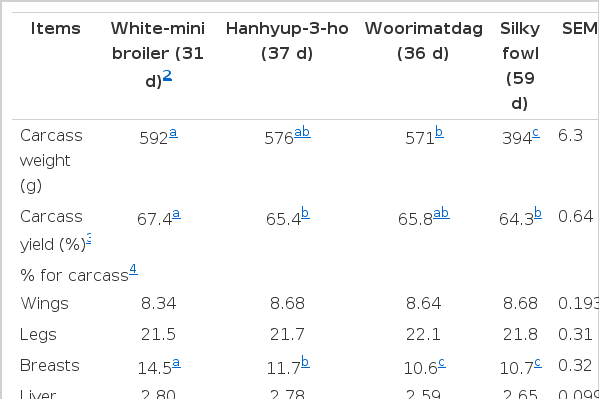
Carcass weight and carcass yield of white-mini broiler were greater than those of the other breeds (p<0.05, Table 4). The carcass yield of silky fowl was slightly lower than that reported for the same breed by Li et al. (2003). The carcass yield of 4 breeds of local chicken was slightly lower than that reported for Italian local chickens (De Marchi et al., 2005) and Benin local chickens (Youssao et al., 2012), and markedly lower than that reported for commercial broilers (Zhang et al., 2010; Panda et al., 2010). There were no significant differences in the relative weights of legs, wings, and liver among breeds (Table 4). Breast yield of white-mini broiler and Hanhyup-3-ho was greater than that of Woorimatdag and silky fowl (p<0.05, Table 4). Nielsen et al. (2003) reported that slow-growing chickens were characterized by a significantly lower breast yield, but higher yield of thigh and drumstick muscles than fast-growing chickens. In a similar study, breast and leg yield of slow-growing chicken ranged from 10.4% to 26.0% and 24.6% to 37.4%, respectively (Lewis et al., 1997; Quentin et al., 2003; N’Dri et al., 2006). Except for the result on leg yield, breast yield of this study are within the range of values cited in the literature.
Carcass weight and carcass yield in the present study was relatively lower than those of other breeds such as Padovana (De Marchi et al., 2005) and Tunisian local chickens (Moujahed and Haddad, 2013). Carcass yield is affected by a number of factors including genetic, feed, slaughtering conditions, live weight and sex (Young et al., 2001; Havenstein et al., 2003; Brickett et al., 2007). In addition, several studies have shown that low live weight has been associated with low carcass yield (De Marchi et al., 2005; Fanatico et al., 2005b; Moujahed and Haddad, 2013). Because 4 breeds of local chicken used in this study were raised under identical rearing and feeding conditions, low carcass yield and parts of our study are attributed to low live weight of chickens.
Meat quality
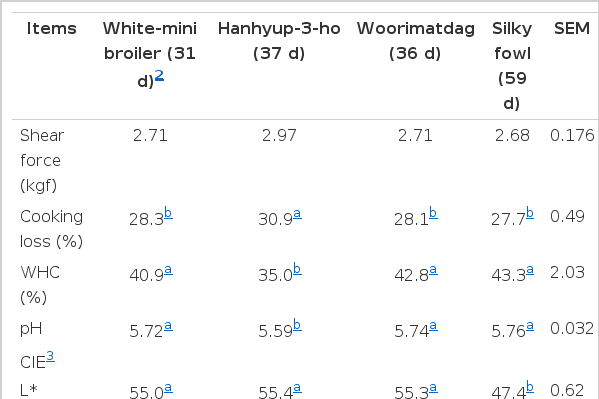
Chicken breast meat generally appears to have a pink color, which is a desirable characteristic for the consumer. Breast meat color of 3 breeds of Korean local chicken was significantly lighter (CIE L*), redder (CIE a*), and yellower (CIE b*) than that of silky fowl (p<0.05, Table 5). Meat color is generally influenced by animal related factors, mainly the genotype (Fletcher, 1995) and the age of animals (Fanatico et al., 2005b). Within the local breeds, silky fowl used in our study is named as Chinese Taihe chicken or black-boned chicken, and meat of black-boned chickens have shown less color value than other genotypes (Jaturasitha et al., 2008), which is assumed to be due to genetic influence.
The breast meat of Hanhyup-3-ho had greater cooking loss (p<0.05, Table 5), whereas WHC and pH values were less than those of other breeds (p<0.05, Table 5). Cornforth (1994) stated that meat with high pH has higher water holding capacity, which results in increased cooking loss and drip loss, and it is in agreement with the present results. The pH values of local chickens in our study are similar to breast meat of Pekin ducks (Kim et al., 2012), broiler chickens (Zhang et al., 2010) and turkeys (Fernandez et al., 2001). Mikulski et al. (2011) investigated the effect of genetic traits of chickens (slow- and fast growing) on growth performance, meat quality and carcass yield and determined that differences in pH values according to genetic type did not occur in breast muscle. The pH value has been associated with numerous other meat quality attributes including tenderness, WHC, cooking loss, juiciness, and shelf life (Allen et al., 1998). Husak et al. (2008) reported that higher meat pH is more effective for retaining desirable color and moisture absorption properties. As well, water holding capacity is an important attribute of meat quality, if WHC is poor, meat and meat products will be lack of juiciness (Gentry et al., 2004). All this might affect sensory characteristics, such as juiciness and tenderness (Dyubele et al., 2010).
Sensory evaluation
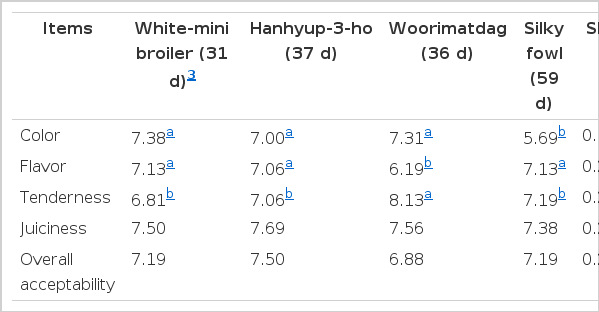
The color score of 3 breeds of Korean local chicken was higher than that of silky fowl (p<0.05, Table 6). Color of chicken meat is important since consumers associate it with the product’s freshness, and hence influences whether or not to buy the product (Yang and Jiang, 2005). Woorimatdag had a higher score for tenderness (p<0.05, Table 6), whereas its flavor score was less than that of other breeds (p<0.05, Table 6). Flavor is a complex attribute of meat palatability (Calkins and Hodgen, 2007), it depends on the combination of several chemical interactions involving proteins, lipids, and carbohydrates (Spanier et al., 1997). In assessing preference for products, the attitudes of consumers should not be ignored (Worch et al., 2010). Moreover, understanding sensory characteristics is crucial in developing new products, markets and evaluating the quality of products (Dyubele et al., 2010). The consumers used in the study were mostly students, therefore, there is need to determine sensory characteristics across different age groups, to ascertain whether local chicken’s meat could be commercialized.
In conclusion, the results of our study indicate that growth performance, carcass characteristics, and meat quality differ among breeds. Compared with silky fowl, the other 3 breeds of Korean local chicken had high growth performances, but the 4 breeds of local chickens each had some unique features when raised under identical rearing and feeding conditions. In addition, this information can help consumers who prefer premium chicken meat.
ACKNOWLEDGEMENT
This study was supported by the Research Center for Export of Poultry Products, Ministry of Agriculture Food and Rural Affairs and Konkuk University.
