Changes of Microbial Population in the Rumen of Dairy Steers as Influenced by Plant Containing Tannins and Saponins and Roughage to Concentrate Ratio
Article information
Abstract
The objective of this study was to investigate microbial population in the rumen of dairy steers as influenced by supplementing with dietary condensed tannins and saponins and different roughage to concentrate ratios. Four, rumen fistulated dairy steers (Bos indicus) were used in a 2×2 factorial arrangement in a 4×4 Latin square design. The main factors were two roughage to concentrate ratios (R:C, 60:40 and 40:60) and two supplementations of rain tree pod meal (RPM) (0 and 60 g/kg of total DM intake). Chopped 30 g/kg urea treated rice straw was used as a roughage source. All animals received feed according to respective R:C ratios at 25 g/kg body weight. The RPM contained crude tannins and saponins at 84 and 143 g/kg of DM, respectively. It was found that ruminal pH decreased while ruminal temperature increased by a higher concentrate ratio (R:C 40:60) (p<0.05). In contrast, total bacterial, Ruminococus albus and viable proteolytic bacteria were not affected by dietary supplementation. Numbers of fungi, cellulolytic bacteria, Fibrobactor succinogenes and Ruminococus flavefaciens were higher while amylolytic bacteria was lower when steers were fed at 400 g/kg of concentrate. The population of Fibrobactor succinogenes, was found to be higher with RPM supplementation. In addition, the use of real-time PCR technique indicated that the population of protozoa and methanogens were decreased (p<0.05) with supplementation of RPM and with an increasing concentrate ratio. Supplementation of RPM and feeding different concentrate ratios resulted in changing the rumen microbes especially, when the animals were fed at 600 g/kg of concentrate and supplemented with RPM which significantly reduced the protozoa and methanogens population.
INTRODUCTION
Manipulation of the ruminal microbial ecosystem to enhance fibrous feed digestibility, reduce methane emission and nitrogen excretion by ruminants to improve their feed utilization is one of the most important goals for animal nutritionists (Patra et al., 2006).
The type of feed offered to a ruminant can have a major effect on rumen fermentation. The types of diet are potential modifiers of ruminal fermentation and may offer a strategy to reduce protozoal and methanogen populations, thus improving the efficiency of feed utilization in the ruminants (Anantasook and Wanapat, 2012). When the ratio of concentrate in the diet was increased methane production decreased by shift of hydrogen from the methane pathway to be used to produce propionate (Poungchompu et al., 2009). Plants containing secondary metabolites and condensed tannins and saponins have shown potential to manipulate rumen fermentation by enhancing the efficiency of utilization of feed energy while inhibiting rumen methane production (Kreuzer et al., 2009; Wang et al., 2009; Mao et al., 2010). Moreover, plant secondary compounds with action against specific microbial groups can be used to inhibit of some undesirable microbes in the rumen. The methanogens classified as Archaea have a distinctly different cell wall structure from true rumen bacteria (Woese et al., 1990). Thus, there exists a possibility that some of the plant secondary compounds might act as a selective inhibitor of methanogens and protozoa. Therefore, recent research has been focused on exploiting plant secondary compounds as natural feed additives to improve rumen fermentation such as enhancing protein metabolism, decreasing methane production (Wallace et al., 2002; Kamra et al., 2008; Chanthakhoun et al., 2011), affecting microbial activity (Patra et al., 2006), increasing reproductive efficiency (Ramirez-Restrepo et al., 2005), reducing nutritional stress such as bloat and improving animal health and productivity (Decandia et al., 2000; Patra, 2007). Thus, the aim of this study was to investigate microbial population in the rumen of dairy steers as influenced by supplementing with dietary condensed tannins and saponins and different roughage to concentrate ratios.
MATERIALS AND METHODS
Animals, diets and experimental design
Four-fistulated Holstein-Friesian crossbred (75%) dairy steers with initial body weight (BW) of 270±15 kg were randomly assigned according to a 2×2 factorial arrangement in 4×4 Latin square design (LSD). The main factors were roughage to concentrate ratio (R:C, 60:40 or 40:60) and supplementation of rain tree (Samanea saman) pod meal or RPM at 0 and 60 g/kg of total DM intake.
Rain tree is a local tree legume; pods of which can be dried and ground into a meal for animal feed (Chareprasert et al., 2006). It contains 23.5% of CP, 18.2% of total sugar and 8.4% of sucrose (Jetana et al., 2008). The RPM was prepared by the following, i) collect rain tree pods with black-brown coloration from ground; ii) chop rain tree pods with chopping machine; iii) sun-dry rain tree pods for two-three days; iv) grind rain tree pods with grinding machine.
The concentrate mixed diets were formulated to be at 140 g/kg DM of CP. All animals received feed according to respective R:C ratios at 25 g/kg body weight and chopped 30 g/kg urea treated rice straw (UTRS) was used as a roughage source. The rain tree pod meal (mixed with concentrate) was supplemented at 0 and 60 g/kg of total DM intake. The ingredients and chemical composition of diets are shown in the Table 1.
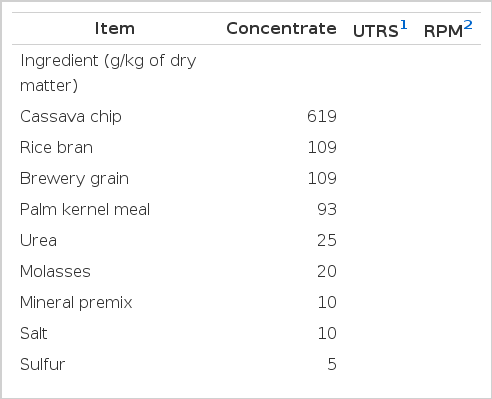
Ingredients and chemical composition of concentrate, urea treated rice straw and rain tree pod meal used in the experiment
All animals were kept in individual pens and received free choice of clean fresh water and mineral block. The experiment was conducted over four periods, each period lasted 21 d. During the first 14 d, all animals were fed their respective diets, whereas the last 7 d, they were moved to metabolism crates for total collection of feces and urine.
Data collection, analysis and sampling procedures
At the end of each period, rumen fluid and digesta were collected at 0, 2, 4, and 6 h-post feeding. Approximately 200 mL of rumen fluid was collected at each time from the middle part of the rumen by using a 60 mL hand syringe. Ruminal temperature and pH were measured using a portable pH and temperature meter (Hanna Instruments HI 8424 microcomputer, Singapore). Rumen fluid samples were then filtered through four layers of cheesecloth. Samples were divided into 3 portions, the first portion was fixed with 10% formalin solution (1:9 v/v, rumen fluid: 10% formalin) for measuring microbial population by total direct count of bacteria, protozoa and fungal zoospores with a hemocytometer (Boeco, Hamburg, Germany) using methods of (Galyean, 1989). The second portion was cultured using a roll-tube technique (Hungate, 1969) for identifying bacteria groups (cellulolytic, proteolytic, amylolytic and total viable bacteria counts). The third portion was stored at −20°C for DNA extraction (Yu and Morrison, 2004). Content of condensed tannins in RPM was analysed by using the modified vanillin-HCl method based on Burns (1971). Crude saponins were measured by using methanol extraction following the method of Kwon et al. (2003) and modified by Poungchompu et al. (2009).
Rumen microbial population
Community deoxyribonucleic acids (DNA) extraction: Community DNA was extracted from 2.0 mL aliquots of each sample by the RBB+C method (Yu and Morrison, 2004). In brief, cell lysis is achieved by bead-beating in the presence of 4% (w/v) sodium dodecyl sulfate (SDS), 500 mM NaCl, and 50 mM EDTA. The buffer should also protect the released DNA from degradation by DNases, which are very active in rumen and gastrointestinal samples. After bead-beating, most of the impurities and the SDS are removed by precipitation with ammonium acetate and then the nucleic acids are removed by precipitation with isopropanol. Genomic DNA can then purified via sequential digestion with RNase A and proteinase K, and the DNA are purified using columns from QIAgen DNA Mini Stool Kit (QIAGEN, Valencia, CA, USA).
Primers and polymerase chain reaction (PCR): The primers used for the real-time PCR were as follows: primers for Fibrobactor succinogenes, Fs219f (5′GGT ATG GGA TGA GCT TGC-3′) and Fs654r (5′-GCC TGC CCC TGA ACT ATC- 3′), were selected to allow amplification (446-bp product) of all 10 F. succinogenes strains. For Ruminococcus albus primers, Ra1281f (5′-CCC TAA AAG CAG TCT TAG TTC G-3′) and Ra1439r (5′ CCT CCT TGC GGT TAG AAC A- 3′) (175-bp product). Ruminococcus flavefaciens primers, Rf154f (5′-TCT GGA AAC GGA TGG TA-3′) and Rf425r (5′- CCT TTA AGA CAG GAG TTT ACA A-3′), were also selected to allow species-species amplification (295 bp) of all seven R. flavefaciens strains deposited in GenBank. All these primer sets were previously published by Koike and Kobayashi (2001). For methanogens primers, forward primers (5′-TTCGGTGGATCDCARAGRGC-3′) and reverse primers (5′-GBARGTCGW- AWCCGTAGAATCC -3′) were employed as described by Denman et al. (2005). Regular PCR conditions for F. succinogenes were as follows: 30 s at 94°C for denaturing, 30 s at 60°C for annealing and 30 s at 72°C for extension (48 cycles), except for the 9 min denaturation in the first cycle and the 10 min extension in the last cycle. Amplification of 16S rRNA gene for the other two species was carried out similarly except an annealing temperature of 55°C was used. The PCR conditions for methanogens were as follows; 30 s at 94°C for denaturing, 30 s at 58°C for annealing and 90 s at 72°C for extension (35 cycles) (Wright et al., 2004). Quantification of total bacteria population, primer and condition, was previously published by Kongmun et al. (2010).
Real-time PCR: The targeted bacteria were cellulolytic bacteria (F. succinogenes, R. albus and R. flavefaciens), methanogenic bacteria and protozoa. To establish a quantitative assay, specific primers and PCR conditions as described previously were used to amplify target 16s rDNA of each species. The purified DNA was quantified by spectrophotometry with multiple dilutions. The target DNA was quantified by using serial 10- fold dilutions from 101 to 108 DNA copies of the previously quantified DNA standards. Real-time PCR amplification and detection were performed in a Chromo 4 system (Bio-Rad, USA). In brief, Biostools QuantiMix Easy SYG Kit was used for PCR amplification samples were assayed in duplicate in a 20 μL reaction mixture contained 4 to 6 mM MgCl2, 10 μL of Master mix (including; Taq DNA polymerase, reaction buffer, dNTP mixture, MgCl2 and SybrGreen), 2 μL of DNA template, and 0.8 μL of each primer (10 μM/μL).
External standards for real-time PCR were prepared from a simulated rumen matrix. For each standard, linear regressions derived from the threshold cycle [C(t)] of each DNA dilution versus the log quality (Figure 1) were calculated. Logarithms of the DNA concentration (copies/mL) were plotted against the calculated means (Figure 1), obtaining a straight line of equations y = −0.3311x+11.61, y = −0.2557x+11.56, y = −0.4427x+12.08, y = −0.3196x+11.36, y = −0.3122x+10.55 and y = −0.2698x +12.02 (where y is the log of DNA concentration and x is the Ct), with a linear correlation coefficient (r2) of 0.992, 0.993, 0.994, 0.995, 0.997, and 0.991 for total bacteria (Figure 1a), F. succinogenes (Figure 1b), R. flavefaciens (Figure 1c) and R. albus (Figure 1d), methanogens (Figure 1e) and protozoa (Figure 1f), respectively. These equations were used to quantify DNA from rumen digesta samples. The accuracy of each real-time PCR was validated by quantifying known numbers of target species templates (total bacteria, F. succinogenes, R. flavefaciens and R. albus, methanogens and protozoa).
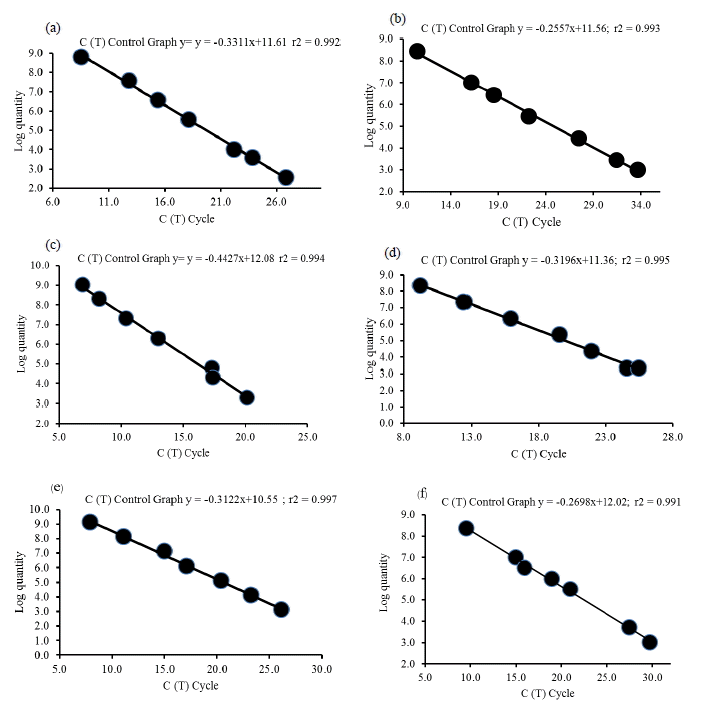
The standard curves obtained by plotting the logarithm of DNA concentration for total bacteria (a), F. succinogenes (b), R. flavefaciens (c), R. albus (d) methanogens (e) and protozoa (f) versus threshold cycle (Ct) for population quantification by using real time PCR.
Statistical analysis
All data were analyzed as a 2×2 factorial arrangement in a Latin square design (LSD) using the general linear procedure in PROC GLM of SAS (1996). The statistical model included terms for R:C ratio, supplementation of RPM, and interactions between R:C ratio and supplementation of RPM. Differences between treatment means were determined by Duncan’s New Multiple Range Test (Steel and Torrie, 1980).
RESULTS AND DISCUSSION
Chemical composition of diets
Experimental feeds and their chemical compositions are shown in Table 1. The mixture of concentrate, consisting of available local feed resources such as energy source (cassava chips and rice bran), protein sources (brewery grain and palm kernel meal) and non-protein nitrogen (urea), had a higher quality in terms of CP and low in fiber (142 and 181 g/kg of DM, respectively). The RPM contained 164, 84 and 143 g/kg of DM of CP, crude tannins (CT) and crude saponins (CS), respectively. Anantasook et al. (2013) also found that CT and CS content of RPM were 84 and 143 g/kg of DM, respectively. However, Jetana et al. (2010) reported that tannin values in the rain tree pod were 79 g/kg of DM. The nutritive value of rice straw was improved in terms of CP by treatment with 30 g/kg of DM of urea. The CP and NDF content of 30 g/kg urea treated rice straw were 55 and 730 g/kg of DM, respectively. This roughage source was well consumed by animals during the experimental periods.
Effect on ruminal pH, temperature and NH3-N
In the present study, the ruminal pH, temperature and NH3-N were affected by R:C ratio and RPM supplementation as presented in Table 2. The result showed that ruminal pH at 6 h-post feeding was decreased with an increased level of concentrate in the diet. Similarly, Gaafar et al. (2009) and Cherdthong et al. (2010) found that diets containing 60% or more concentrate usually caused a marked reduction in ruminal pH. However, the animals did not show clinical signs of acidosis under this study. Van Soest (1994) suggested that a rumen pH below 6.2 inhibited the rate of digestion and depressed cellulolytic activity. Ruminal temperature was found higher in the treatment with R:C at 40:60 due to the rapid fermentation rate of high concentrate in the diet. However, the values were stable at 38.8 to 39.3°C and similar to the result reported by Cherdthong et al. (2010). Moreover, NH3-N concentration in the high concentrate ratio fed group was higher than those fed with the lower ratio, (24.1 and 22.8 mg/dL for T3 and T4, respectively) and this result was similar to those of Gaafar et al. (2009) and Flachowsky et al. (2006). The differences may be due to a higher enzymatic breakdown of the dietary soluble fraction in high ratio of concentrate. Condensed tannins in the diet have beneficial effects in mediating protein-tannin complexation, decreasing availability of feed protein for ruminal degradation and NH3-N release as found by Makkar (2003). However, in contrast to the present study, the ruminal concentration of NH3-N was not affected by RPM supplemented treatments.
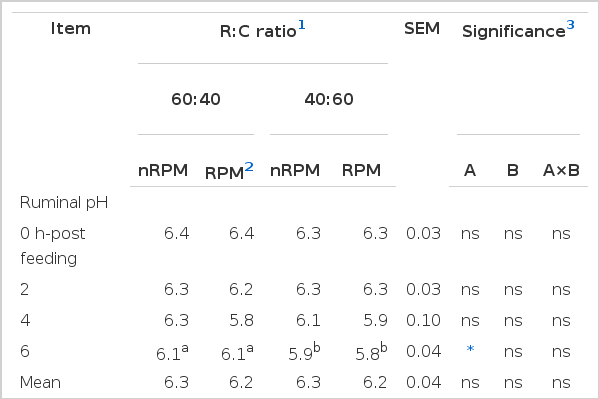
Effect of roughage to concentrate ratio and rain tree pod meal supplementation on ruminal pH, temperature, ammonia nitrogen and blood urea nitrogen concentration
Effect on rumen microorganism population
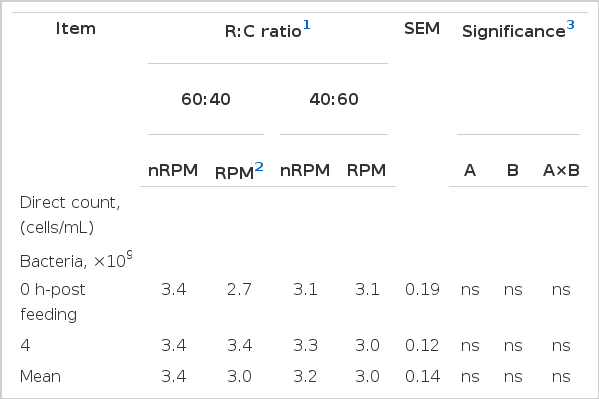
The numbers of total bacteria, R. albus (Table 4) and bacteria and fungi count, viable proteolytic bacteria (Table 3) were not affected by RPM supplementation. Pilajun and Wanapat (2012) also reported that supplementation with tannins and saponins rich-plants did not change the microbial population in swamp buffalo. However, other studies have demonstrated that plants containing tannins and saponins have antimicrobial properties (Patra and Saxena, 2009; Manasri et al., 2012). The inhibitory activity of tannins against bacteria has been linked to the ability of tannins to form complexes with the cell wall and membrane of bacteria causing morphological changes of the cell wall and the extracellular enzymes secreted (Jones et al., 1994). Different results obtained by these authors could be due to the different sources of diets, dose of tannins, animal type, feeding program and environmental conditions between the previous studies and the present work. In contrast, the number of fungal zoospores were decreased (p<0.05) with increasing concentrate ratio feeding (R:C 60:40). The results obtained could be due to less fiber and a lower pH which would decrease fiber digestibility (Cherdthong et al., 2010).
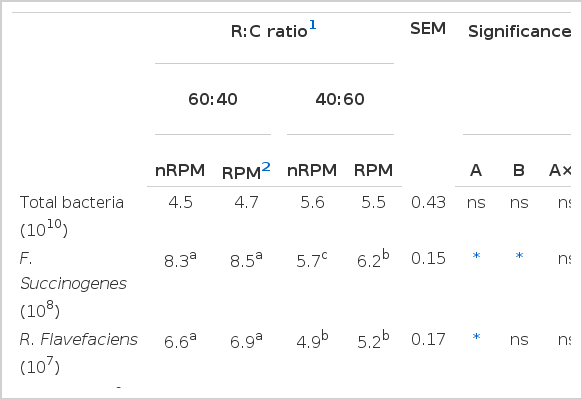
Effect of roughage to concentrate ratio and rain tree pod meal supplementation on microbial population using real-time PCR techniques (copies/mL of rumen content)
Effect of roughage to concentrate ratio and rain tree pod meal supplementation on microbial population in the rumen
Furthermore, the use of real-time PCR technique found that the population of F. succinogenes and R. flavefaciens (Table 4) and viable cellulolytic and amylolytic bacteria (Table 3) were significantly different, responding to the level of roughage. As the results showed, the population of cellulolytic bacteria, F. succinogenes and R. flavefaciens in R:C at 60:40 were higher, while amylolytic bacterial was lower than R:C at 40:60. Similarly to Anantasook and Wanapat (2012) who reported that the numbers of the three cellulolytic bacteria decreased with increased concentrate ratio in the diet. Moreover, Cherdthong et al. (2010) reported that R:C ratio of 75:25 could increase the cellulolytic bacteria while the amylolytic bacteria population was decreased. It is possible that dietary conditions might have influenced the reduced numbers of cellulolytic bacteria (Wanapat and Cherdthong, 2009). Moreover, rumen pH has been suggested as a factor governing bacterial attachment (Miron et al., 2001). Animals feeding on a high concentrate diet were affected with a decline of ruminal pH, which was attributed to the inhibition of cellulolytic bacteria, since most ruminal cellulolytic bacteria are pH-sensitive (Russell and Wilson, 1996). The pH sensitivity can be explained by the intracellular pH regulation of cellulolytic bacteria. When the extracellular pH of acid-sensitive bacteria declines, the intracellular pH is relatively stable. While the increase in the transmembrane pH gradient causes a logarithmic accumulation of intracellular fermentation acid anions and hence leads to anion toxicity and product inhibition (Russell and Wilson, 1996). Furthermore, the population of F. succinogenes, was found to be higher with supplementation by RPM, presumably as a consequence of the suppression of protozoal and methanogens numbers. Kurihara et al. (1968) reported that a decrease in bacterial numbers may be caused by the above mentioned predation of protozoa on the bacteria. Therefore, rumen bacterial population could be maintained due to a decreased protozoal population.
Feeding a high concentrate and supplementing with RPM decreased the protozoal (Tables 3 and 4) and methanogens population (Table 4). Van Soest (1982) found that feeding high concentrate diet could reduce the protozoal population. Similarly to Mackie et al. (1978) who reported that protozoal concentrations usually begin to decrease when the level of concentrate exceeds 60%. In contrast with Cherdthong et al. (2010) who found that protozoal populations were linearly increased with an increasing level of concentrate. While, Anantasook and Wanapat (2012) reported that the population of methanogens in the total bacterial population decreased with an increasing level of concentrate and RPM supplementation. Poungchompu et al. (2009) also found that the percentage of methanogens in ruminal decreased with feeding high concentrate. Moreover, protozoal numbers were decreased with the addition of tea saponin at 0.4 mg/mL (Goel et al., 2008), and supplementation with RPM (Anantasook and Wanapat, 2012). Furthermore, plants containing tannins and saponins could reduce methanogens as reported by Bhatta et al. (2009) and Animut et al. (2008). The action of condensed tannins are thought to directly inhibit methanogens (Tavendale et al., 2005), while saponins have been shown in vitro to inhibit protozoa as well as limit hydrogen availability for methanogensis (Guo et al., 2008). Wallace et al. (2002) indicated that saponins might kill or damage protozoa by forming complexes with sterols in the protozoal membrane surface. The membrane may become impaired and eventually disintegrate. Nevertheless, several reports showed no effect of plant containing tannins and saponins on protozoa and methanogen numbers (Wina et al., 2005; Norrapoke et al., 2010; Pilajun and Wanapat, 2012).
CONCLUSIONS AND RECOMMENDATIONS
Supplementation of RPM at 60 g/kg of total DM intake and feeding different concentrate ratios resulted in changing the rumen microorganisms, especially, when animals were supplemented with RPM, which significantly reduced protozoa and methanogens population. Results obtained herein could be used in manipulating the rumen fermentation in ruminants.
Acknowledgements
The authors express sincere thanks to the Tropical Feed Resources Research and Development Center (TROFREC), Department of Animal Science, Faculty of Agriculture, Khon Kaen University, The Office of the Higher Education Commission and Thailand Research Fund (TRF) through the Royal Golden Jubilee PhD Program for providing financial support for the research and use of research facilities. In addition, thanks are extended to the Agricultural Biotechnology Research Center, Khon Kaen University for the permission to perform real-time PCR analysis and for technical support.