Effects of different dietary ratio of metabolizable glucose and metabolizable protein on growth performance, rumen fermentation, blood biochemical indices and ruminal microbiota of 8 to 10-month-old dairy heifers
Article information

Abstract
Objective
The aim of this experiment was to evaluate the effects of different dietary ratio of metabolizable glucose (MG) to metabolizable protein (MP) on growth performance, blood metabolites, rumen fermentation parameters and the ruminal microbial community of 8 to 10-month-old heifers.
Methods
A total of 24 Holstein heifers weighing an average of 282.90 kg (8 month of age) were randomly assigned to four groups of six. The heifers were fed one of four diets of different dietary MG/MP (0.97, 1.07, 1.13, and 1.26).
Results
The results showed that the ratio of MG/MP affected the growth performance, blood metabolites, rumen fermentation parameters and the ruminal microbial community of heifers. The average daily gain of heifers was enhanced by increasing the ratio of MG/MP (p<0.05). The concentration of blood urea nitrogen, cholesterol, and low density lipoprotein cholesterol as well as the concentration of total volatile fatty acid in the rumen fluid of heifers decreased with the improvement in the ratio of dietary MG/MP (p<0.05). However, the relative amount of Ruminococcus albus and Butyrivibrio fibrisolvens in the rumen of heifers was increased significantly (p<0.05) when the dietary MG/MP increased. At the same time, with the improvement in dietary MG/MP, the amount of Fibrobacter succinogenes increased (p = 0.08).
Conclusion
A diet with an optimal ratio (1.13) of MG/MP was beneficial for the improvement of growth, rumen fermentation, dietary protein and energy utilization of 8 to 10-month-old dairy heifers in this experiment.
INTRODUCTION
A cow from birth to their first calf delivery is usually called a heifer [1]. Heifers play an important role in the dairy industry. The period in which cows are heifers lasts 22 to 27 months, and the cost of heifers accounts for 20% of the total animal costs [2]. So much importance is attached to the breeding of heifers in developed countries that the delivery date is controlled within 14 months and the milk production goes beyond 8 tons [3]. However, heifer rearing has not attracted enough attention for most dairy herd management in China. Because of the lack of experience and related feeding guidance, the delivery date of heifers was longer and the milk production was lower. Therefore, a proper assessment and evaluation of the feeding of heifers and recommendations for diet formulation are required. Nutritional factors are one of the most important factors that affect the breeding of heifers, and protein and energy content as well as their balance in a heifer’s diet cannot be ignored [4].
Dietary nutrient density and structure between birth and puberty are critical for growing heifers. Of all the dietary nutrients, glucose metabolism in ruminants is very different from mono-gastric animals. The sources of glucose in ruminants were derived from dietary rumen bypass nutrition as well as endogenous syntheses from propionate and recycled glucogenic amino acids. There was some evidence that the efficiency of nitrogen in a low protein diet was improved by increasing dietary carbohydrates [5]. The utilization efficiency of diets was improved by increasing the level of carbohydrates (C3+C6) in the diets [6]. Ruminants provided with exogenous glucose can reduce the synthesis of endogenous glucose, which contributes to conserving glucogenic amino acids [7]. Li et al [8] reported that the utilization efficiency of nitrogen was improved greatly by pouring glucose into the abomasum. A novel index based on ruminant glucose metabolism called metabolizable glucose (MG) was proposed initially by Lu [9]. It is essential to study the dietary levels of MG to provide suitable energy for heifers.
Growing heifers require protein to support maintenance, growth and pregnancy. Unbalanced dietary protein is not only a waste of resources but also leads to an increase in environmental pollution [10]. Because the rumen contains enzymes, dietary protein has been divided into rumen degradable protein (RDP) and rumen undegradable protein (RUP). RDP is utilized by rumen microbes and generates rumen microbial protein (MCP). As such, metabolizable protein (MP) consists of RUP, MCP and little endogenous protein. Feng [11] suggested that adding extra RUP to meet the requirements of MP for high productivity was necessary. The potential for increased growth rates to reduce age at first calving should be fulfilled by increasing crude protein (CP) intake. Therefore, the ratio of CP to energy should be higher for rapidly growing heifers [12]. The new NRC [13] guidelines for protein relative to energy seemed to be adequate for optimal mammary development of heifers [4]. Until now, less information was available on the synergistic interactions between MG and MP for growing dairy heifers. So the most suitable energy and protein requirements of heifers can be measured by the combination MG with MP. Therefore, the objective of this experiment was to attempt to determine the effect of four diets consisting of different dietary MG/MP ratios on the growth performance, blood metabolites, rumen fermentation parameters, and the rumen microbial community as well as the optimal dietary MG/MP level for 8 to 10-month-old heifers.
MATERIALS AND METHODS
Experimental design
Animal care and procedures were approved under established standards by the Committee of Yangzhou University on Animal Care and Ethics (20140510). Twenty-four Holstein heifer calves with similar genetic merits, age (8 months), and body weight (282.90±17.93 kg; mean±standard deviation) were randomly assigned to four treatments. All heifers were housed and managed at the Yangzhou University experimental farm. Heifers were fed one of four diets, which were chemically identical but included different ratios of MG/MP, as shown in Table 1. Feed bunks were located along the front of each indoor pack area. Water was freely available to the heifers through a water bowl in each pen. Total mixed rations were fed at 0800 hours and 1700 hours to ensure ad libitum consumption. According to the leftover diets and body weight, a 10% increase was added every 15 days. An adjustment period of 15 days allowed the heifers to adjust to the diets, and the experimental period was 60 days.
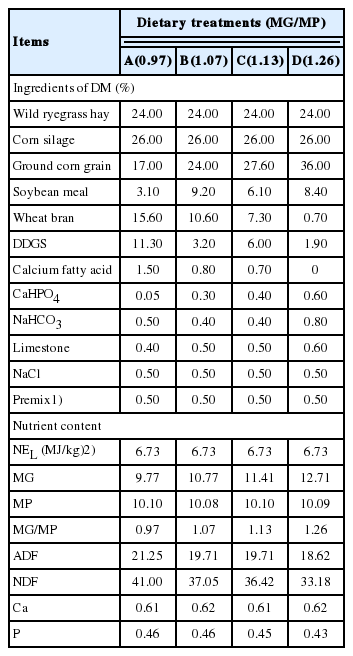
Dietary ingredients used, final chemical compositions and nutrient levels of the four diets fed to 8 to 10-month-old heifers
Feeds and diets
Diets were formulated to meet the nutrient requirements of heifers according to NRC [13] (Table 1). The diets consisted of 50% forage and 50% concentrate (DM basis). The MG level of ingredients was calculated with the formula proposed by Lu [9]:
Where POEG refers to the glucose that was generated from propionic acid in the rumen, BESG refers to the glucose provided by ruminant bypass starch, k1 refers to the absorptivity of propionic acid in rumen, Pr refers to the yield of propionic acid in rumen, k2 is the absorptivity of ruminal bypass starch in the intestine and BS refers to the amount of ruminal bypass starch. k1 was measured according to the method of Han et al [14], using a gas chromatograph (GC-17 A, Shimadzu, Tokyo, Japan), with a 15-m Supelco Nukol silica capillary column. The value of Pr equals the concentration of propionic acid times rumen liquid volume. k2 and BS were measured with the nylon bag method of Lan et al [15]. First collecting ruminant bypass residue, then putting nylon bag with small intestinal fluid freeze dried powder and ruminant bypass residue into McDougall buffer at 39°C for analysis. The MG levels of ground corn grain, soybean meal, wheat bran, distillers dried grains with solubles (DDGS), corn silage and wild ryegrass hay were 25.60, 8.22, 9.45, 10.08, 5.69, and 4.46, respectively. The MG levels of the four diets were weighted data results, they were calculated based on the MG levels of the ingredients.
The MP levels of the ingredients were calculated by the formula proposed by NRC [13]:
MCP was estimated with a formula according to NRC [13], MCP (%) = 0.91×ME (MJ/kg). Crude protein was measured with a FOSS N Analyzer (KT260, Foss Co., Hilleroed, Denmark). RUP was measured via the nylon bag method [16] in three Holsten cows with permanent fistulas from the Yangzhou university experimental farm. Putting nylon bag with an ingredient into rumen abdomen sac after feeding 2 h, the ingredient was freeze-dried, milled to coarse powder and fitted with 2.5 mm screen. Taking the nylon bag out at 2, 6, 12, 16, 24, 36, 48 h to measure proportion of decomposition. The MP levels of ground corn grain, soybean meal, wheat bran, DDGS, corn silage and wild ryegrass hay were 11.43%, 21.39%, 9.33%, 20.52%, 7.85%, and 7.01%, respectively. The MP levels of the four diets were weighted data results. They were calculated by the MP level of the ingredients. Our previous study demonstrated that the most suitable dietary MP level for 8 to 10-month-old heifers was 10.09% [17], so the MP levels in this experiment were 10.09% approximately and remained the same in the four diets.
Feed intake and growth measurements
Intakes of each heifer were recorded daily throughout the study period by weighing the amount of feed supply and refused. Feed samples were analyzed for dry matter (DM) with oven drying at 65°C for 48 hours. These data were used to calculate daily dry matter intake (DMI). DMI was calculation of amount of supply subtracts the refused. At the beginning (the first day), middle (the thirtieth day), and final day (the sixtieth day) of the trial, all heifers were weighed and measured for body height, body length, heart girth, abdominal girth and rump length using a measuring tape and a measuring stick.
Blood metabolite measurements
Blood was collected in approximately 10 mL samples from each heifer via venipuncture 1 h after the morning feeding at final day (the sixtieth day) of the trial. The blood samples were centrifuged at 3,000×g for 10 minutes, and the serum was transferred to 5 mL centrifuge tubes. Concentrations of glucose (GLU), blood urea nitrogen (BUN), cholesterol (CHOL), triglycerides, high density lipoprotein cholesterol (HDL-C), and low density lipoprotein cholesterol in serum were measured with a Synchron Clinical System Autoanalyzer (DXC800, Beckman Company, Topeka, KS, USA) using bovine kits purchased from Beckman.
Determination of rumen fermentation parameters
Rumen contents were sampled with an esophageal tube vacuum pump sampling device (Anscitech Company, Wuhan, China) two hours after the morning feeding 15 and 45 d into the experimental period. Approximately 50 mL of rumen digesta was collected after removing saliva from the top of sampling bottle and then filtered through four layers of cheesecloth to obtain strained rumen fluid. The pH of the rumen fluid was measured immediately after collection using a handheld pHS-3C meter (BaoJing Co., Zhengzhou, China). The rumen ammonia concentration was measured by the method of Broderick and Kang [18]. Rumen fluid was filtered, centrifuged and 25% metaphosphoric acid solution was added before sample introduction. Concentrations of acetic acid, propionic acid, isobutyric acid, butyric acid, isovaleric acid, and valeric acid were measured by Headspace gas chromatography (7890A-G1888, Agilent Technologies Inc., Palo Alto, CA, USA). The temperature of the injection port was set to 220°C, and the detector temperature was 250°C. Temperature programming of the column included an initial temperature of 60°C that was heated up at a speed of 20°C/min to 190°C, then maintained for 3 minutes.
Determination of the relative amount of the rumen microbial community
The DNA of the rumen microbes was extracted with a repeated freeze-thaw method [19]. The DNA concentrations of rumen microbes were measured by a Relative Quantification Applied Biosystems 7500 Fast Real-Time PCR System (Applied Biosystems Inc., Waltham, MA, USA) using bovine kits purchased from Tiangen (FP205, Tiangen Biotech (Beijing) Co., LTD, Beijing, China). The relative amounts of the target gene were calculated using the 2−ΔΔCt method [20]. The gene primer sequences of the rumen microbes for real-time polymerase chain reaction are shown in Table 2.

Primer sequences for polymerase chain reaction of rumen bacteria
Statistical analysis
All data were analyzed using PROC MIXED in SAS (version 9.1, SAS Institute, Inc., Cary, NC, USA). In the model, heifers were the random effect and the four diets with different MG/MP were the fixed effects. Polynomials were constructed and degrees of freedom were determined by the Kenward-Roger method, as reported by Littell et al [21]. All data were presented as least squares means with their standard error of the mean throughout. Significance was considered at p<0.05, and a trend was considered to exist if 0.05<p≤0.10 using Duncan’s new multiple range test.
RESULTS AND DISCUSSION
Body growth and development of the heifers
Dairy heifer growth body size and average daily gain (ADG) at the first calving are regarded as an important management target for the future of heifers because both can affect future milk yield potential [22]. In the current trial, the ADG of heifers increased as the dietary MG/MP increased (p<0.05) (Table 3). And there were no significant (p>0.05) effects of the treatments on DMI, initial body weight (BW) and final BW. Heifers could achieve daily BW gains of approximately 1,000 g from 100 to 300 kg BW without a negative effect on future milk yield if the intakes of CP were in the range of 90% to 100% of the NRC [23] recommendations [24]. The reason for increasing BW could be explained based on the fact that a balance between glucose and amino acids in the diet is critical factor for growing heifers. Amino acid nutritional status may depend on the status of glucose supply in ruminants. Thus, only when the energy supply was matched, can amino acids be used for protein synthesis [25]. Sun et al [26] reported that an optimal MG/MP equilibrium value was 1.07 for growing goats. And Su [27] reported that increasing dietary MG/MP can increase the portal amino acid flux in the livers of goats as well as the synthesis efficiency of muscle protein and the deposit efficiency of total nitrogen. In this study, the maximal ADG was obtained when the dietary MG/MP is 1.13, and we found different MG/MP ratios and ADG values were strongly correlated (ADG = −13.626+25.302(MG/MP)–10.962(MG/MP)2, r2 = 0.864, p<0.05). Thus, we suppose the optimal MG/MP equilibrium value for 8 to 10-month-old heifers might be 1.13. There was no differences among the treatments in terms of body length, body height, and heart girth as well as other performance indices (p>0.05), and the reason for this might be that the skeletons of heifers grow slowly after nine months of age [1]. Some studies showed that the MG level in the diet had no significant effect on the BW and DMI, but it may promote the ADG of heifer herds [28]. The present study obtained similar results and DMI was not significantly affected by MG/MP ratio in the diet; this is probably a result of the same MP value we provided.

Effects of increasing dietary MG/MP ratio on growth performance and DMI of 8 to 10-month-old heifers
Blood biochemical indices
No effects were observed on GLU concentrations as dietary MG/MP increased, which is shown in Table 4. The reason for this outcome might be that insulin can regulate the glucose level of plasma and remain relatively stable. Murphy et al [29] reported no difference in serum glucose, but observed a lower insulin concentration throughout the feeding period for ad libitum-fed steers whose intake was restricted 30%. Jenny and Polan [30] observed elevated plasma glucose and insulin in cows fed a high-concentrate diet compared with sheep and cows fed a low-concentrate diet. But in this research, insulin concentration was not measured. We still require further work on serum hormone. The concentration of BUN in Group C was significantly lower than the other three groups (p<0.01). BUN was an indicator of protein metabolism, and a lower concentration of BUN suggested a higher efficiency of protein synthesis in the body [31]. In present study, it could be that dietary MG/MP = 1.13 achieved amino acid balance, so it presented a lowest BUN vaule. The balance between glucose and amino acids in the diet is very important for growing heifers. The amino acid nutritional status may depend on not only the status of glucose supply, but also amino acid composition in MP. The another problem with this approach is that it fails to take MP into account, some related problems needed to be studied deeply in future. To transport CHOL to cells throughout the body, and finally to the liver for bile acid synthesis is the main physiological functions of HDL [32]. Increasing dietary MG/MP linearly decreased the concentrations of CHOL and HDL-C (p<0.01). The reason for this result might be that higher dietary MG/MP can promote the secretion of insulin, which can inhibit the metabolic factors in the pituitary and decrease the concentrations of CHOL and HDL-C in the serum [11].

Effects of increasing dietary MG/MP ratio on blood biochemical indices of 8 to 10-month-old heifers
Rumen fermentation parameters
Ruminal pH reflects the balance between organic acid production in the rumen and acid removal through neutralization and absorption within the rumen [33]. As showed in Table 5, ruminal pH in the heifers ranged from 7.04 to 7.15, which was far from subacute rumen acidosis (range from 5.2 to 5.6). Rumen NH3-N is the degradation product of protein and non-protein N and is used for bacterial protein synthesis. Satter and Slyter [33] reported that the critical NH3-N concentration for microbial growth is 6 to 30 mg/dL; otherwise, the uncoupling effect of rumen fermentation will decrease the amount of microbial protein synthesis. In the present study, the difference of NH3-N concentrations in the four treatments were not obvious, indicating that the degradations of feed protein were similar among the four. Rumen volatile fatty acid (VFA) concentration reflects an integrated balance of organic acid, which is affected by the production, absorption, and turnover rate in the rumen [34]. Increasing dietary MG/MP linearly (p<0.05) decreased the concentrations of total VFA, while there were no differences in the molar ratios of all VFAs (p>0.05). Nocek et al [35] reported that starch and soluble saccharides were fermented in the rumen, which contributed to the quick accumulation of VFA. VFA can provide carbon skeletons for rumen microbes to synthesize MCP [36]. MCP accounted for 60% to 80% of the total protein in the intestine. When MG/MP was 1.13, the ADG of heifers was the quickest (Table 3), and the concentration of VFA was the lowest (Table 5). That’s because it made VFA utilization rate high in treatment C, and enhanced the MP synthesis. It also indicated that best dietary efficiency was maintained at this MG and MP ratio. Acetate to propionate ratio (A/P) and the ratio of non-glucogenic fatty acid to glucogenic fatty acid ratio (NGR) are two important indicators, which may decide the rumen fermentation pattern [37]. In this experiment, there was no significant difference in A/P and NGR. It confirmed that different MG/MP could not change the rumen fermentation pattern.

Effects of increasing dietary MG/MP ratio on concentrations of rumen fermentation parameters of 8 to 10-month-old heifers
The relative amount of rumen microbes
Increasing dietary MG/MP increased the relative amount of Butyrivibrio fibrisolvens and Ruminococcus albus (p<0.05) (Table 6). There was a trend (p = 0.08) that as dietary MG/MP increased, an increase in the relative amount of Fibrobacter succinogenes was also observed. Ruminococcus albus, Ruminococcus flavefaciens and Fibrobacter succinogenes are regarded as the three major cellulose-decomposing bacteria [38]. Ruminococcus flavefaciens is even considered to be the strongest cellulose-decomposing bacteria [39]. In Table 1, acid detergent fiber (ADF) and neutral detergent fiber (NDF) content were lowered by increasing MG/MP ratios. Thus we speculate readily fermentable carbohydrates influenced the number of bacteria in the rumen. In the present study, the apparent digestibility of DM, CP, NDF, and ADF should be measured to support our hypothesis. Maeng et al [40] reported that the main effect of peptides for rumen bacteria is to increase the proliferation rate of ruminant bacteria and shorten the bacterial cell cycle. We speculate the reason for the increase in the number of cellulose-decomposing bacteria also might be caused by the improvement in the concentrations of peptides in the rumen. However, peptides content was not measured in this research, future researches should take it into account. No other differences were observed for Streptococcus bovis (protein-degrading bacteria). The reason for this result might be that the growth of protein-degrading bacteria might be affected by several factors.
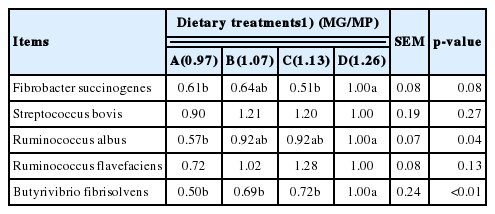
Effects of increasing dietary MG/MP ratio on the relative amounts of rumen microbes in 8 to 10-month-old heifers
CONCLUSION
The results of this study indicate that changing dietary MG/MP resulted in improvement of ADG in heifers. A maximal growth rate for heifers that were between 8 to 10 months of age was achieved when dietary MG/MP was 1.13. The increasing dietary MG/MP increased the number of cellulose-decomposing bacteria. It was concluded that an optimal dietary MG/MP level was 1.13 for 8 to 10-month-old dairy heifers in this experiment, which contained a suitable amount of dietary protein and energy to maintain a synchronous state and lead to a higher efficiency of dietary protein and energy utilization in heifers. This finding will enhance current knowledge and help establish additional alternative dietary recommendations for dairy replacement heifers.
ACKNOWLEDGMENTS
The authors would like to acknowledge the funding received to conduct this study from the project funded by the Top Talent Award Plan of Yangzhou University (2016), the National Science and Technology Support Program (12th Five-Year Plan), the Ministry of Science and Technology of China (Grant No. 2012BAD12B02-2) and the Priority Academic Program Development of Jiangsu Higher Education Institutions (PAPD). The authors would like to express their gratitude to the staffs at the Yangzhou University Experimental Farm for providing dairy heifers for this experiment. We also grateful to our colleagues, Ms Beibei Jiang, Mr. Yizhao Shen, Ms Huihui Cui, Mr Yu Pi and Mr Jian Gao at ruminant laboratory of YZU for their assistance with sampling and data analysis.
Notes
CONFLICT OF INTEREST
We certify that there is no conflict of interest with any financial organization regarding the material discussed in the manuscript.