Acidification of pig slurry effects on ammonia and nitrous oxide emissions, nitrate leaching, and perennial ryegrass regrowth as estimated by 15N-urea flux
Article information

Abstract
Objective
The present study aimed to assess the nitrogen (N) use efficiency of acidified pig slurry for regrowth yield and its environmental impacts on perennial ryegrass swards.
Methods
The pH of digested pig slurry was adjusted to 5.0 or 7.0 by the addition of sulfuric acid and untreated as a control. The pig slurry urea of each treatment was labeled with 15N urea and applied at a rate of 200 kg N/ha immediately after cutting. Soil and herbage samples were collected at 7, 14, and 56 d of regrowth. The flux of pig slurry-N to regrowth yield and soil N mineralization were analyzed, and N losses via NH3, N2O emission and NO3− leaching were also estimated.
Results
The pH level of the applied slurry did not have a significant effect on herbage yield or N content of herbage at the end of regrowth, whereas the amount of N derived from pig slurry urea (NdfSU) was higher in both herbage and soils in pH-controlled plots. The NH4+-N content and the amount of N derived from slurry urea into soil NH4+ fraction (NdfSU-NH4+) was significantly higher in in the pH 5 plot, whereas NO3− and NdfSU-NO3− were lower than in control plots over the entire regrowth period. Nitrification of NH4+-N was delayed in soil amended with acidified slurry. Compared to non-pH-controlled pig slurry (i.e. control plots), application of acidified slurry reduced NH3 emissions by 78.1%, N2O emissions by 78.9% and NO3− leaching by 17.81% over the course of the experiment.
Conclusion
Our results suggest that pig slurry acidification may represent an effective means of minimizing hazardous environmental impacts without depressing regrowth yield.
INTRODUCTION
Manure emission from pig production accounts for 38.2% of the total quantity of manure issued from livestock production (46 million tons per year) in Korea. Since pig farms usually have little or no arable surface for forage production in Korea, utilization of pig slurry as an alternative organic fertilizer has become the most viable recycling option and composes more than 80% of all recycled animal manure [1]. However, mismanagement and application of nitrogen (N) to pig slurry can increase the risk of environmental pollution via nutrient losses to air, soil, water, and the biosphere [2,3]. Animal manure is a major contributor of odorous gases (ammonia [NH3] and hydrogen sulfide [H2S]) and greenhouse gases (GHGs; nitrous oxide [N2O], methane [CH4], and carbon dioxide [CO2]) that strongly impact the environment. The largest pathway of N loss is ammonia volatilization, which is not only of public concern for its adverse impacts on health and the environment [4], but also represents a loss of N from organic fertilizers [5,6]. Thus, improving the use efficiency of manure-derived N is essential [7]. Diet management (e.g. acidifying pig diets) [8], management during storage (e.g. covering of the slurry tank) [9], and slurry application methods (e.g. injection or banding) [6,10] have all been studied as ways for agricultural operations to minimize NH3 volatilization of animal manures and improve their N use efficiency. However, most results have often limited to evaluate the whole slurry management including gases emission, soil mineralization, and plant N use efficiency.
The NH3 in manure is generated from the hydrolysis of urinary urea, which is mediated by the microbial urease that is present in feces. The NH3 volatilization occurs when ammonium (NH4+) is converted to a gas under alkaline conditions, accounting typically for 40% to 50% in housing (and pasture), 5% to 15% from storage, and 40% to 55% during land application [4]. Both aerobic nitrification, in which NH4+ is oxidized to NO2− and further NO3−, and anaerobic microbial denitrification, in which NO3− is reduced to gaseous nitrogen compounds, can generate N2O, which is then released into the atmosphere [11,12]. The simple way to minimize NH3 and additional N2O emission is to create conditions that minimize the concentration of NH3 relative to those of NH4+, specifically by lowering slurry pH, a process that has been developed, widely tested and recently reviewed [3]. The positive effects of slurry acidification in reducing NH3 and N2O emissions [13] as well as on field crop yields [14–16] have been widely reported. However, acids are highly corrosive and hazardous to use, unless diluted with water. Furthermore, spreading of acidified slurry on soil will increase soil acidification, and chemical scorching of crops following application of slurries containing nitric acid have been reported. A recent review by Fanguerio et al [13] revealed that the effects of slurry acidification on the mineral fertilizer equivalent (MFE) varied significantly in several studies. As such, there is a need to improve our understanding of the implications of increasing the use efficiencies of manure N, and mitigating NH3 and N2O emissions and nitrate leaching, in order to achieve global targets.
The primary objective of this study was to determine the fate of pig slurry N to four major sinks: i) plant uptake, ii) soil N pool, iii) nitrogenous gases emission, and iv) nitrate leaching during regrowth of pasture sward. We emphasized the N flux derived from pig slurry urea because about 50% to 60% of N is excreted in the urine by pigs and cows, and 65% to 90% of N in urine is present as urea [17]. In this study, the turnover of pig slurry 15N-urea was directly quantified under the assumption that rates of microbial mineralization, nitrification, and denitrification were the same between labeled 15N-urea and unlabeled 14N-urea in pig slurry.
MATERIALS AND METHODS
Site, weather condition and experimental design
Field experiments were conducted on a permanent grass sward consisting mainly of perennial ryegrass (Lolium perenne), which was used for grass silage in the year preceding the treatment application. The experimental site was located in the uplands of southwestern South Korea (E126°90′, S35°18′) and featured a sandy loamy soil, the properties of which are presented in Table 1. The prevailing climate over the experimental period was humid temperate, with a mean temperature of 22.5°C and a total precipitation of 420 mm. Three treatments were applied: i) untreated pig slurry, as a control; ii) slurry adjusted to neutral pH 7.0; and iii) acidified pig slurry adjusted to pH 5.0. The experimental design consisted of a randomized complete block design with four replications; each treatment block measured 2.5 m×10 m. Adjacent blocks were separated by a 2-m margin and bordered with 45-cm metal retainers inserted 30-cm deep into the soil to prevent surface runoff and cross-plot contamination. Each treatment block contained 12 micro-plots (0.5 m ×0.5 m) for monitoring the fate of 15N-labeled pig slurry, four bottomless acrylic glass tubes (20-cm diameter and 30-cm length) for collecting gas samples, and four suction cups (P80, eco Tech, Bonn, Germany) for collecting leachate samples.
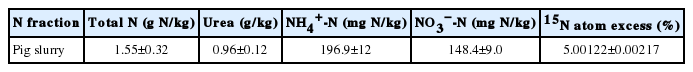
Nitrogenous composition and 15N atom % of the pig slurry used for experiment
Pig slurry treatments and 15N labeling
Slurry was collected from a local pig farm, where it was stored for approximately 1 week in a concrete tank at ambient temperatures, then placed into three different 400 L plastic containers. One container of the untreated slurry (control) was preserved at its original pH (7.9), whereas the slurries in the two other containers were acidified by slowly (to avoid foaming) adding 1.5 M H2SO4 until pH 7.0 and pH 5.0 were reached. The slurry urea fraction of the three treatments was labeled by thoroughly mixing 15N urea immediately prior to field application. Highly enriched 15N urea (98% 15N atom excess) was used to minimize the portion of chemical urea for a target 15N-urea enrichment of approximately 5.0 atom %. Subsamples of the applied slurry were analyzed at the time of application (Table 1). The pig slurry contained on average (kg/m3) 1.63± 0.11 total N, 0.197±0.012 NH4+-N, 0.148±0.015 NO3−-N, 0.78± 0.02 P, and 1.04±0.01 K with pHwater (1:5) of 7.9±0.02.
Treated pig slurry was applied at a rate of 200 kg N/ha. For the application of pig slurry, 307 L of pig slurry, which contained 95.8 kg P/ha and 127 kg K/ha, was applied to the 25-m2 plots after herbage was cut at 5-cm above ground level in the early spring (February 12).
Herbage, soil, gases, and leachate sampling
Soil and herbage samples were collected from the micro-plots bounded 0.5 m×0.5 m in a depth of 30 cm for soils) at 7, 14, and 56 d after cutting (e.g. application of pig slurry), respectively. Two earlier (7 and 14 d) and one final (56 d after regrowth) sampling times were also considered based on previous reports, which showed that endogenous N stored in roots or stubble is a main source of N for the earliest 2 weeks of regrowth, whereas exogenously applied N is important for later periods of regrowth [18,19]. For herbage sampling, herbage mass was cut manually at each sampling day, leaving stubble of approximately 5-cm at four randomly placed micro-plots in each treatment block. About 500 g of the harvested herbage tissue was sliced into 2-cm long segments, which were then lyophilized, ground, and stored in a vacuum desiccator for further analysis. Soil sampling was conducted in the same micro-plots where herbage samples were collected, with soil cores (0 to 30 cm depth) taken randomly using a 3-cm diameter tube auger. Soil samples were air-dried and finely milled to <0.15 mm.
Airtight acrylic glass chambers (20-cm diameter×30-cm depth) were inserted to a depth of 5 cm in the soil for gas sampling. To collect NH3 emission, acid trap system method described by Ndegwa [20] was adopted, with minor modifications. Each chamber was connected (via a septum located in the lid of the chamber) to NH3-N trapping bottles containing 150 mL of 0.2 mol/L H2SO4 (equivalent to 0.03 moles of acid). The other glass tube was connected to the vacuum system that created an airflow through the chambers at a constant rate of 1.5 L per min to exhaust the NH3-scrubbed air. Each chamber was closed and clamped with attached with silicon sealing for 24 h. Sampling of N2O gas from the acrylic glass chamber was conducted from each closed chamber using a syringe just before the sampling of NH3 emission and then stored in 10 mL vacutainer tube prior to analysis. For the sampling NH3 emission, the vacuum was connected to pull the sweep-air in the chamber into the acid trap bottle. A pair of four parallel ammonia trapping systems in each treatment block was run concurrently over 1 h to avoid extraneous effects during gas collection. Potential NH3 emissions were determined daily for the first 15 d, then at 1 to 2 week intervals afterward. The gas samples were taken. Four ceramic suction cup samplers (P80, eco Tech, Germany) were randomly positioned at depths of 50 cm for collecting soil water leachate for NO3−-N analysis in each treatment block, with soil water samples obtained weekly under a tension of −250 hPa and stored at −20°C.
Measurements and chemical analysis
The biomass harvested from each micro-plot was converted to kg/ha. This estimate was multiplied by the N concentration determined in the subsamples in order to calculate the N recovery in herbage (kg N/ha) at a given regrowth time. The total N content and 15N atom % of herbage, soil, and pig slurry samples were measured with a stable isotope ratio mass spectrometer (IRMS, IsoPrime, GV Instrument, Manchester, UK). For determination of soil NH4+-N and NO3−-N, about 20 g of finely sieved soil was extracted with 250 mL of 2 M KCl; extracts were then placed in distillation flasks and steam-distilled with MgO to ascertain the NH4+ fraction. Samples in the flasks were then distilled again after addition of Devarda’s alloy for NO3− determination. The N liberated from each distillation was collected in the form of H2SO4 to be a more stable form (NH4)2SO4 for the evaporation procedure. These soluble fractions were acidified to pH 2 to 3 to avoid possible loss through ammonia volatilization, and then evaporated to dryness. The dried powder, in the form of (NH4)2SO4, was analyzed for the determination of N content and 15N atom % excess of each N fraction. Concentrations of total N, NH4+-N, and NO3−-N in soil samples were converted to kg N/ha using the soil bulk density determined from the soil cores. The concentration of NH3-N in the acid trap solution (e.g. ammonium sulfate) was colorimetrically determined with Nessler’s ammonium color reagent after microdiffusion in a Conway dish [21] and expressed as the content of NH3-N emitted per hectare. The N2O concentration were analyzed by a gas chromatograph (7890A, Agilent technologies, Santa Clara, CA, USA) equipped with a thermal conductivity detector. Separation was achieved with a HP-Plot 5A column (30 m×0.53 mm×25 μm) using helium as the carrier gas, at a flow rate of 2 mL/min. The N2O fluxes were calculated as described by Guo et al [22]. Cumulative NH3 and N2O emissions over the entire experimental period were calculated by summing all daily measurements and period estimations (number of day×mean flux between sampling dates). Concentrations of NO3−-N in leachates were determined via ion chromatography (Dionex, DX-120, Sunnyvale, CA, USA), as previously described [23].
Calculation
The measured 15N atom % excess abundances in the total N, NH4+, and NO3− fractions in herbage and soil samples were converted to relative specific activity (RSA, i.e. % of recently incorporated atoms relative to the total number of atoms in the sample) using equation (1):
In which the natural abundance of herbage and pig slurry was adopted from the 15N atom % of non-15N-fed herbage and that of unlabeled pig slurry. The amount of N derived from the urea of applied pig slurry (NdfSU) in herbage samples was calculated via equation (2):
Similar equations were applied for the total N, NH4+, and NO3− fractions in the soil samples. The percentage of slurry urea-N recovered in the total N, NH4+, and NO3− fractions in herbage and soil samples was calculated by the ratio between the NdfSU and the quantity of applied N. The percentage of loss therefore refers to the portion that was not recovered in herbage and soil.
Statistical analysis
Analysis of variation was conducted to assess the effects of acidification of pig slurry at each sampling time on herbage yield, N uptake, and fate of slurry urea-N. Significant differences among acidification treatments were tested using Duncan’s multiple range test at the 5% level of probability using SAS 9.1.3 software [24].
RESULTS AND DISCUSSION
Soil pH, herbage dry matter, and N uptake
The initial soil pH of the experimental plots averaged 5.54± 0.41. The pH in the non-pH-controlled (control) plots and those in the pH-controlled pig slurry plots set to pH 7 slightly increased during the initial 7 to 14 d and then decreased to 6.31 and 5.90 at the end of the measurement period (56 d after pig slurry application), respectively, whereas pH remained within the 5.51 to 5.72 range in the plots to which acidified pig slurry was applied (pH 5) (Table 2). This implies that the increase in pH over the initial days following pig slurry application was offset by the acidifying effect of N sources and CO2 formed from mineralization of organic material, thus, ensuring that soil pH would be relatively stable for the latter experimental period.

Changes in soil pH in the plot applied with untreated pig slurry (control), acidified (pH 5) or mutualized slurry (pH 7) during regrowth of perennial ryegrass sward
A previous study revealed that N fertilization with pig slurry significantly enhanced the annual dry matter (DM) yield by 135% in a four-cut regime of perennial ryegrass sward compared to the non-fertilized control [25]. Positive N use efficiencies of animal slurry have been widely reported for herbage yields of pasture [6] and field crop productivity [26]. However, slurry application to soil promotes NH3 volatilization, which represents not only an N fertilizing value, but is also of concern for its adverse environmental impacts [7]. Although slurry acidification has been widely adopted to minimize NH3 emission, plant growth responses to acidified slurry application to soil has been poorly documented. In the present study, at 56 d of regrowth, mean herbage yield over the three plots receiving pig slurry with or without pH control was 3,345 kg DM/ha, or 34.4% higher than that obtained from the first regrowth in the non-fertilized perennial ryegrass sward [25]. The impact of acidification on herbage regrowth was low throughout the regrowth period, as shown a significant reduction of herbage dry weight only in the pH 5 plots at 14 d (Table 3).
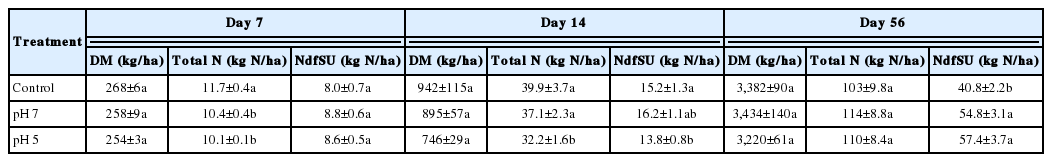
Total nitrogen content and the amount of N derived from slurry urea (NdfSU) in herbage as affected by the pH of pig slurry during regrowth of perennial ryegrass sward
Consistent with regrowth yield, the total amount of N taken up by herbage regrowth for 56 d of regrowth was not significantly different (p>0.05), with the exception of the pH 5 plots at 14 d (Table 3). The amount of N derived from slurry urea (NdfSU) in herbage showed similar pattern with that of total herbage N up to 14 d (9.2% decrease in pH 5 plot compared to control). The mean NdfSU across the three treatments was 8.5 kg N/ha, a rather low value due to the high concentrations of inorganic N available in the soil. This may reflect a common physiological pattern characterized by low N uptake for the earlier regrowth period [18,19]. Nitrogen uptake was previously shown to gradually increase with progressing regrowth in perennial ryegrass swards to which cattle slurry was applied through three cycles of regrowth [6]. Likewise, it was demonstrated, via 15N tracing, that N release from applied organic amendments and N uptake by Chinese cabbage were more distinct in latter growth periods than during the earliest 30 d [27]. The final NdfSU in herbage at 56 d was significantly higher in both the pH 7 (+34.3%) and pH 5 (+40.7%) plots than in the controls (Table 3), suggesting that acidified pig slurry may release plant available N more slowly.
Soil N dynamics
Common finding that the enhanced growth and N uptake by plants in organic manure N fertilized soil than in non-fertilized soils [5,6,25,27] could be attributed to the inorganic N released from organic N rather than the N pool size. Indeed, pH control of pig slurry did not affect the N pool size in the soil, as shown no significant differences among the three treatments throughout the entire regrowth period (Table 4). In the present study, a gradual decrease in 15N atom % in the soils treated with pig slurry (data not shown) suggested that N released from the applied 15N-urea in pig slurry diluted the soil inorganic N pool, and thus more N was available for plant uptake. Thus, the relatively higher NdfSU in herbage at 56 d in the pH-controlled plots (pH 7 and pH 5, Table 2) may be due to the higher availability of N to plants resulting from the mineralization of the organic N in pig slurry, as evidenced by the higher levels of NdfSU in the soil (Table 4).
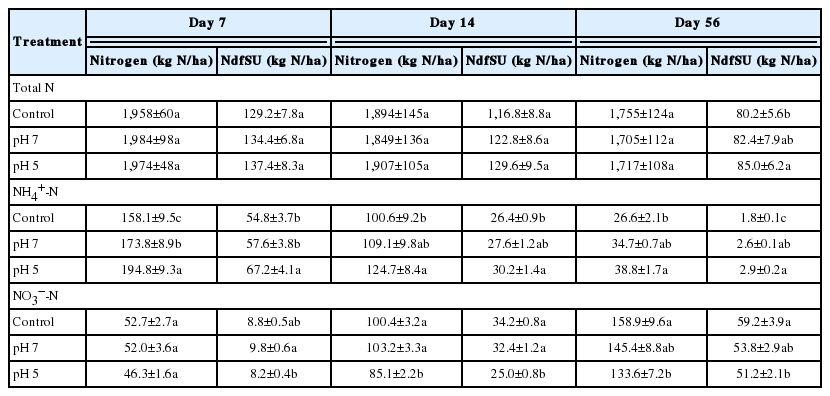
The content of nitrogen fraction and the amount of N derived from slurry urea in each fraction as affected by the pH of pig slurry during regrowth of perennial ryegrass sward
Concentrations of soil NH4+-N in the pH 7 and pH 5 plots significantly increased, by 9.5% and 23.2%, respectively, at 7 d after pig slurry application, with the highest content found in the pH 5 plots by 56 d (Table 4). The amount of N derived from slurry urea into the soil NH4+ fraction (NdfSU-NH4+) was significantly higher in the pH 5 plot during the whole period of regrowth, while no significant difference was found between the control plots and pH 7 plot until 14 d. Levels of NdfSU-NH4+ at 56 d were higher in both pH 7 (+44.4%) and pH 5 (+61.1%) plots than in the controls (Table 4). Concentrations of both NH4+-N and NdfSU-NH4+ decreased in the soil with progressing regrowth as nitrification occurred, but the decline was slower in the pH 5 plots. Our results were similar to those of previous laboratory incubation studies [13,28] and field experiments [29] that examined the effects of acidified pig and cattle slurry applied to different types of soils.
The initial concentration of NO3−-N in the soil was 36.2± 2.1 kg/ha and then increased during 56 days of regrowth in all treatment. Acidification led to significant reductions in the soil NO3−-N pool by 14 d. The amount of N derived from slurry urea into the soil NO3− fraction (NdfSU-NO3−) responded more quickly to pig slurry acidification, as shown by the significant decrease from 7 d (Table 3). Retention of higher levels of NH4+ and NdfSU-NH4+ in soils amended with acidified slurry, which are adversely lower NO3− and NdfSU-NO3− until 14 d, suggested that acidification may delay or inhibit nitrification of NH4+-N in the soil, in accordance with previous findings [13,14,28]. In the present study, no significant differences in NO3− and NdfSU-NO3− were detected between control plots and pH 7 plots. Given that the activity of nitrifying bacteria is strongly inhibited when soil pH is lower than 6 [30], application of pH 7 slurry had little effect on microbial nitrification rates because soil pH in these plots remained above 5.8.
Recovery of pig slurry urea-15N
At the end of regrowth (56 d after pig slurry application), the percentage slurry urea-15N recovered in herbage and soil averaged over all treatments was 25.5% and 41.3%, respectively; thus, 33.2% was unaccounted for and designated as loss (Table 5). The percentage of slurry urea-15N by herbage in the pH 5 plots was significantly lower at 14 d, after which it increased at the highest rate. This may reflect the increased N availability released from slurry urea relative to the non-acidified treatments (Table 3). The positive effects of slurry acidification on plant nutrient availability through estimations of the MFE have been previously reported [14,29], as higher levels of MFE in soils amended with acidified slurry was shown to significantly increase annual crop yields [14–16]; in addition, acidified slurry application led to higher herbage yields in permanent grasslands [31].
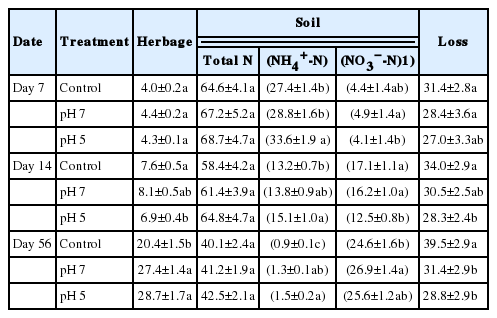
Recovery percentage of pig slurry urea-15N in herbage and soil, and calculated loss (not recover in herbage or soil) as affected by pH control of pig slurry during regrowth of perennial ryegrass sward
The percentage of slurry urea-15N recovery in total soil N gradually decreased, from 66.8% (mean of three treatments) at 7 d to 41.3% at 56 d, without significant influence of slurry pH treatment. However, the effect of acidification on soil inorganic N recovery varied with time after application, as shown by the higher soil NH4+ recovery throughout the whole period while lower soil NO3− recovery for the earlier 14 d relative to non-acidified treatments. The percentage slurry urea-15N recovered in soil inorganic N (NH4+ plus NO3−) at 56 d was 25.5%, 28.2%, and 27.1%, respectively, in the control, pH 7, and pH 5 plots. Urea-N has often been reported to have lower N use efficiency for DM production per kg of applied N compared to other ammonium- and nitrate-based fertilizers [32,33]. In this study, the percentage of slurry urea-15N not recovered in herbage and soil (designated as N loss) was within the range of 27.0% to 39.5% over the three treatments throughout the experimental period. Several 15N-urea tracing studies estimated N losses of 20% to 37% in wheat treated with ureases and/or nitrification inhibitors [32], 20% to 35% in maize [34], and 24% to 40% in Chinese cabbage [27] grown in soils amended with different levels of organic N. Taking the full N cycle in agroecosystems into consideration, N losses include gaseous N emissions in the form of ammonia (NH3), nitric oxide (NO), nitrous oxide (N2O), and molecular N (N2), as well as nitrate leaching and immobilization to organic N by microorganisms. Our results clearly show that acidification significantly reduced N loss from pig slurry N applied to perennial ryegrass sward.
NH3, N2O emission, and NO3− leaching
NH3 emissions following animal manure application to soil derive from the decomposition of N present in the feces and hydrolysis of urea, mainly in form of urine. Urea hydrolysis is mediated by the enzyme urease and produces ammonium and carbonate. In soils amended with animal manure, significant increases in the daily NH3 flux have been shown to occur in various cropping systems [13,14,28] and laboratory incubation assays [35,36]. One primary goal of acidification of animal slurries is to reduce NH3 emissions, because of its negative impacts on both the environment and animal health [14,37]. Gaseous NH3 may be formed depending in the pH value of the slurry–soil system. Hydrolysis of urea can take place both under aerobic and anaerobic conditions, with optimum pH levels for urease activity between 6.5 and 7.0 [38]. In the present study, more than 50% of total NH3 emissions occurred within the first 14 d after application to the soil in all treatments. Daily NH3 emissions for this period decreased significantly in the pH 5 plots relative to the control and pH 7 plots (Figure 1A), confirming that the final pH of slurry is directly associated with NH3 emissions following slurry application to soil [13,29,39]. Cumulative NH3 emissions throughout the period of measurement decreased by 60.9% in the pH 5 plots but by only 33.7% in the pH 7 plots compared to the control plots (Figure 2A). Previous work has shown that the efficacy of slurry acidification in reducing NH3 emissions after field application varied within the range of 40% to 80% for pig slurry [40,41] and 15% to 80% for cattle slurry [28,42,43] applications, depending on the target pH and/or the types of acids used.
Daily emission of ammonia (A) and nitrous oxide (B), and weekly accumulative nitrate concentration in leachate (mg NO3−-N/L, C) from the soil amended with untreated (control, ○), mutualized (pH 7, ●) and acidified pig slurry (pH 5, ▲) during regrowth of perennial ryegrass sward. The values are mean±standard deviation of four replicates.

Total emission of ammonia (A) and nitrous oxide (B) and nitrate leaching (C), as estimated by cumulative amount for 56 days of regrowth. The values are mean±standard deviation of four replicates. Different letters in horizontal row indicate significantly different at p<0.05 according to the Duncan’s multiple range test.
Nitrous oxide emissions from soils amended with animal slurry result from the nitrification and denitrification processes. The main determinants of N2O emissions are thus the amount of NH4+ available for nitrification to NO3− and the amount of soluble organic C available for denitrification. Consistent with NH3 emissions, daily N2O emissions were lower over the first 14 d in the pH 5 plots, and remained lower than in the control and pH 7 plots up to 56 d (Figure 1B). Cumulative N2O emissions throughout the period of measurement decreased by 71.8% in the pH 5 plots but by only 48.7% in the pH 7 plots compared to the controls (Figure 2B). The results of the limited number of studies of the effects of slurry acidification on N2O emissions relative to NH3 emissions are inconsistent. Velthof and Oenema [44], for instance, reported that N2O emissions increased following acidified slurry application compared with HNO3 emissions in grasslands, which they attributed to the addition of NO3− rather than to the pH of slurry. In contrast, other studies have shown that slurry acidification reduced N2O emissions during storage [45] and after soil application of acidified pig slurry [35]. In laboratory incubation assays, N2O emissions from acidified cattle slurry were significantly decreased relative to non-acidified slurry [13]. Fangueiro et al [35] attributed a decrease in N2O emissions following slurry application to a delay in or inhibition of the nitrification process. This interpretation is well consistent with our results, which show lower NO3− concentrations and NdfSU-NO3− in soils amended with acidified pig slurry for the first 14 d (Table 4). The lower N2O emission from acidified slurry may be due to the reduced amount of organic C available for denitrification resulting from CO2 losses during the acidification process [13].
The NH4+ in mineral N and organic manure is rapidly nitrified in soil after application [5,46]. The surplus N, after converting to NO3−, is prone to leaching when there is drainage. This process depends on the mineralization dynamics of soil N, as well as soil moisture and temperature [24,47]. We found that the weekly cumulative leaching of NO3− was lower in the pH 5 plots than in the other treatment plots, especially prior to 21 d after pig slurry application (Figure 1C). The lower rates of NO3− leaching from soils amended with acidified slurry for this earlier period may be due to the priming effect of acidification on delaying nitrification, as shown by the higher levels of NH4+ and lower soil NO3− content (Table 4). Cumulative NO3− leaching declined throughout the experimental period, by 17.8% in the pH 5 plots and by 9.6% in the pH 7 plots, compared to the controls (Figure 2C). Thus, we conclude that only a small proportion of the total amount of N is lost via NO3− leaching following application of acidified pig slurry. However, the apparent effects of pig slurry acidification on the overall environmental impact have significance.
IMPLICATIONS
Appropriate acidification of animal slurry represents an efficient means of improving the use efficiency of pig slurry-N with significant reductions in NH3 and N2O emission, as well as in NO3− leaching. The acid in the present study was added just before application of slurry in the field; however the slurry is often stored for a variable time before or after acidification. The stored time may influence the turnover of manure organic matter during storage and thereby also the N availability. Further studies would be useful to determine the mineralization dynamics and N loss of ammonia volatilization in relation to the storage time after acidification.
ACKNOWLEDGMENTS
This study was carried out with the support of “Investigation for the use efficiency of different organic manures in upland grassland (Project No. PJ010099)” Rural Development Administration, Republic of Korea.
Notes
CONFLICT OF INTEREST
We certify that there is no conflict of interest with any financial organization regarding the material discussed in the manuscript.