Effects of roughage quality, period of day and time lapse after meal termination on rumen digesta load in goats and sheep
Article information

Abstract
Objective
This study ascertained effects of roughage quality, period of day at meal termination and time lapse after feeding on digesta load in the rumen.
Methods
Veld hay was untreated (poor roughage quality, PRQ), improved (improved roughage quality, IRQ) by treating with urea or semi-improved by spraying with urea (semi-improved roughage quality, SIRQ). Experiment 1a used four rumen fistulated sheep to determine in-sacco degradability. Twelve sheep (56.3±4.59 kg) were blocked by weight and randomly allocated to IRQ (n = 6) and PRQ (n = 6) to determine solid and liquid passage rates. In experiment 1b, nine sheep (37.6±9.34 kg) were blocked by weight and randomly allocated to IRQ (n = 4) and PRQ (n = 5) to determine digestibility. Sixteen sheep (36.47±9.46 kg) were blocked by body weight and randomly allocated to IRQ (n = 8) and PRQ (n = 8). Two sheep were slaughtered for each sampling time in each treatment (IRQ and PRQ) at 0, 6, 12, and 24 h after feeding to determine rumen load. In experiment 2, eighteen goats (25.4±9.08 kg) were blocked by weight and randomly allocated to IRQ (n = 6), SIRQ (n = 6), and PRQ (n = 6). Then all 18 goats were slaughtered soon after meal termination in the morning; afternoon and evening to determine the effect of period of day on rumen fill.
Results
Rate of degradation and effective degradability were enhanced by improvement of roughage quality. Roughage quality had no effect on digestibility, but digestibility was higher in goats than sheep. Fractional passage rate of particles was higher for IRQ than PRQ, but similar for liquids. Digesta fractional clearance rates at 24 h after feeding were 0.018/h (IRQ) and 0.006/h (PRQ). Period of day had an influence on rumen load. Neutral detergent fibre load for goats were above 2.03 kg/100 kg body weight for all diet treatments.
Conclusion
Following starvation, passage rate had negligible effects on emptying of rumen load.
INTRODUCTION
Small ruminant production in tropical and subtropical regions of Africa is mainly characterised by grazing livestock on tropical grasslands. In addition, claims are of an impending reduction in small ruminant performance in Africa due to a decrease in forage quality and availability because of global warming [1]. Marginal increments in global temperatures are projected to cause a decrease in forage quality and digestibility by increasing the highly indigestible lignin content of plant cell walls. Hay and straw derived from tropical grass species is generally described as of poor quality, bulky and “high methane” roughages that elicit low feed intakes [2]. In most cases, low feed intake of hay derived from tropical grasses by grazing ruminants is a result of slow movement of solid digesta out of the rumen, increasing rumen “fill”. Theoretically, ruminants eat to meet their nutritional needs [3], unless constrained not to by factors such as rumen capacity. Rumen fill (RF) levels vary throughout the day as a function of digesta clearance rate from the rumen governed by rates of passage and degradation. Adaptation of tropical ruminants to store more feed of poor nutritional quality may implicated higher RF level [4].
Long unprecedented starvation (period between successive feeding sessions) is a common occurrence in communal ruminant livestock production systems in Africa. The influence of starvation on subsequent feed intake depends on the rumen digesta load after feeding. Rumen digesta load at various times after termination of feeding bouts determines the amount of available or receptive space in the rumen at the time of measurement. Little is known on the effect of improving tropical hay quality on the pattern and extent of decrease in digesta load in the rumen with time after feeding. Given the capacity to predict rumen digesta load using artificial neural networks [5], this knowledge may be useful in determining subsequent intake after feeding necessitating prediction of roughage intake.
Objectives of this study were i) to determine the effects of improvement of roughage quality on digesta passage rates, total tract digestibility and in-sacco degradability; ii) to ascertain the trend of digesta disappearance from the rumen at various times after feeding; and iii) to determine the effects of improvement of roughage quality and period of day on digesta load at meal termination. This study tested hypotheses that i) roughage quality has no effect on digesta passage rates, intake and digestibility; ii) digesta in the rumen disappeared in a nonlinear fashion based on the rate of degradation and passage after feeding has stopped [RF = f(kd; kp)]; and iii) period-of-day has no effect on digesta load at meal termination.
MATERIALS AND METHODS
Study site
The experiment was conducted with the approval of the University of KwaZulu-Natal Ethics Committee, the Animal Ethics Sub-Committee (ref. AREC/072/2015M). The experiment was conducted at the University of Kwazulu-Natal’s Ukulinga Research Farm, Pietermaritzburg, in the subtropical hinterland of KwaZulu-Natal Province, South Africa. The study site lies on the geographical coordinates 30°24′S and 29°24′E at an altitude of 700 m. Mean annual rainfall in the study site is approximately 735 mm, falling mostly in summer, between October and April. Maximum and minimum mean annual temperatures are 25.7°C and 8.9°C, respectively. In extreme weather conditions, summer temperatures may reach highs of above 32°C with minimum temperatures as low as 3°C at night in winter.
Animals, feed treatments, and experimental design
Two roughage qualities were used; for one diet, roughage quality was enhanced by treating veld hay with 4% (w/w) urea and packed into air-tight polythene bags for 40 days to give hay of improved roughage quality (IRQ), while the other treatment was untreated veld hay, which was poor roughage quality (PRQ) (Table 1). In experiment 1a, four adult Merino sheep with an average body weight (BW) of 58.3±4.9 kg, fitted with permanent rumen cannulas of 80 mm internal diameter were used to determine degradability. The experiment lasted 38 days, comprising of a 14-day period for adaptation to experimental diets, followed by 5 days of incubating rumen degradation samples. On day 19, diets of these four fistulated sheep were interchanged followed by a 14-day adaptation period. Thereafter, a second run of the nylon bag degradation of IRQ and PRQ was done. IRQ samples were incubated in the rumen of sheep fed IRQ, while PRQ samples were incubated in sheep fed PRQ. Passage rates were determined in 12 adult Merino sheep (average weight of 56.3±4.59 kg); these sheep were weighed, sorted based on BW, randomly assigned to two dietary treatments. After an adaptation period of 14 days on dietary treatments, these sheep were dosed with external markers and faecal grab samples collected for 7 days after marker administration to determine passage rate of digesta. In experiment 1b, 16 Merino sheep with an average weight of 36.47±9.46 kg were blocked by BW and within block randomly assigned to dietary treatments used to determine intake, in vivo digestibility and RF after feeding. Experiment 1b lasted 41 days, comprising of a 14-day period for adaptation to the experimental diets followed by 7 days of total faecal sample collection to determine digestibility. After the digestibility trial, all 16 sheep were slaughtered to determine RF over a period of 20 days.

Chemical composition of experimental feeds
In experiment 2, eighteen Nguni goats were blocked into 2 groups containing 9 light weight (average initial BW of 16.94 ±2.51 kg) and 9 heavy weight (average initial BW of 33.6±5.00 kg) goats to determine digestibility and RF at meal termination. In one dietary treatment, roughage quality was enhanced by treating veld hay with 4% (w/w) urea and packed into air-tight polythene bags for 20 days to give hay of IRQ; in the second treatment, veld hay was sprayed with 2.5% (w/w) urea, left uncovered and sun-dried before feeding to give semi-improved roughage quality (SIRQ); and the third treatment was untreated veld hay with PRQ (Table 1).
In experiments 1 and 2, sheep and goats were dosed for internal parasites and placed in individual pens with ad-libitum access to clean water for the whole duration of these studies. Sheep and goats adapted to the experimental diets for 14 days and were allocated approximately 2 kg dry matter (DM) of either IRQ, SIRQ, or PRQ at 10:00 h and 15:00 h daily during the trial. Hay was fed milled to pass through a 12 mm screen using a hammer mill (Scientec hammer mill 400, Lab World Pty Ltd, Johannesburg, South Africa). Hay left in feeders was weighed daily before new hay allocation was given. Daily roughage intake was calculated by subtracting feed left from feed allocated (Roughage intake = feed in – feed out).
In-sacco degradability, passage rates, in-vivo digestibility and rumen digesta load in sheep (Experiment 1)
Degradability of IRQ (n = 4) and PRQ (n = 4) was determined using the nylon bag technique. Roughage samples were milled to pass through a 2 mm screen using a hammer mill (Scientec hammer mill 400, Lab World Pty Ltd, Johannesburg, South Africa). Approximately 3 g of each ground roughage sample was weighed into labelled nylon bags (ANKOM Co, Fairport, New York, USA; internal dimensions: 5 cm×9 cm; pore size 50 μm). Bags were tied to a stainless steel disc with 10 evenly spaced small holes drilled through the periphery of the disc serving as anchor points. Bags were sequentially incubated (in triplicates per time interval) in the rumen for 120, 96, 72, 48, 24, 9, 6, and 3 hours [6]. Thereafter, incubated bags, including the zero hour bags were washed for 30 minutes (6 cycles each lasting 5 minutes) using a semi-automatic washing machine. Washed bags were dried in an oven at 80°C for 48 hours, cooled in a desiccator and weighed.
Solid and liquid passage rates in sheep fed IRQ (n = 6) and PRQ (n = 6) were determined over a 7-day period. Ytterbium marked roughages were prepared according to Hartfield et al [7]. Roughage samples to be marked were ground to pass through a 12 mm screen, soaked in distilled water overnight to remove soluble material and dried at 60°C overnight. Ytterbium labelled roughages were prepared by soaking roughages in 2.5 g/L YbCl3·6H2O solution at a rate of 50 g of roughage per litre solution for 120 hours. The residue was washed using distilled water until the colour of water turned clear to remove any unbound ytterbium. Cobalt-ethylenediaminetetraacetic acid was prepared according to Uden et al [8], where 297.2 g sodium-ethylenediaminetetraacetic acid, 190.4 g CoCl2·6H2O and 32 g NaOH were dissolved in 1,600 mL of distilled water in a 5-litre beaker. In order to ensure that all the reagents dissolved, an additional 7 g NaOH was added. The solution was allowed to cool to room temperature, after which 160 mL H2O2 was added. The mixture was allowed to stand at room temperature for 4 hours, and 2,400 mL of 95% (v/v) ethanol was added. The mixture was placed in a refrigerator for approximately 120 hours for crystallisation. The pH of the solution was 9.95. Crystals formed were filtered and washed 3 times using 330 mL of 80% (v/v) ethanol for each cycle, dried in an oven at 90°C for 24 hours and stored in plastic bottles at room temperature. A day prior to administration, sheep were starved overnight, 20 g ytterbium labelled roughage was weighed and offered to each sheep. Eleven sheep readily consumed >95% of the ytterbium marked roughage while one sheep did not readily consume the marked roughage but finally was lured to consume all the marked roughage after it was mixed with 10 g Lucerne hay in 10 minutes. Approximately, 120 g of cobalt-ethylenediaminetetraacetic acid crystals were dissolved in 720 mL water and each sheep was drenched 60 mL of solution containing cobalt-ethylenediaminetetraacetic acid.
In-vivo digestibility of IRQ (n = 4) and PRQ (n = 5) were determined over a 7-day period. Faecal bags were attached to sheep’s hindquarters 3 days before collection of faecal samples so as to allow each of these small ruminants to adapt to carrying a bag. Faecal bags were emptied into foil trays and dried in an oven at 60°C for at least 48 hours. Dry faeces were weighted. Apparent digestibility (AD) was determined by subtracting total faeces from total intake divided by total intake over a 7-day period (AD = (total intake – total faeces)/total intake).
After the digestibility trial, 16 sheep fed on IRQ (n = 8) and PRQ (n = 8) were slaughtered to determine RF after feeding. A day prior to slaughter, feed was removed at 15:00 h such that all animals were starved for 17 hours before the next feed allocation. On the day of slaughter, sheep were allowed water at ad libitum and to eat their daily allocation of hay from 08:00 h until each sheep voluntarily stopped eating. An animal that had a break of greater than 5 minutes after an eating session was regarded to have stopped eating. Time after feeding was recorded immediately. One sheep had feed removed after it ate for more than 100 minutes without taking a break greater than 5 minutes. The amount of feed consumed on the day of slaughter and time spent eating were recorded. Sheep were weighed 20 minutes prior to slaughter. Rumen digesta load was determined by slaughtering sheep 0, 6, 12, and 24 hours after feeding. Two (2) sheep were slaughtered for each sampling time for each diet treatment.
In-vivo digestibility and rumen digesta load at meal termination in goats
In-vivo digestibility of IRQ (n = 6), SIRQ (n = 6), and PRQ (n = 6) were determined over a 7-day period. The procedure for digestibility measurement was the same as that of sheep in experiment 1b. To determine digesta load at various periods of the day, one goat from each of the 3 diet treatments was randomly selected for slaughter in the morning (10:00 to 11:00 h), afternoon (14:00 to 15:30 h), and evening (19:30 to 21:00 h) immediately after meal termination.
Slaughtering procedure
Sheep and goats were slaughtered by electrical stunning using a stunning machine to make them unconscious and the jugular vein slit with a sharp knife and bled (exsanguination). The entire animal guts were removed and each compartment emptied and weighed to determine the weight of wet digesta in each section of the gut. Lengths of the small intestines, caecum, and large intestines were measured for each slaughtered sheep.
Rumen and faecal sample collection, preparation, and analysis (all experiments)
In experiment 1a, before administration of markers, faecal samples were taken in order to determine the initial presence or absence of cobalt and ytterbium. Faecal sample collection was done over a period of 7 days after administration of markers by rectal palpation and extraction of sizeable rectal faecal samples by hand on each sheep. Faecal sampling times were: 0, 1, 4, 7, 10, 13, 21, 24, 27, 29, 48, 53, 72, 77, 96, 101, 120, 144, and 168 hours post marker administration. Faecal samples from each sheep were dried in an oven at a temperature of 60°C for 96 hours soon after collection. Samples were ground to pass through a 2-mm sieve using a hammer mill and stored in airtight plastic bags pending analysis.
Two grams of air dried faecal samples were weighed, placed in porcelain crucibles and combusted at 550°C overnight and ash samples were cooled and dissolved in 5 cm3 of HCl. The solution was evaporated to dryness using a water bathe; the residue was cooled and 5 cm3 of HNO3 was added. The solution was heated on a water bathe to boiling point. The resulting solution was passed through filter paper into a 100 cm3 volumetric flask. The filter paper was washed with warm deionised water. The solution was diluted to volume with deionised water and mixed well. Ytterbium and cobalt concentrations were determined using an Inductively Coupled Plasma Optical Emission Spectrometer (ICP-OES) (Perkin Elmer, Precisely, Optima 5300 DV Spectrometer, Shelton, CT, USA).
In both experiments, rumen digesta and faecal samples were collected and dried to a constant mass in an oven at 60°C to determine the DM content. Digesta were analysed for neutral detergent fibre (NDF) using an ANKOM A220 fibre analyser (ANKOM Technology, New York, USA).
Chemical analysis of experimental feeds
Moisture, DM, organic matter, and ash were analysed using procedures described by the Association of Official Analytical Chemists [9]. Nitrogen content was determined using an automatic protein determinate machine, LECO TruSpec nitrogen analyser FP2000 (LECO, Pretoria, South Africa). Crude protein content was calculated by multiplying the nitrogen content by a factor of 6.25 (Crude protein = nitrogen content×6.25). The NDF and acid detergent fibre were analysed using an ANKOM A220 fibre analyser (ANKOM Technology, USA). Hemicellulose content was determined by subtracting acid detergent fibre content from NDF content (Hemicellulose = NDF – acid detergent fibre). Crude fat content was determined using the Soxhlet method on the Soxhlet Buchi 810 fat analyser (Soxhlet Buchi, Flawil, Switzerland).
Mathematical procedures
In-sacco degradability in sheep
Degradability of roughage samples were determined using DM loss in nylon bags [10]. The DM loss was plotted against incubation time to inspect for outliers. A model developed by McDonald [11] was fitted on Statistical Analysis System 9.3 (SAS Institute Inc., Cary, NC, USA) and degradation parameters generated. Effective degradability (ED) was calculated using a passage rate of 0.03 per h [12]. The model used was: Y = a+b(1–e−c(t–L)), where: Y, degradability at time (t); a, intercept; b, potentially degradable fraction; c, rate of degradation of b; and L, lag time.
Digesta passage rate in sheep
Faecal excretion data was described using a model developed by Grovum et al [13]. The model was: Y = 0, when t<TT, Y = Ae−k1(t–TT) – Ae−k2(t–TT), when t≥TT, where: Y and A are the adjusted marker concentration in the faecal DM; k1 (rumen) and k2 (hindgut) rate constants; TT, calculated time for the first appearance of marker in faeces and t, sampling time in hours after single dosage. The selectivity factor (SF) was calculated as SF = MRTparticles÷MRTliquid [14].
Modelling of post feeding rumen load in sheep
Modelling of RF levels was done using the linear regression procedure. In determining the trends of decrease in rumen load levels with time after feeding, 2 outliers were removed from data for the PRQ fed sheep slaughtered 12 hours after feeding. Actual slaughter times were used to recalculate the real time of slaughter after feeding. The RF levels against real slaughter times after feeding were regressed using the linear regression procedure and used to determine the equation of the curve, which was extrapolated to determine RF level at time 0 h after feeding. Based on this recalculated RF at time zero after feeding, the proportions of rumen load at each time after feeding relative to RF at time zero were calculated. Proportions of RF relative to RF at time zero after feeding were regressed against time after feeding, separately for each roughage quality. Differences in slopes of these two curves were tested using the regression procedure.
The RF levels were also fitted to a linear model with a natural logarithm function. The Genmod procedure was used to determine the linear model with a natural log link function for the proportion of RF with time after feeding. This model takes a linear form with a log link function, a function that associates regressors with the response variable as: Ln Prop = Ln Prop0+(rate×time). This model was used to determine the rate of disappearance of digesta from the rumen at various times after feeding. The final model was: Prop = Prop0×ert, where Prop0 is the initial proportion; Prop, proportion of rumen load at any time after feeding; t, time; and r, rate of disappearance.
Statistical analysis
The correlation procedure was used to establish the Pearson correlation coefficients between wet and dry digesta load in various compartments of the gastrointestinal tract. The general linear model (GLM) procedure was used to determine the effect of roughage quality on degradability, digestibility, passage rate, wet matter, DM, and NDF load in the foregut. The effect of roughage quality, time after feeding and period of day on wet matter, DM and NDF load in the foregut were determined. The Student-Newman-Keuls test was used to identify sample means that are significantly different from each other at p<0.05. The experimental models were: Yij = μ+Ri+BW+eij, where: Y, degradability, digestibility and passage rate; μ, overall mean; Ri, roughage quality effect (i = IRQ; PRQ); BW, body weight; eij, experimental error. The model for rumen fill was: RFijk = μ+Ri+Pj+BW+ɛijk, where: RF, rumen fill (wet matter, DM, NDF); μ, overall mean; Ri, roughage quality effect (i = IRQ; PRQ; SIRQ); Pj, period of sampling effect (j = 0; 6; 12; 24 h or j = morning, afternoon and evening); BW, body weight; eijk, experimental error.
RESULTS
Degradability, digestibility and passage rates
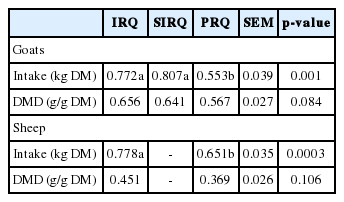
Improvement of roughage quality enhanced ED by +86 g/kg (at kp = 0.03 per h) and increased rate of degradation by approximately 2-fold (Table 2). The DM intake for sheep was +0.127 kg greater for IRQ compared to PRQ (Table 3). Roughage quality had no influence on apparent digestibility of dry matter in sheep and in goats. However, digestibility were +0.089 (IRQ) and +0.074 g/g DM (SIRQ) greater than for goats fed PRQ.

Effect of improving roughage quality of veld hay on in-sacco degradability (Exp. 1a)
Effect of improving roughage quality on in-vivo digestibility
Fractional passage rate and mean retention time (MRT) of solid digesta in the rumen were −0.004 per h lower and +9.8 h greater, respectively, for sheep fed PRQ than those fed on the IRQ. Fractional passage rate and MRT of liquid in the rumen were not affected by roughage quality. Fractional passage rates and MRT for solid and liquid digesta in the hindgut were not affected by roughage quality. The SF was approximately 1.5-fold lower for sheep fed IRQ compared to those fed on PRQ (Table 4).
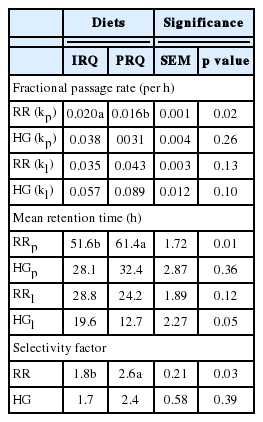
Effect of improving roughage quality on solid and liquid digesta passage rates in the rumen, hindgut and whole gastrointestinal tract of sheep (Exp. 1a)
Rumen digesta load in sheep and goats
The DM and NDF intake during the first eating session on the morning of experiment 1b was +0.138 kg and +0.130 kg greater, respectively, for sheep fed IRQ compared to those fed on PRQ. Duration of the first eating session on the morning after a 17 h starvation period was +20 min greater for sheep fed on IRQ compared to PRQ. Sheep fed on PRQ ate −0.88 g/min less than sheep fed on IRQ during the first eating session on the morning after a 17 h starvation period (Table 5).
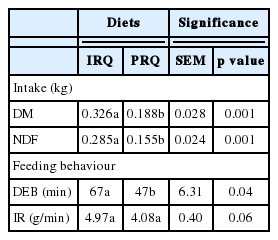
Effect of roughage quality on intake, intake rate and duration of feeding bout of first eating session after a 17 hour starvation period in sheep (Exp. 1b)
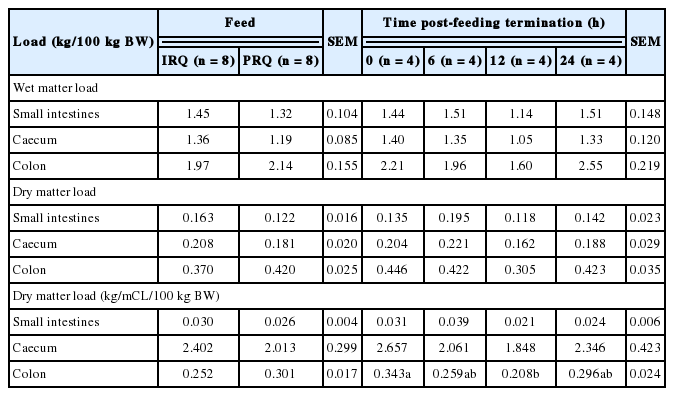
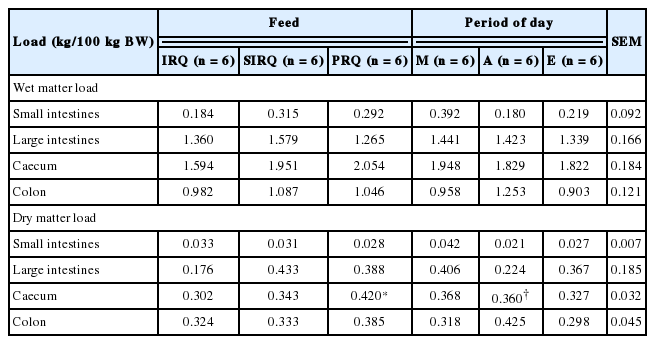
Generally, wet digesta load in the reticulo-rumen, omasum and abomasum were 92.2%, 4.1%, and 3.7% of the total foregut wet digesta load, respectively, for sheep fed on IRQ. Sheep fed on PRQ had 89.9%, 3.6%, and 6.5% of the total foregut wet digesta load in the reticulo-rumen, omasum and abomasum, respectively. A similar trend was observed with the DM load. The compartmental distribution of total dry digesta load in the foregut was 89.8% (reticulo-rumen), 6.8% (omasum), and 3.4% (abomasum) for sheep fed on IRQ, and 83.7% (reticulo-rumen), 7.2% (omasum), and 9.1% (abomasum) for sheep fed PRQ (Table 6). Roughage quality had no effect on wet digesta load in all foregut compartments. The duration after feeding had an effect on wet matter load in the omasum. Wet omasal load decreased gradually with time from 0 to 12 h after feeding, but increased at 24 h after feeding.

Roughage quality had no effects on dry digesta load in the foregut except in the abomasum. Time lapse after feeding had an effect on DM load in the omasum. The RF (kg NDF/100 kg BW) was 26% higher for sheep fed on IRQ compared to those fed on PRQ. There was a general tendency for NDF (kg/100 kg BW) load to increase with time after feeding. NDF (kg/100 kg BW) was significantly higher (1.5 fold) at 24 h post meal termination compared to 0 h after feeding.
Roughage quality and time lapse after feeding had no effects on the wet and dry digesta load in the hindgut (Table 7). Time lapse after feeding had an effect on the dry load per unit compartment length in the colon. Dry colon load (kg/metres of compartment length [mCL]/100 kg BW) decreased gradually with time from 0 to 12 h after feeding, but was highest at 24 h after feeding.
The regression relationship between the dry rumen load (Y) and duration after feeding (X) (h) was: Y = 3.285 (±0.0775)–0.0583(±0.00570) X (n = 4, root mean square error = 0.0999) for sheep fed IRQ (Figure 1). The model accounted for 98% of the variation. The regression relationship between dry rumen load (Y) and duration after feeding (X) (h) was: Y = 2.33 (±0.034)–0.0142(±0.0024) X (n = 3, root mean square error = 0.04) for sheep fed PRQ. The model accounted for 98% of the variation. The slope of the curve for PRQ was significantly different from that for IRQ (p = 0.03).

Effect of time lapse after feeding on actual dry rumen digesta load in sheep. IRQ, improved roughage quality; PRQ, poor roughage quality
The regression relationship between the proportion of dry rumen load (Y) and duration after feeding (X) (h) was: Y = 1.00(±0.015)–0.018(±0.0013)X (n = 5, root mean square error = 0.0248) for sheep fed IRQ (Figure 2). The model accounted for 99% of the variation. The regression relationship between the proportion of dry rumen load (Y) and duration after feeding (X) (h) was: Y = 1.00(±0.008)–0.006(±0.0006)X (n = 4, root mean square error = 0.0126) for sheep fed PRQ. The model accounted for 96% of the variation. The slope of the curve for PRQ was significantly different from that for IRQ (p = 0.003). At 24 h after feeding, sheep lost 42.6% (IRQ) and 18.8% (PRQ) of digesta load at termination of feed intake. The average final fractional clearance rate of rumen digesta after 24 h after feeding was approximately 0.018/h (IRQ) and 0.006/h (PRQ).
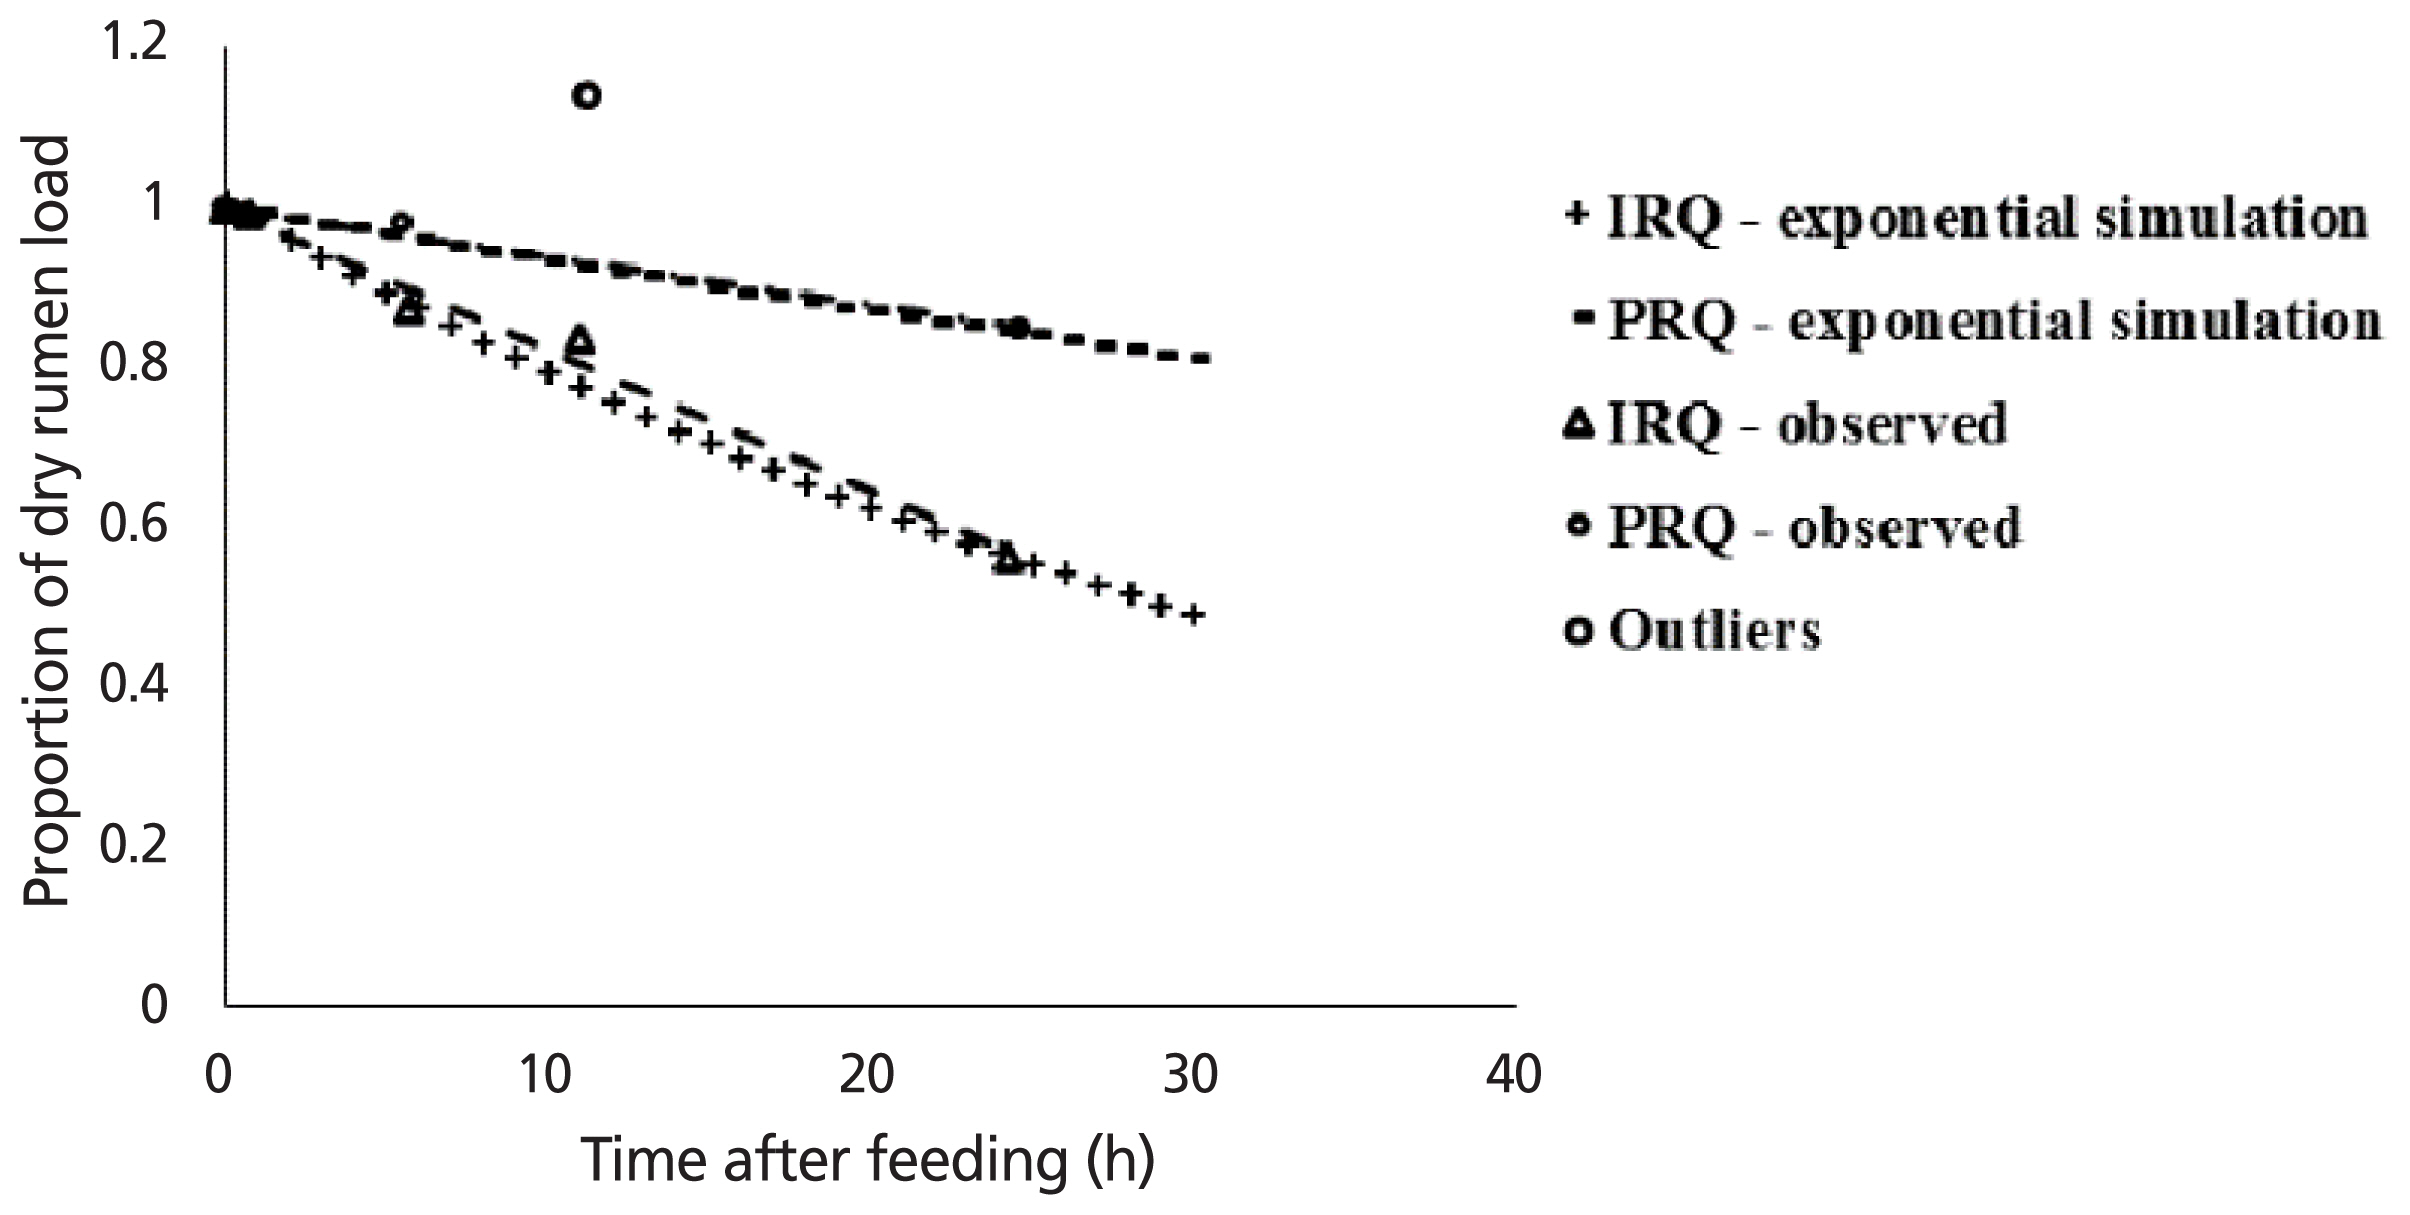
Simulation of effect of time lapse after feeding on proportion of dry rumen digesta load relative to the dry rumen load at time zero hours after feeding in sheep. IRQ, improved roughage quality; PRQ, poor roughage quality.
The exponential relationship between the proportion of rumen load (Y) and duration after feeding (X) (h) was: Y = 1.008e−0.023X (IRQ) and Y = 1.0006e−0.007X (PRQ). Rates of clearance of digesta from the rumen after feeding stopped were 0.023 and 0.007/h for IRQ and PRQ, respectively. Improving roughage quality resulted in a 3-fold increase in the rate of disappearance of digesta from the rumen post feeding. Clearance rates derived from linear regression models are similar to those obtained from the exponential models for both roughage qualities.
Roughage quality had no effects on wet digesta load (rumen and abomasum) and dry digesta load (omasum and abomasum) (Table 8). Dry rumen load was highest for goats fed SIRQ. Rumen load for NDF took values of 2.2±0.32 kg/100 kg BW for all roughage qualities. Rumen NDF fill (kg/100 kg BW) was 34% higher for goats fed on SIRQ compared to those fed on IRQ. There was a general tendency for wet, dry, and NDF loads (kg/100 kg BW) in the rumen to increase as the day progressed from morning to evening. Wet, dry and NDF load in the rumen increased significantly from morning to evening. Wet abomasum load decreased gradually from morning to evening. Roughage quality and period of the day had no effects on wet and dry digesta load in all hindgut compartments in goats (Table 9).

Correlations between wet and dry digesta load in all compartments were not significant (r<0.5), except for correlations between wet digesta load in the rumen and large intestines, large intestines and abomasum, large intestines and small intestines, and small intestines and colon which were significant and r>0.5. Significant correlations (r>0.5) between wet and dry digesta load were observed between the dry and wet omasum, the wet large intestine load to the dry large intestine and dry abomasum loads, to the wet small intestine and wet large intestine load, and dry abomasum to the wet abomasum load (Table 10).
Correlation between wet (top-diagonal) and dry (bottom-diagonal) digesta load in various compartments and that of dry and wet matter in each compartment (extreme right) in the gastrointestinal tract of Merino sheep (Exp. 1b)
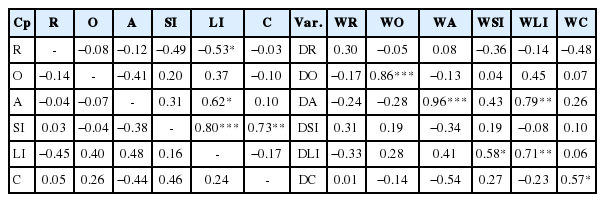
Correlations between wet and dry digesta load in all compartments were not significant (r<0.5), except for correlations between wet digesta load in the rumen and abomasum, caecum and omasum, large intestines and colon which were significant and r>0.5. Significant correlations (r>0.5) between wet and dry digesta load were observed between the dry and wet rumen load, the wet abomasum to the dry rumen load, the wet omasum and dry omasum load (Table 11).

Correlation between wet (top-diagonal) and dry (bottom-diagonal) digesta load in various compartments and that of dry and wet matter in each compartment (bottom) in the gastrointestinal tract of Nguni goats (Exp. 2)
DISCUSSION
Intake and digestibility
Total tract digestibility was not affected by roughages quality in both sheep and goats. However, the digestibility was improved in goats than sheep, similar to Hadjigeorgiou et al [15], due to highly selective feeding behaviour in goats. This implies that goats selected leafy plant parts of much higher nutritional quality, as seen on digestibility compared to sheep [16]. Alcaide et al [17] reported no differences in digestibility between sheep and goats fed on alfalfa hay based diets. Grass stalks from IRQ and SIRQ tend to be softer than those from PRQ, hence goats are more likely to select them. Selective feeding in goats resulted in greater intakes of IRQ and SIRQ compared to PRQ. Although sheep are less selective compared to goats, it seems that sheep in this study preferred IRQ to PRQ. Sheep spent more time eating and maintained higher intake rates of IRQ compared to PRQ (Table 5) resulting in higher intakes of IRQ than PRQ. Digestibility of PRQ may not have increased with resident time in the rumen partly because sheep consumed the entire diet, requiring longer periods to digest it. Digestibility is a function of the size and intensity of microbial population in the rumen, so the PRQ may have not supplied enough energy and crude protein for the proliferation of microbes to aid and increase digestibility.
Reticulo-rumen digesta load, degradability, passage rate, and apparent digestibility
In ruminants, DM intake is a function of rumen digesta load, passage and degradation rates and feeding behaviour. Knowledge on the diurnal patterns of rumen load at and after meal termination is critical to the modelling of intake in ruminants. Taweel et al [18] and Williams et al [19] reported RF levels that were highest after termination of late afternoon feeding bouts just around dusk compared to other periods of the day. The RF levels reach their first maximum after the main morning meals, with a daily maximal RF being reached after the evening meal [20]. High rumen load after the termination of the evening feeding bout compared to morning and afternoon period may indicate presence of physiological and feeding behavioural control mechanisms on rumen load. At any given time, RF is a function of rates of DM intake, digestion, particle breakdown and outflow out of the rumen. Given that goats and sheep kept indoors eat less during the night [16], it means that these animals have to store enough feed in the rumen to remain in a state of satiation at night. Again, eating less at night may be equated to animals on a mini-fast or mini-starvation period during the night. In anticipation of this routine mini-starvation period at night, a high rumen load has to be maintained by high levels of intake during the eating session leading to dusk and slightly lowering passage rate to maximise nutrient extraction during feed degradation; hence, a level of high RF in the evening in goats.
Maximal RF levels at dusk may also be related to climatic conditions and adaptive mechanisms [18]. Intake is expected to reach its highest during the late afternoon when temperatures are cool given that summer temperatures can be extremely high in the late morning and early afternoon in tropical and subtropical regions. High intake levels just before dusk when ambient temperatures have cooled may explain high levels of RF in the evening in goats in this study. Reduction of predation risk by adoption of adaptive mechanisms such as engaging in feeding behaviours that improve vigilance at night [16] may partly be responsible for high RF levels in the evening.
Passage of solid digesta from the rumen relies on the extent and how fast solid digesta is fermented by microbial populations in the rumen. In this study, high fractional passage rate of solids through the rumen were due to IRQ supplying extra non-protein nitrogen from urea compared to the PRQ. These were used for proliferation of microbial populations that increased the ED and rate of degradation of the IRQ. This means that particles from IRQ reached the critical particle size quickly to allow solid particles to pass out of the rumen compared to PRQ. Hence, solid digesta passage out of the rumen was faster for the IRQ. Generally, solid passage rates for both roughage qualities were lower than those of Schlecht et al [21] in Sahelian sheep fed tropical bush hay. Similar to this study, Nsahlai et al [22] observed low fractional passage rates of solid (0.011 to 0.03 per h) in Ethiopian Menz sheep fed on poor quality roughage. Undernutrition from feeding PRQ may be correlated to “starvation” and may explain why sheep retained solid digesta for a long time. It appears reasonable to generalise that starved ruminants may withhold solid digesta for extended periods of time in the rumen [23]. More work needs to be done to ascertain the effects of prolonged starvation on solid and liquid fractional passage rates in ruminants grazing on poor quality roughages in subtropical and tropical regions.
The SF in the rumen of sheep observed in this study for both roughage qualities are within the range of 1.6 to 3.8 for grazing ruminants [14]. High SF for PRQ than IRQ strongly supports the view that grazing ruminants adapted to poor quality roughages retain solid digesta for extended periods of time. The SF are used to describe ruminant ecological differences and find application in the classification of ruminants into different feeding types [14]. Rumen retention time is partly a function of roughage quality. In the context of this study, SF may be used to describe physiological differences in the degree of adaptation of ruminants to different roughage qualities. This would suggest that ruminants with SF close to 3.8 would be well adapted to low quality roughages, which is typical to ruminants that inhabit subtropical and tropical regions; explaining the high SF observed for sheep fed PRQ.
Technically, proportions of rumen digesta load that disappeared at various times after feeding represented fractional clearance rate of digesta from the rumen. This clearance rate is a sum of rates of passage and degradation. On average the proportion of fluid digesta to total digesta in the rumen lies within the range of 80% to 90% [24], which is similar to results obtained in this study. Contrary to findings of this study, wet and dry rumen digesta load decreased consistently with time (3>7.5>12 h) after feeding stopped in buffalo fed on alfalfa hay [25]. Reticulo-rumen digesta load for wet and DM at 0 h were significantly higher than digesta load 10 h post-feeding in sheep fed alfalfa hay regardless of intake levels [26]. Oshita et al [27] reported 39% to 43% reductions in rumen DM load over a 21 h period after feeding in cattle. Similar to findings of this study, Sekine et al [28] reported null effects of time after feeding on wet and dry rumen digesta load in sheep. Lack of effect of time lapse after feeding on rumen load in this study may have been due to starving sheep for a 17 h period prior to re-feeding to RF. Again, providing feed for one feeding bout that lasted on average for not more than 1 h and removing the feed (“a second starving”) for up to 24 h depending on slaughter time may explain these discrepancies.
Firstly, it is possible that ruminants anticipating long periods of hunger may develop inbuilt disappearance rate control mechanisms by slowing down rates of emptying of digesta from the rumen to maximise nutrient utilisation making it impossible to rapidly attain a critical level RF. Overnight starvation of 16.6 h reduced the rumen DM and NDF digesta load by −58% and −56%, respectively, with reference to the fill level prior to starvation [29]. Hence, long starvation periods may explain the very low fill levels. Starvation may have caused sheep to have similar fill levels regardless of time after feeding in this study. Secondly, results from this study on goats in conformity to those of Taweel et al [18] and Baumont et al [20] suggested that RF is highest at night after termination of dusk feeding session. Removal of feed at 1,500 hrs a day prior to slaughter meant that rumen digesta load would be low in the morning of slaughter in this study due to restricted or low intake during the dusk feeding session. In this study, it was expected that starving animals overnight and then reintroducing animals to feed would result to high intake and maximal RF after the main morning meal as per observations of Baumont et al [20], however, this may not have been the case. Lastly, based on in-sacco degradability obtained in this study, DM loss at 24 h was approximately 35% (PRQ) and 46% (IRQ).
Starvation may have resulted in most of the sheep having RF levels that are similar and close to a “theoretical” residual RF. When RF levels reach this residual value, the rate of emptying of digesta load through passage would be expected to be very low, and under the control of the animal’s physiological status. This implies that effects of roughage quality and time lapse after feeding would have no effect on RF levels in this study. Whether digesta passage rate preceding a starvation period in ruminants is under voluntary or involuntary control still remains unknown and warrants further research.
Digesta clearance due to passage rate is mainly determined by reticulorumen contractions. Frequencies of rumen contractions per minute are highest during eating and lowest during idling, with a general tendency of eating>ruminating>resting [30]. It is expected that the intensity and frequencies of these contractions would decrease with duration after feeding. It seems that passage rate had a negligible effect on emptying of rumen load after feeding due low amplitude and frequency of rumen contractions. Degradability rate, which is less influenced by animal factors, would be, largely, responsible for digesta clearance.
In ruminants, the omasum has been implicated in control of passage of coarse particulate matter from the rumen into the abomasum [31]. Negative correlations between wet rumen and abomasum, and dry rumen and wet abomasum digesta loads (in goats) suggests that the omasum partly regulates solid and liquid digesta passage out of the rumen. When rumen load is high after feeding, the omasum increases the amount of rumen liquid passing into the abomasum to allow efficient degradation of feed and microbial multiplication. Following disappearance of rumen digesta by degradation, more feed per unit time is allowed to pass through the omasum into the abomasum. However, the absence of these relationships in sheep suggests that the regulation of digesta clearance in starved ruminants does not occur through passage rate. This substantiates the claim that clearance of rumen load in starved animals could be largely governed after feeding by degradation rate. More studies need to ascertain the mechanisms of control of digesta clearance from the rumen in response to prolonged starvation.
Based on the regression of dry rumen load after feeding, digesta load decreased gradually with time in sheep fed improved quality roughage. For some unknown reason, the 12 h post feeding RF for 2 sheep fed on the poor quality roughage were unexpectedly higher than the 0 and 6 h values (Figure 2). Daily progressions in DM intake in ruminants fluctuate in a cyclic nature; following “transverse” wave-like patterns. It may be coincidental that sheep slaughtered at 12 h after feeding were at peak of their intake while those slaughtered at 0 and 6 h after feeding were at their trough. High variations in daily intake may be responsible for the differences in RF. These results also suggest that the dynamics of rumen digesta kinetics after feeding are still not entirely understood. Firstly, these 2 outlying points reveal that individual ruminants adapt differently to roughages of poor quality [4]. The RF levels fluctuate greatly in individual ruminants and are dependent on the amount of receptive space in the rumen that can accommodate feed. Fluctuation in RF is determined by feed intake based on the desire to eat and is largely governed by rates of passage and degradation. Secondly, all rumen digesta load was scaled to 100 kg of BW at slaughter. Rumen digesta load was not affected by dietary treatments when scaled to BW at slaughter, but were significant when scaled to total stomach weight [32]. Knowledge of RF levels based on animal production level and degree of maturity may be important in this context.
Once these two points were eliminated as “outliers”, the best regression fit showed a linear decrease in proportion of rumen load with duration after feeding for both roughage qualities. The rate of decrease of DM load and proportion of DM load with time after feeding was greater for the IRQ compared to PRQ. It is possible that cellulolytic bacterial populations were greater in the rumen of sheep fed on the IRQ, reflecting a higher rate of cellulose degradation of IRQ compared to PRQ. Strikingly similar to findings in this study in cattle starved overnight, Bosch et al [33] reported linear decrease in rumen load after feeding (0.5 to 22.5 h) in cattle fed on silages. Huhtanen et al [34] reported a linear trend in the disappearance of rumen digesta load from 3 h to 12 h after feeding in cattle (29% decrease). It was hypothesised that the decrease would take an exponential decay trend rather than a linear trend. Linear decreases in the proportion of digesta load from the rumen with time after feeding has stopped do not conform to the proposed concept of the existence of a residual RF value. Trends that take an exponential decay curve for the proportion of fill with time lapse after feeding would have a point where the proportion of digesta load left in the rumen decreases at a decreasing rate; reaching a residual fill level where the rate of passage would likely have a negligible effect on digesta clearance rate. It is possible that the observed linear trend represents the straight segment of the exponential curve suggesting a linear trend only up to 24 h beyond which no sampling was entertained for ethical reasons. However, simulation of the digesta load beyond 24 h agrees with the exponential decay trend leading to a residual fill level. Similarly, disappearance of NDF and digestible NDF from the rumen after feeding were exponential [34]. Digesta load in the rumen decreased linearly up to 24 h post feeding termination regardless of roughage quality although it is possible that this trend shapes into an exponential “decay” within a short phase.
The slower fractional passage rate of solids in sheep fed PRQ conform to the view that ruminants fed on low quality roughage generally have long MRT in the rumen (as an adaptation strategy); giving adequate time for particle size reduction of the PRQ to occur before digesta passes out of the reticulo-omasal orifice. Long MRT’s of PRQ complements its slower degradation rate to increase nutrient extraction and microbial yield. Passage rates would play a negligible role in digesta clearance in starved ruminants fed poor quality roughages. The rate parameter on the exponential curve in this study may represent the degradation rate of the slowly degradable fraction of fibre rather than the sum of rates of degradation and passage. Based on the exponential curve, the high rate at which the proportion of IRQ disappeared is supported by the observed higher degradation rate of IRQ than PRQ.
The RF levels for NDF (kg fibre/100 kg BW) is 1.7 for ruminants feeding on temperate roughages [35]. The average rumen load for NDF in this study was greater than 1.7 for all roughage qualities in both goats (1.8 to 2.3 kg fibre/100 kg BW) and sheep (1.9 to 3.0 kg fibre/100 kg BW). Goats selected plant parts containing less NDF compared to sheep, contrary to Hadjigeorgiou et al [15]. High SF may have been due to slow digesta degradation and passage rates. These results suggest that ruminants adapt differently to roughages and that larger RF for NDF are expected for ruminants in the tropics [4] compared to those in temperate regions. This would entail longer rumination times in tropical ruminants compared to those from temperate regions.
Abomasal and hindgut digesta load
The effect of diet on dry abomasum load is similar to Álvarez-Rodríguez et al [36]. Lambs fed alfalfa had low abomasal digesta load compared to those fed concentrate [36]. Goats and sheep fed on IRQ had low abomasum digesta load than those fed on PRQ. However, there was a tendency for the wet and dry digesta load in the small intestines and caecum to be higher in IRQ than PRQ in sheep, which is contrary to the order: IRQ< PRQ<SIRQ observed in goats. The observations of low digesta load in the small intestines and caecum seen in goats were due to high digestibility of the IRQ compared to the PRQ and of goats selecting the most digestible components. Higher digesta passage rate and digestibility of IRQ may have resulted in lower digesta load in the omasum and abomasum compartments in sheep fed IRQ. A decrease in omasal digesta load with time up to 12 h post feeding is similar to Waghorn et al [26]. Similar to findings in this study, time lapse after feeding had no effects on digesta load in the abomasum [26].
Improvements in roughage quality did not affect the wet digesta load in the hindgut of sheep and goats. The lack of dietary effects on dry digesta load in the hindgut is similar to results obtained for the small intestines and caecum [36] in lambs. Contrary to findings in this study, dry digesta load in the colon was influenced by diet [36]. In this study, DM load (kg/mCL/100 kg BM) in the colon was affected by time post feeding termination only after scaling to compartment length and BW. A significant relationship between the wet digesta in the caecum and colon suggests little regulation of digesta flow between these compartments.
CONCLUSION
Improvement of roughage quality increased solid passage rate but did not affect liquid digesta passage rates from the rumen. Rumen digesta load is highest in the evening in goats. Proportions of digesta load in the rumen decreased linearly up to 24 h after feeding regardless of roughage quality. Based on the observed fractional rate of disappearance using the exponential model it was concluded that passage rate had a negligible effect on digesta clearance after feeding when preceded by starvation. Thus, in this study following a brief starvation, RF could have been largely governed after feeding by degradation rate (RF = f[kd]). With the impending decrease in forage quality due to global warming, adaptation of rumen physiology and anatomy, and intake in small ruminants to poor quality roughages warrants further research.
ACKNOWLEDGMENTS
The work was financially supported by the National Research Foundation of the Republic of South Africa (Project name: Intake of roughage by ruminant herbivores, GUN: 87738). The authors are thankful to the staff in the Livestock Section of Ukulinga Research Farm, University of KwaZulu-Natal, Pietermaritzburg, for caring for the animals.
Notes
CONFLICT OF INTEREST
We certify that there is no conflict of interest with any financial organization regarding the material discussed in the manuscript.